

Key Takeaways
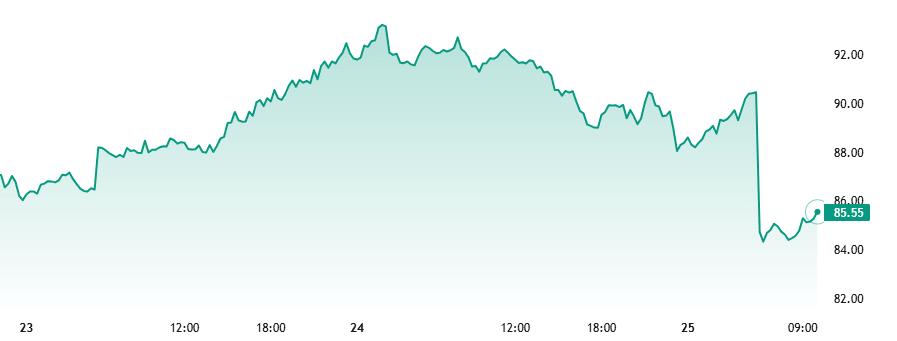
Today’s Focus: Markets will assess China’s newly released growth and consumption figures ahead of Tuesday’s loan prime rate announcement. Canadian September CPI is due at 20:30 (GMT+8), with annual inflation forecast at 3.2%, versus 3.0% previously. Hong Kong’s cash equity market is closed for the Double Ninth Festival. This week’s technology earnings will provide more insight into AI spending and profitability, while oil markets will monitor sanctions policy and Middle East supply developments. |
Global Market Review 19/10/2026
- Friday’s cash closes: the Dow fell 0.34% to 52,002.41, the S&P 500 declined 1.09% to 7,659.44, and the Nasdaq 100 lost 2.50% to 29,187.55.
- The Dollar Index traded near 101.60 after Warsh’s remarks on Friday.
- The latest Treasury snapshot shows the 2-year yield at 4.706%, down 3.0 basis points, and the 10-year at 5.059%, down 4.1 basis points.
- Early Monday quotes put Brent at $108.06, down 1.6%, WTI at $100.70, down 0.7%, and gold at about $4,181, up 0.4%.
Economic Calendar
Key Events on October 19 (GMT+8)
- Hong Kong Holiday – Double Ninth Festival
| Time (GMT+8) | Event | Importance |
|---|---|---|
| 10:00 | CN GDP Growth YoY Q3 | ** |
| 10:00 | CN Retail Sales YoY SEP | ** |
| 20:30 | CA CPI YoY SEP | ** |
Key Events on October 20 (GMT+8)
- Four-hour chart levels; chart quotes and market-review snapshots may differ in timing.
| Time (GMT+8) | Event | Importance |
|---|---|---|
| 09:15 | CN 1Y & 5Y LPR OCT | ** |
| 14:00 | Germany PPI YoY SEP | ** |
| 14:00 | UK Unemployment Rate AUG | ** |
| 17:00 | EU ZEW Economic Sentiment OCT | ** |
| 20:15 | US ADP Weekly Employment Change | ** |
| 20:30 | US Building Permits & Housing Starts SEP | ** |
Markets Analysis 19/10/2026
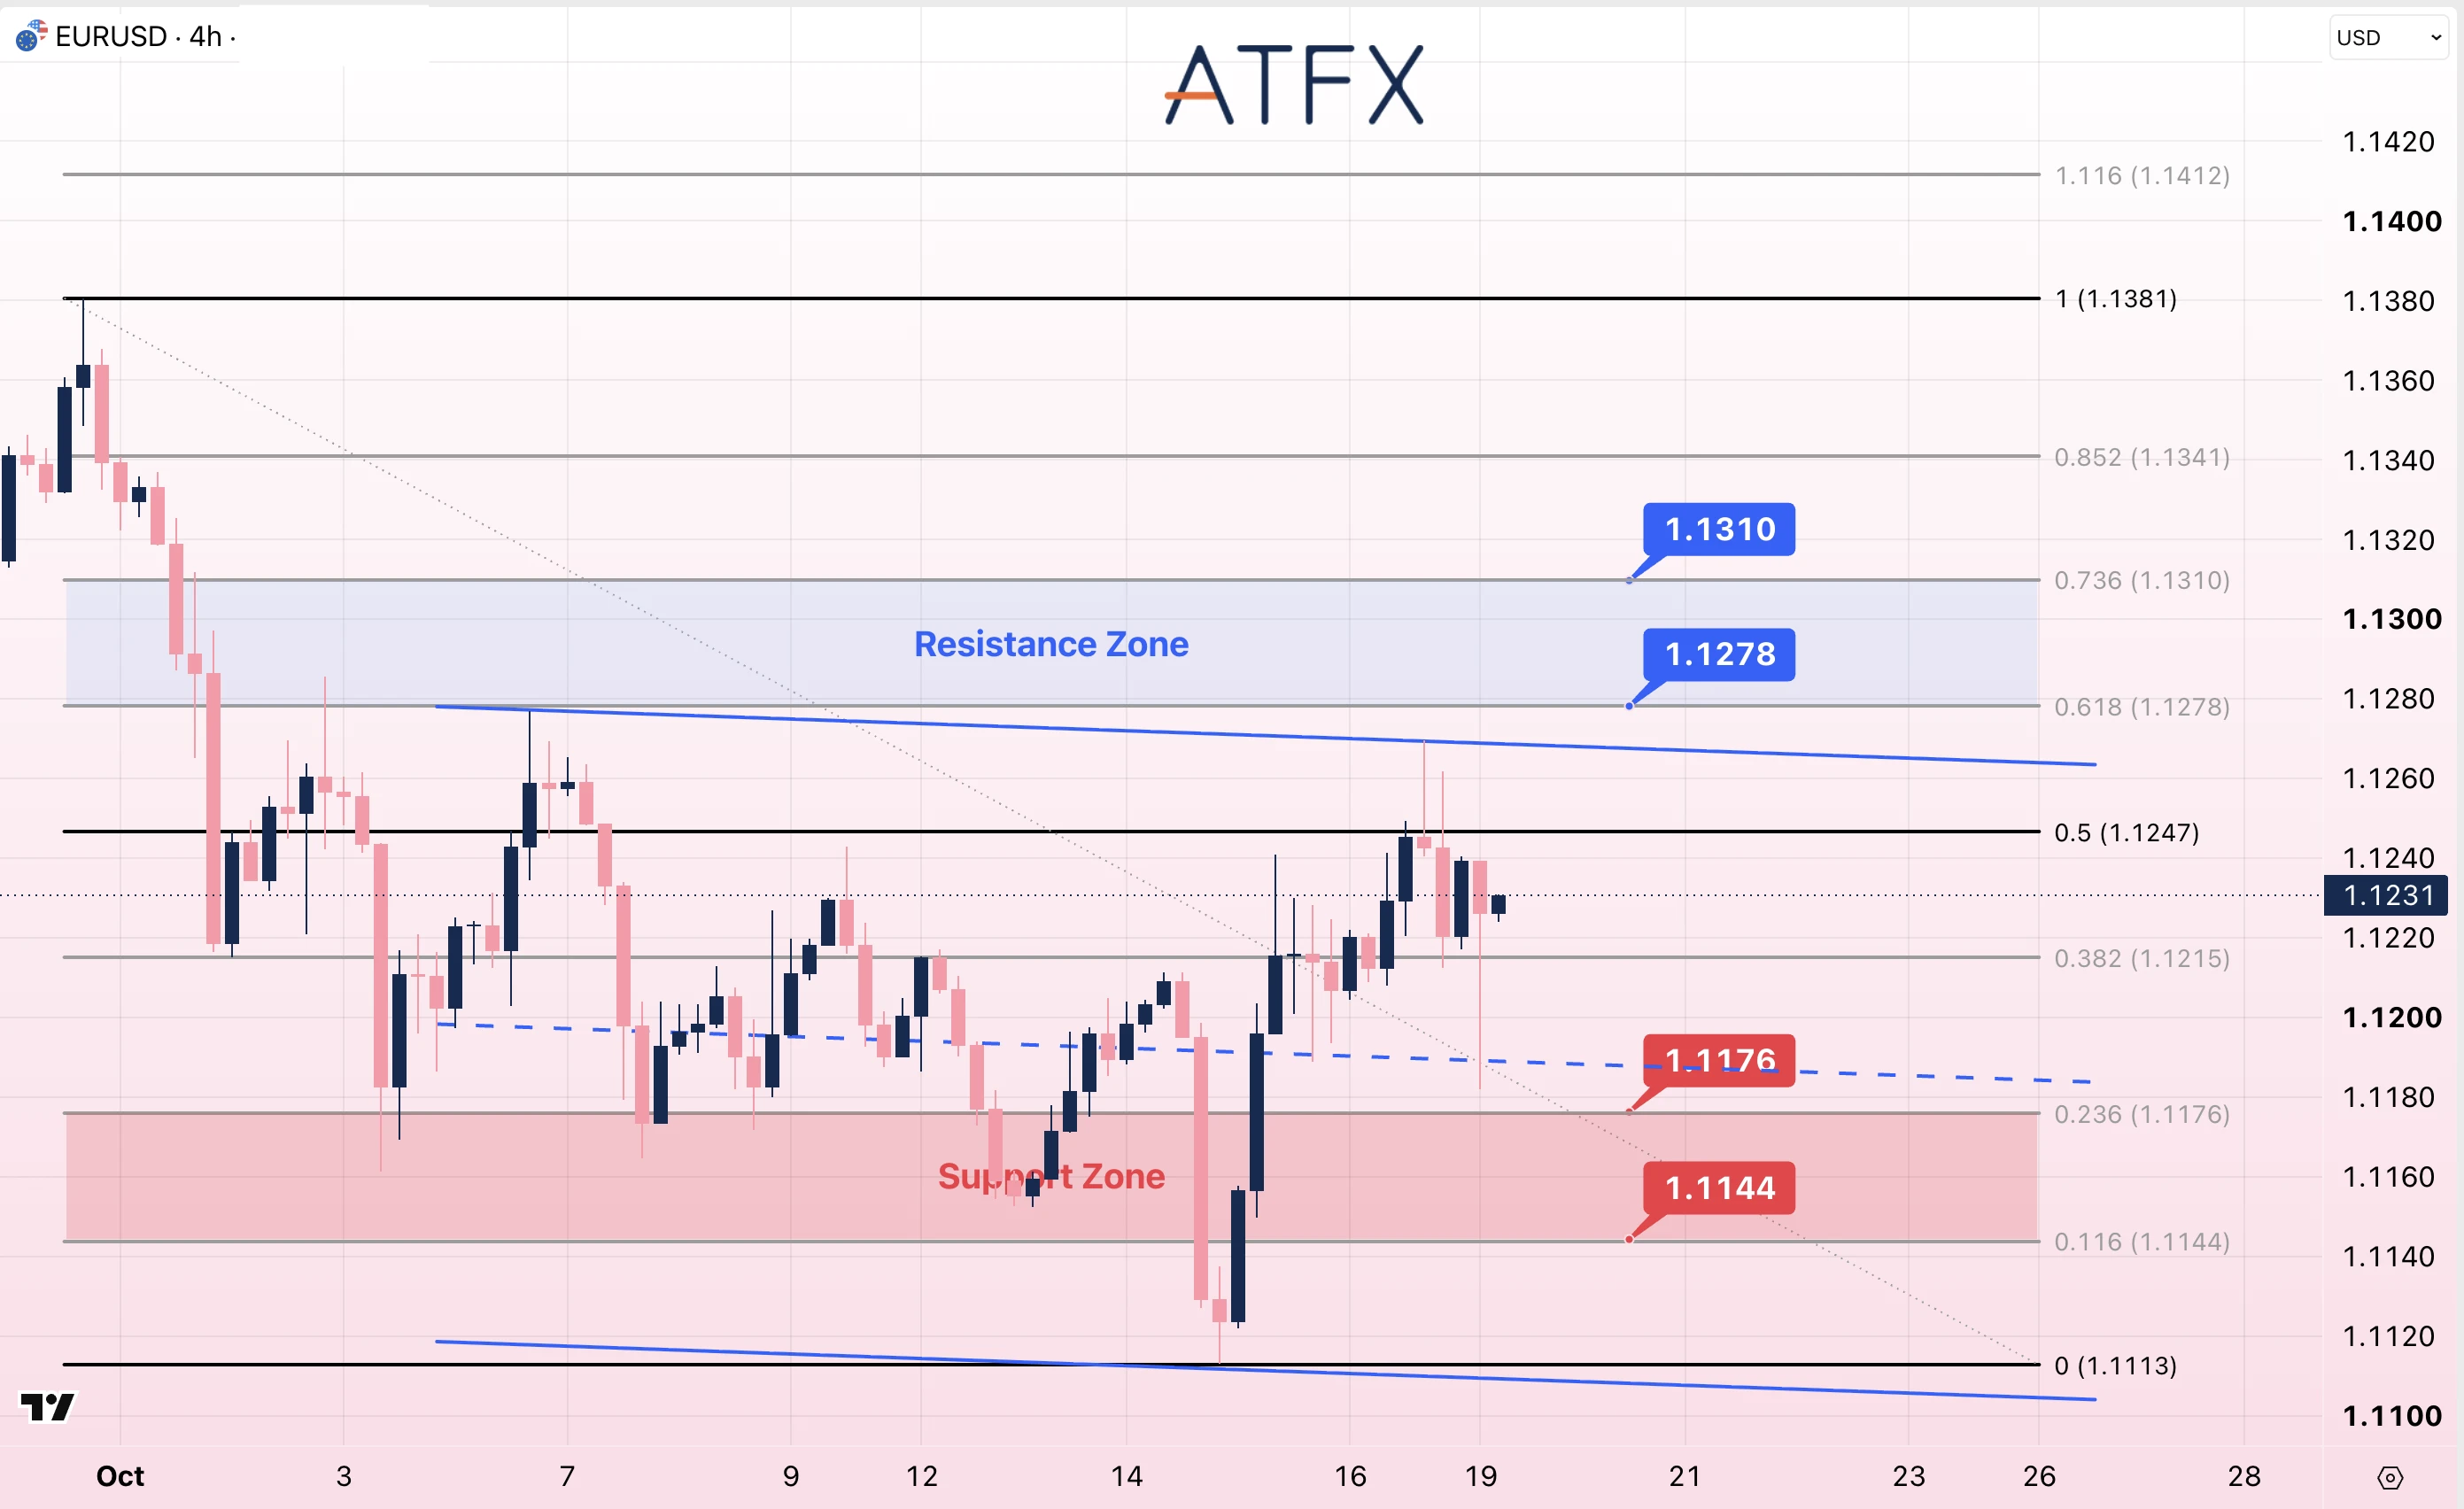
- Resistance: 1.1278/1.1310
- Support: 1.1176/1.1144
Technical Overview: EUR/USD is near 1.1231 after rebounding from 1.1113. Price is above the gently descending channel’s midline and the 1.1215 Fibonacci level, but below the 1.1247 intermediate level. A move above 1.1278 would bring 1.1310 into focus. Below 1.1176, the next marked support is 1.1144.
Bias: Neutral to Cautiously Bullish
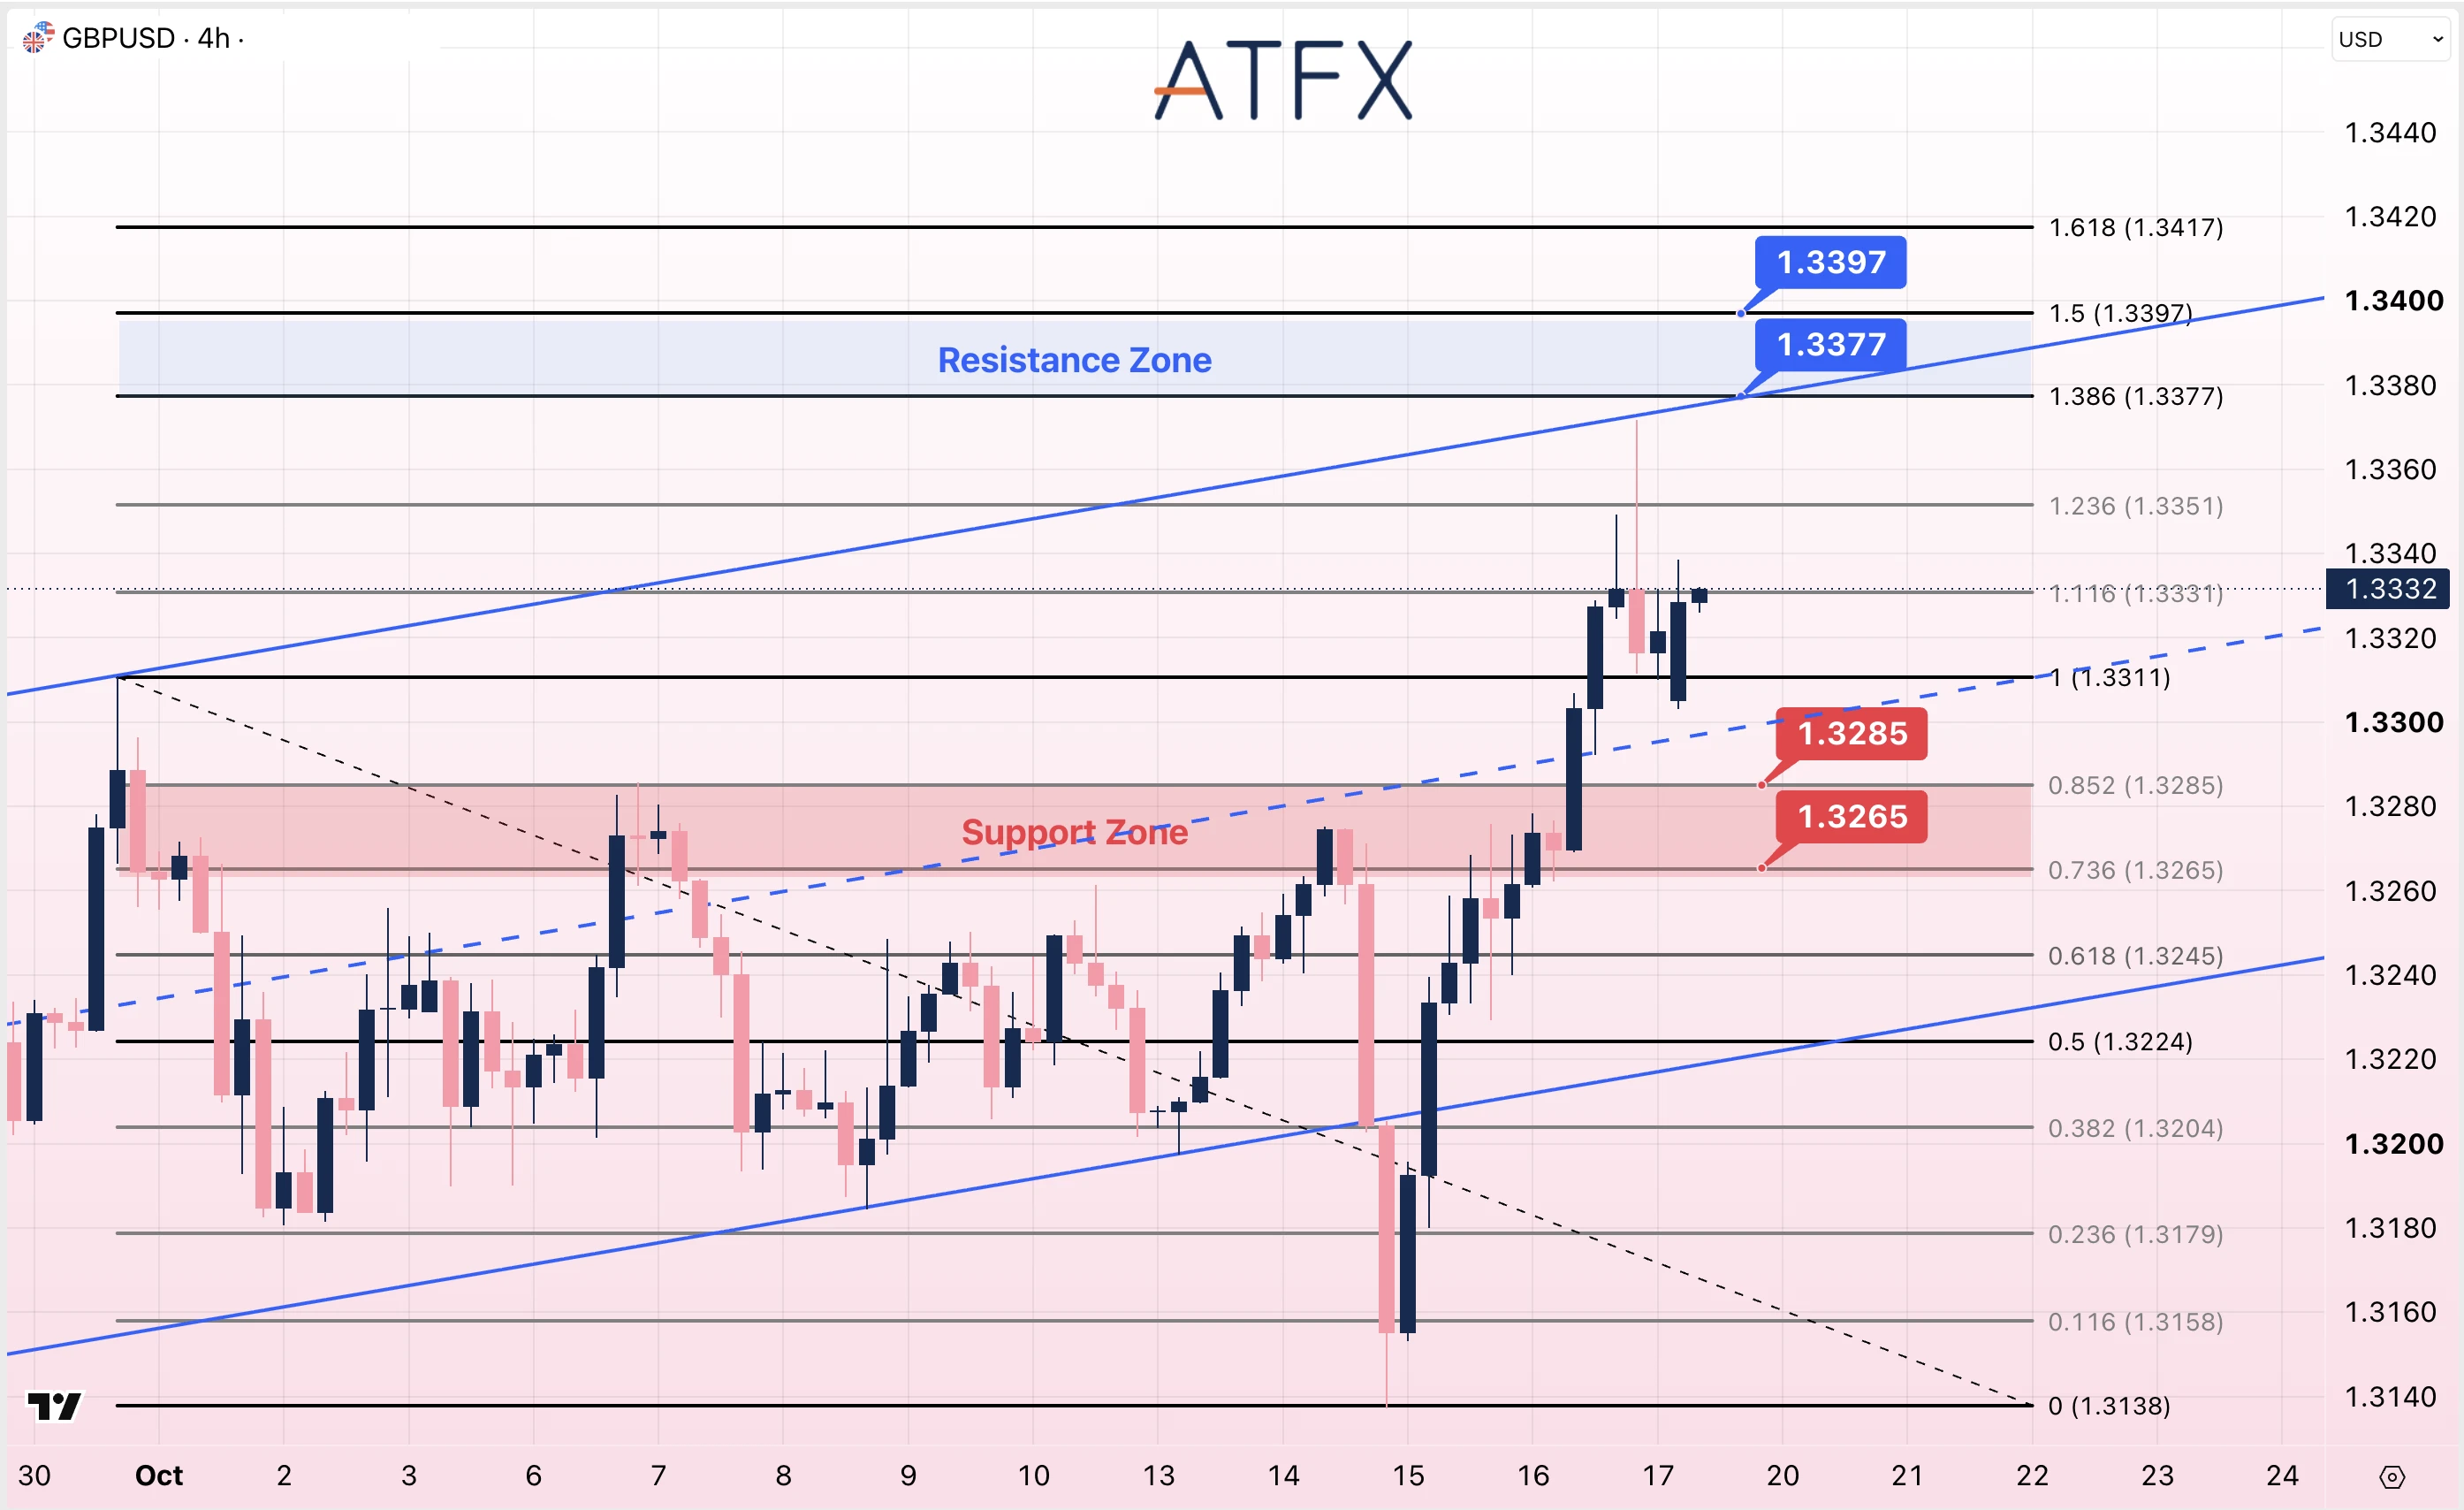
- Resistance: 1.3377/1.3397
- Support: 1.3285/1.3265
Technical Overview: GBP/USD is near 1.3332 after pulling back from around 1.3370. Price remains above the rising channel’s midline and the 1.3311 pivot. The intermediate level at 1.3351 precedes marked resistance at 1.3377/1.3397. A move below 1.3285 would put 1.3265 next among the marked support levels.
Bias: Mildly Bullish
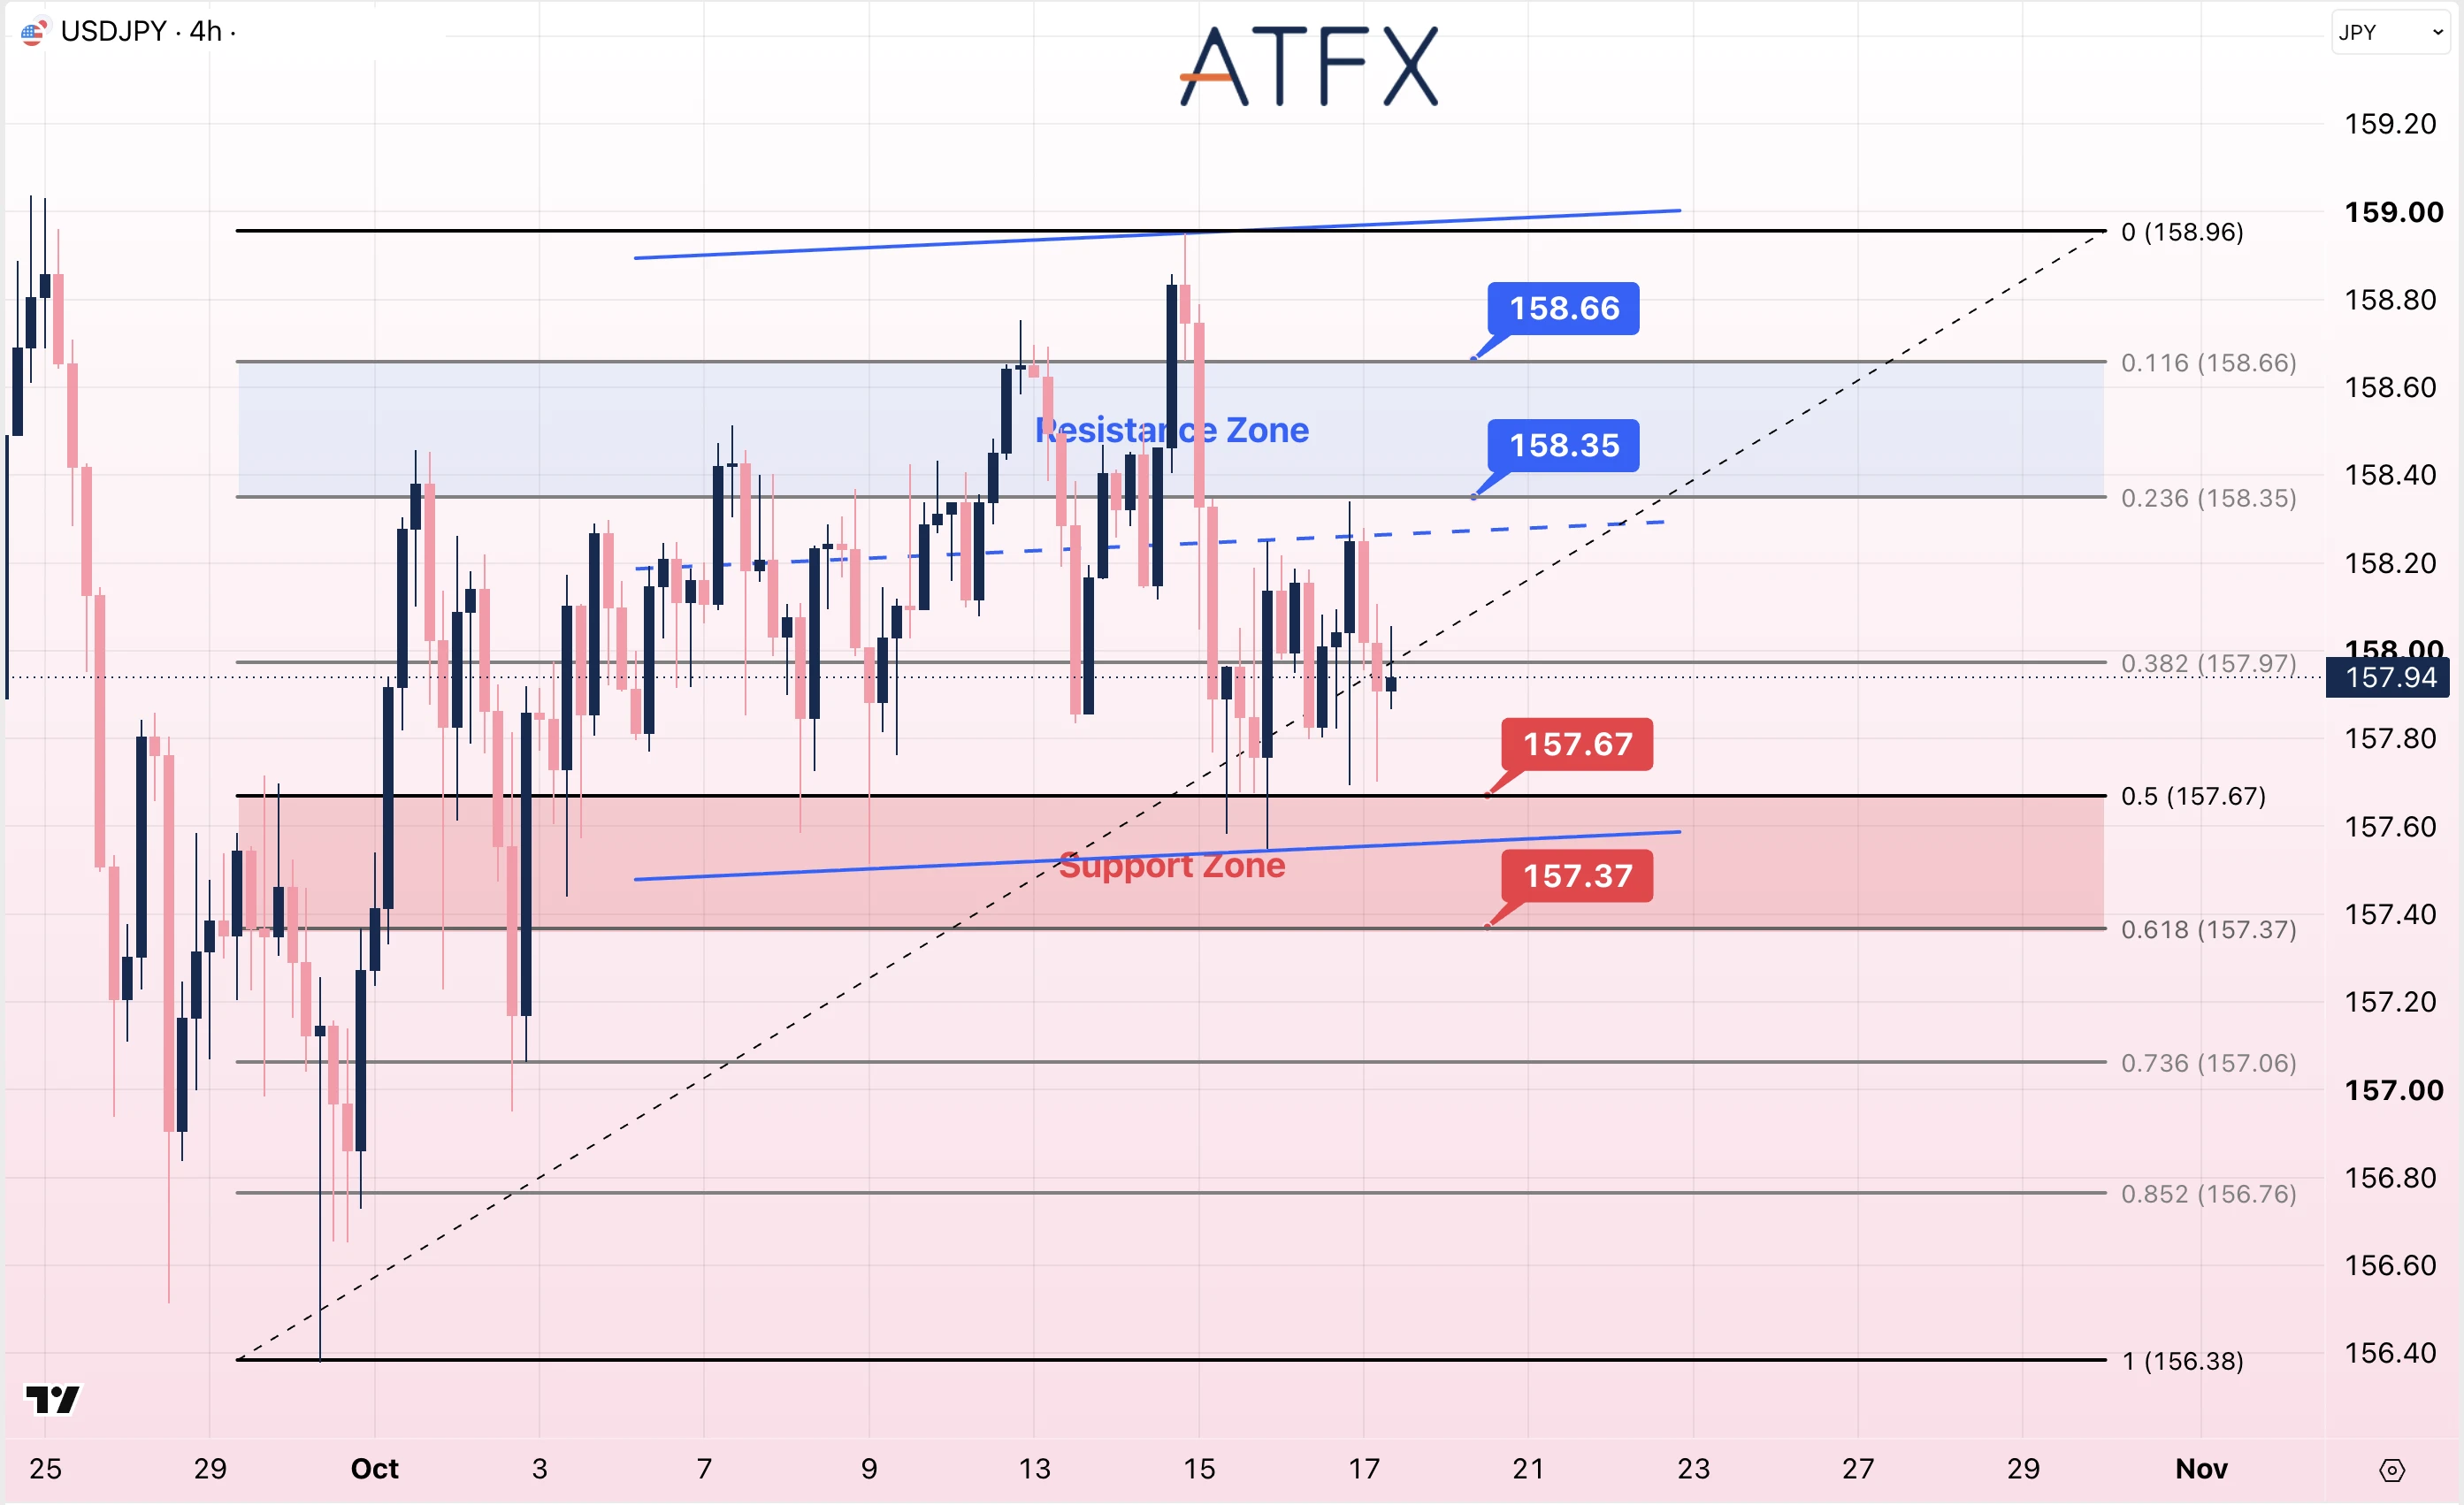
- Resistance: 158.35/158.66
- Support: 157.67/157.37
Technical Overview: USD/JPY is near 157.94, below the midline of the gently rising channel and close to the 157.97 Fibonacci level. Price remains in the lower half of the channel. A recovery above 158.35 would bring 158.66 into focus. A move below 157.67 would leave 157.37 as the next marked support.
Bias: Neutral to Cautiously Bearish
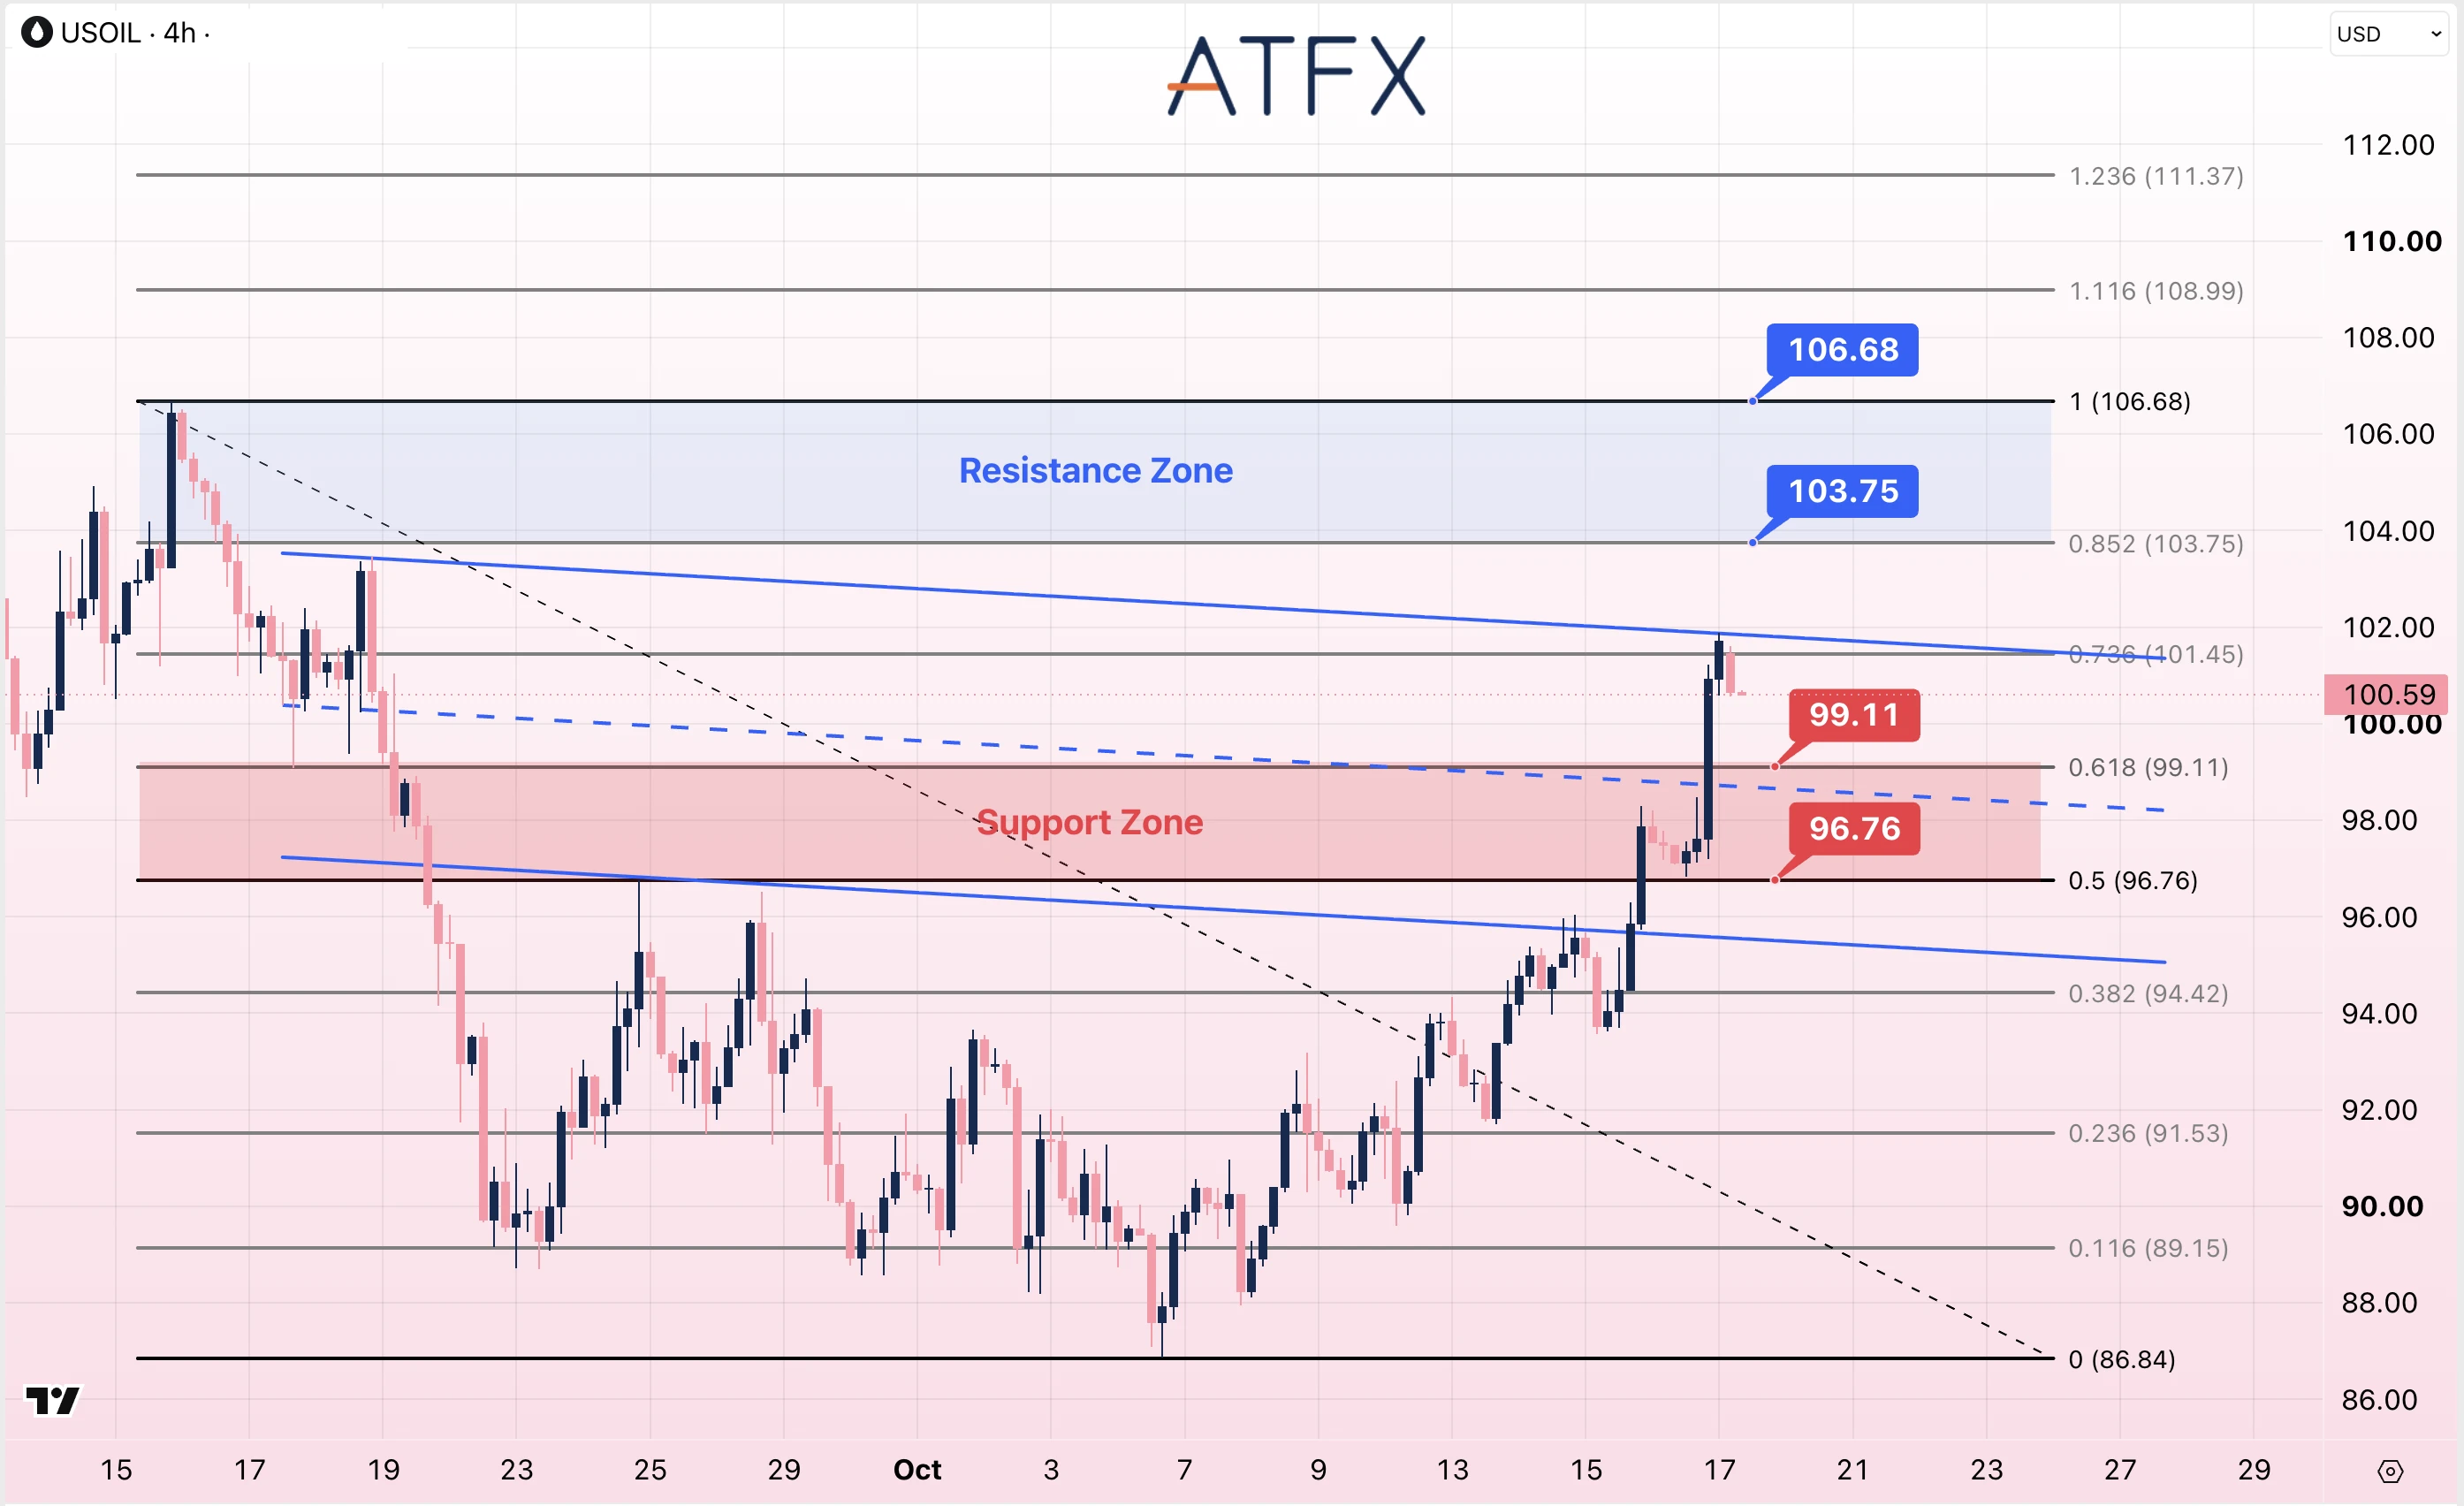
- Resistance: 103.75/106.68
- Support: 99.11/96.76
Technical Overview: USOIL is near $100.59 after testing the upper boundary of the descending channel around $101.70. Price remains above the midline but below the $101.45 Fibonacci level. A recovery through that level would precede marked resistance at $103.75/$106.68. Below $99.11, the next marked support is $96.76.
Bias: Neutral to Cautiously Bullish
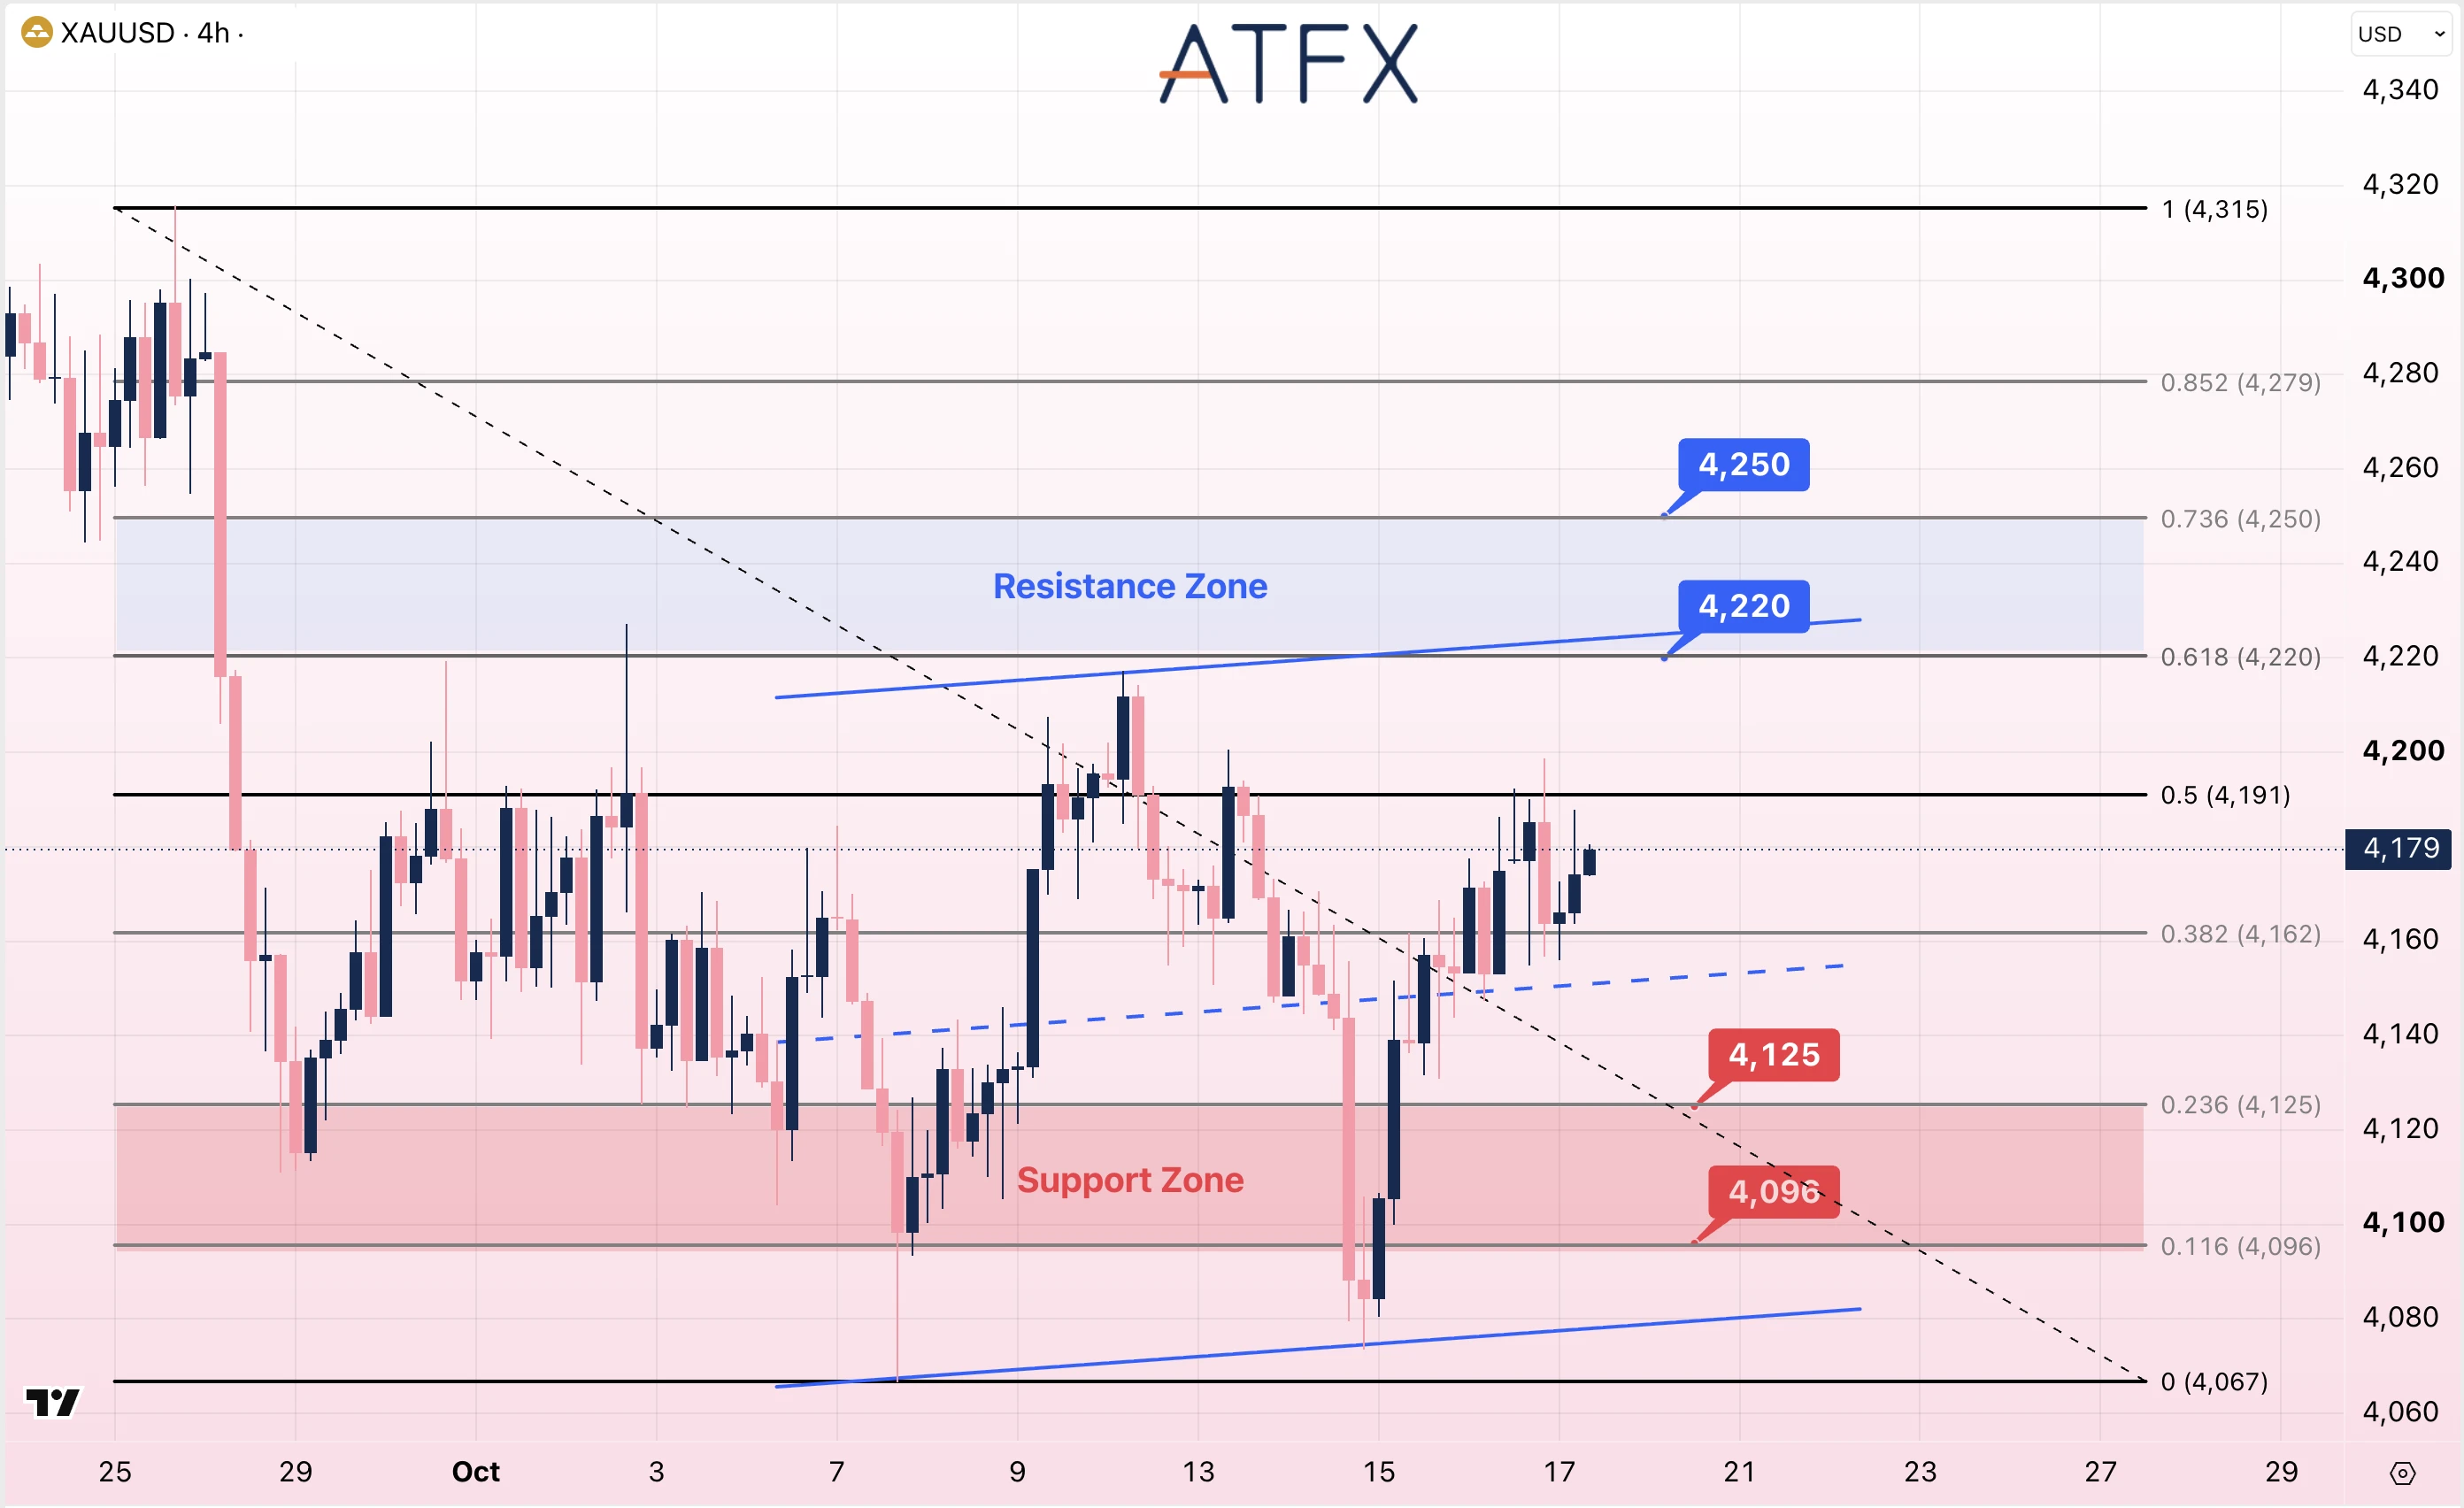
- Resistance: 4220/4250
- Support: 4125/4096
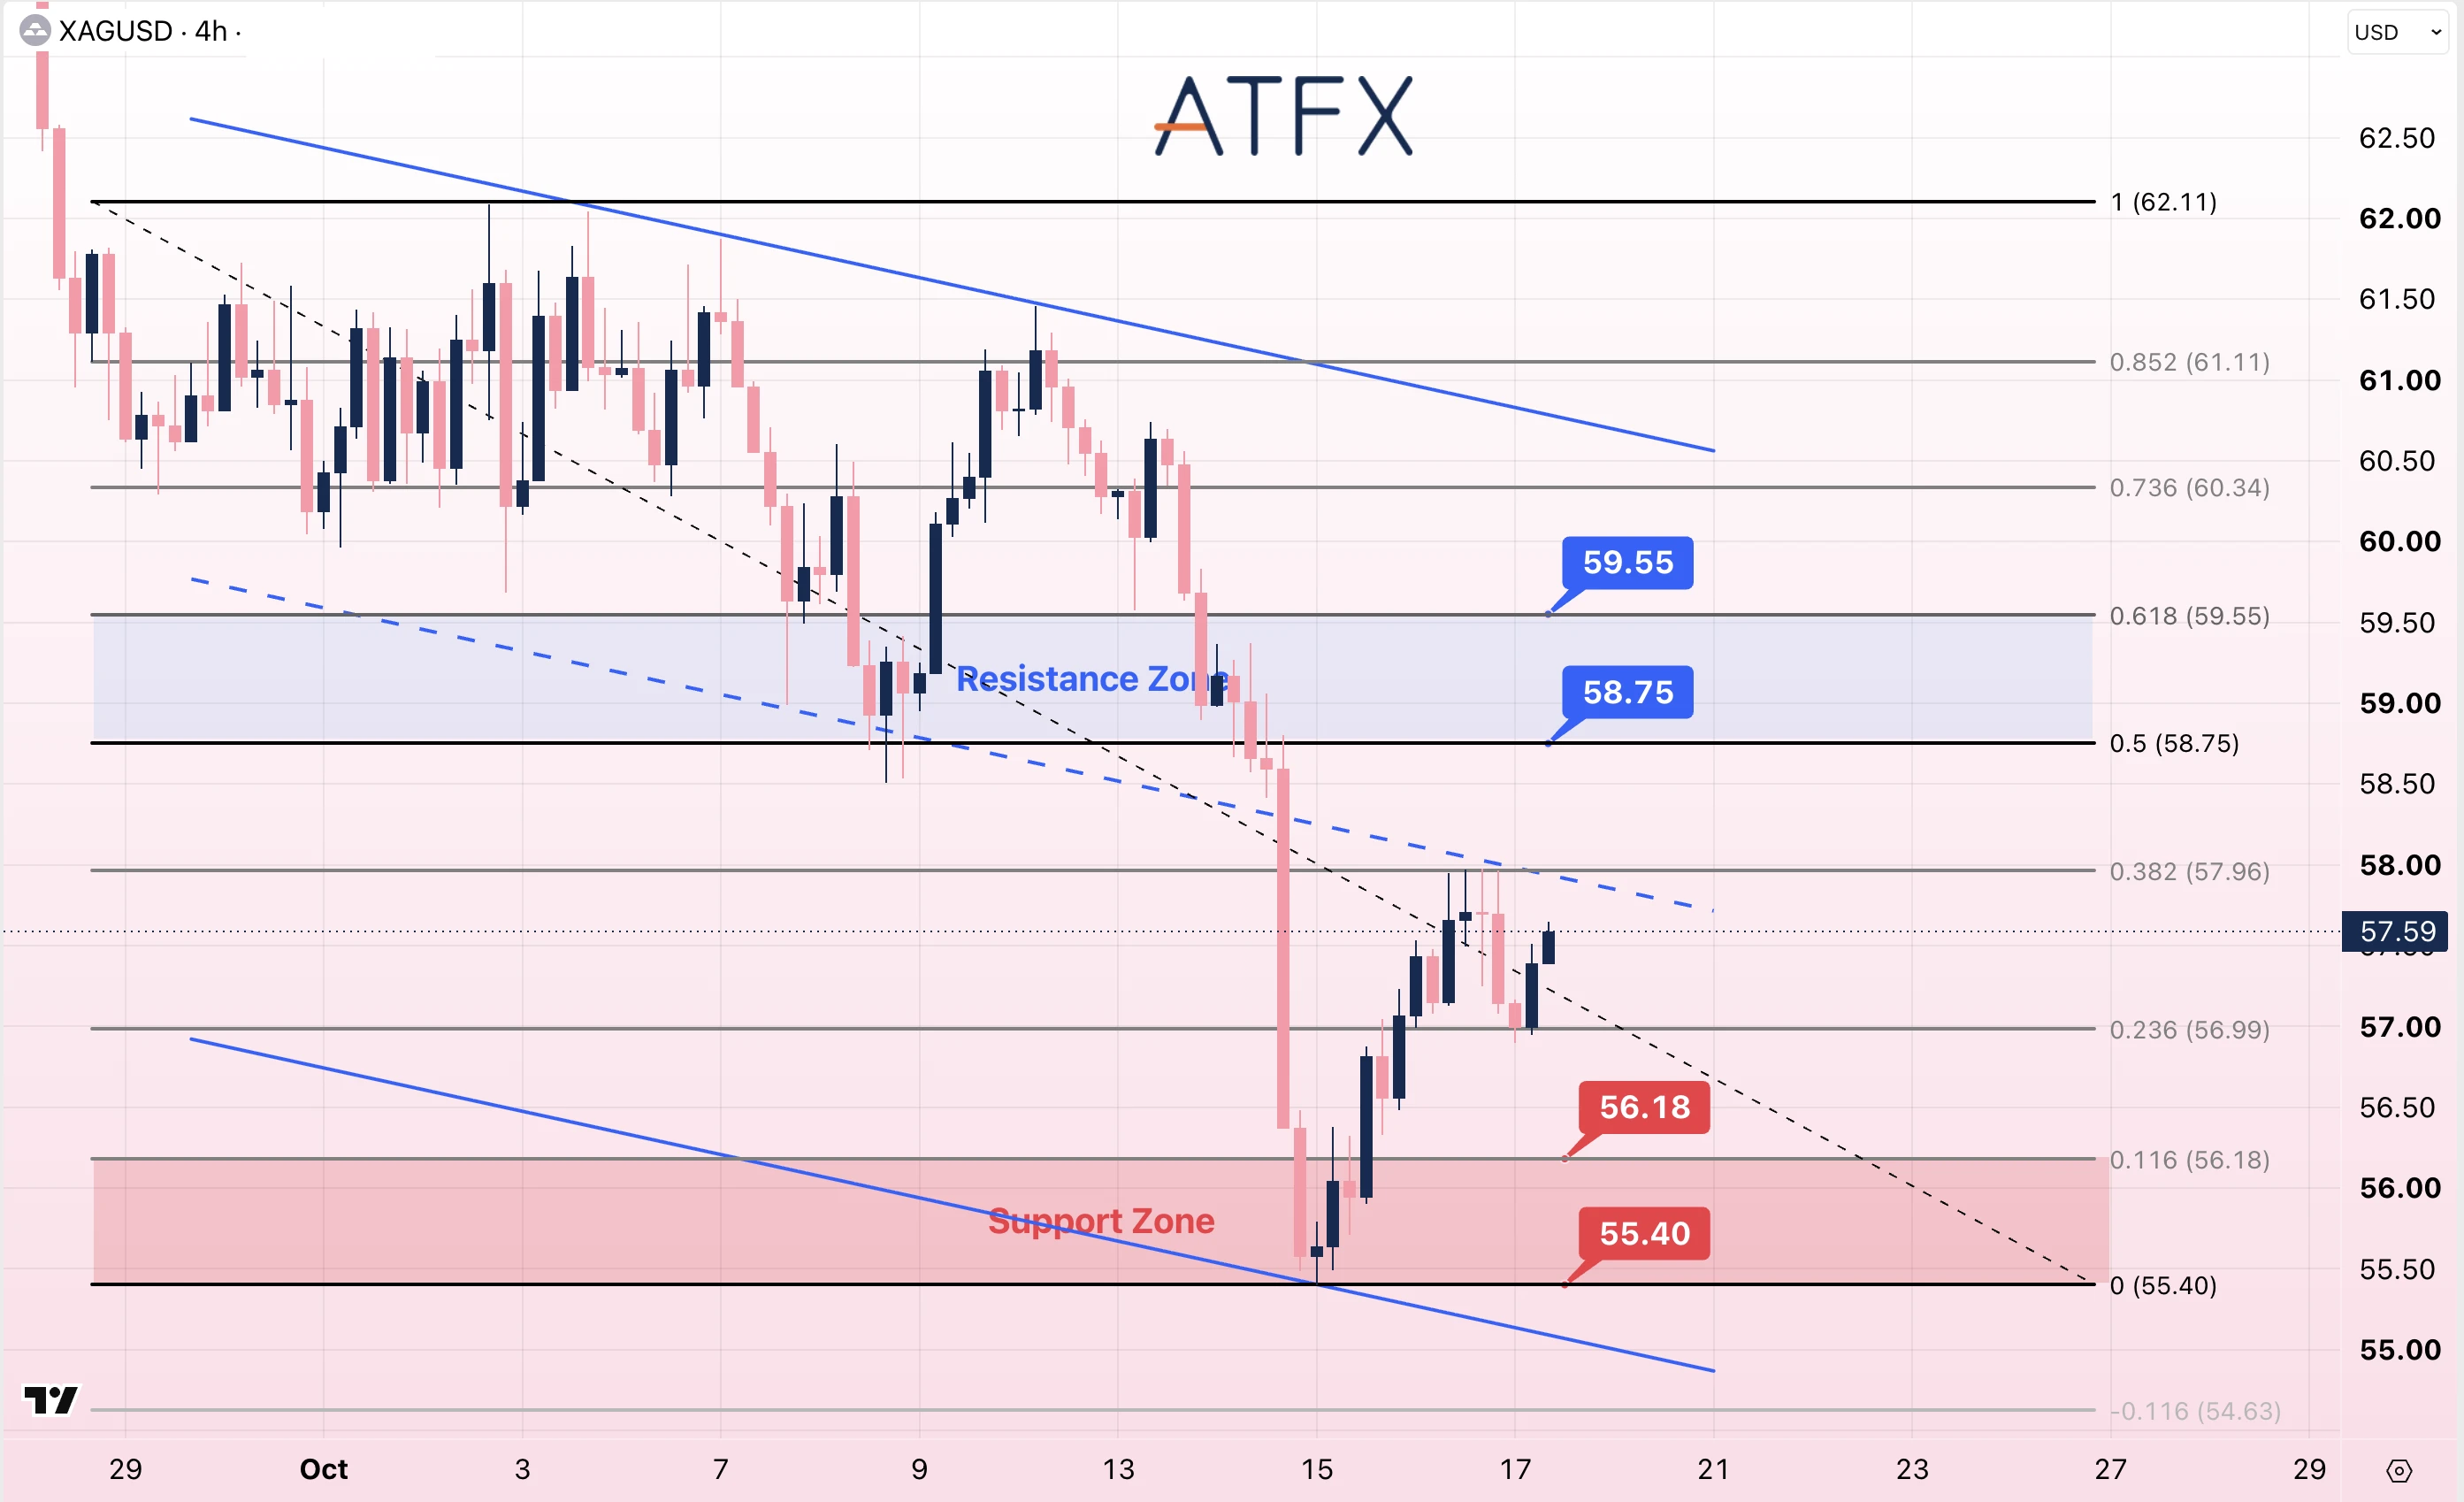
- Resistance: 58.75/59.55
- Support: 56.18/55.40
Technical Overview: Gold is near $4,179, above the rising channel’s midline and the $4,162 Fibonacci level. The $4,191 pivot precedes marked resistance at $4,220/$4,250. Below $4,125, the next marked support is $4,096.
Silver is near $57.59 after rebounding from $55.40. Price remains below the descending channel’s midline and the $57.96 Fibonacci level. Marked resistance is at $58.75/$59.55. A move below $56.18 would return attention to $55.40.
Bias: Gold Neutral to Cautiously Bullish; Silver Cautiously Bearish
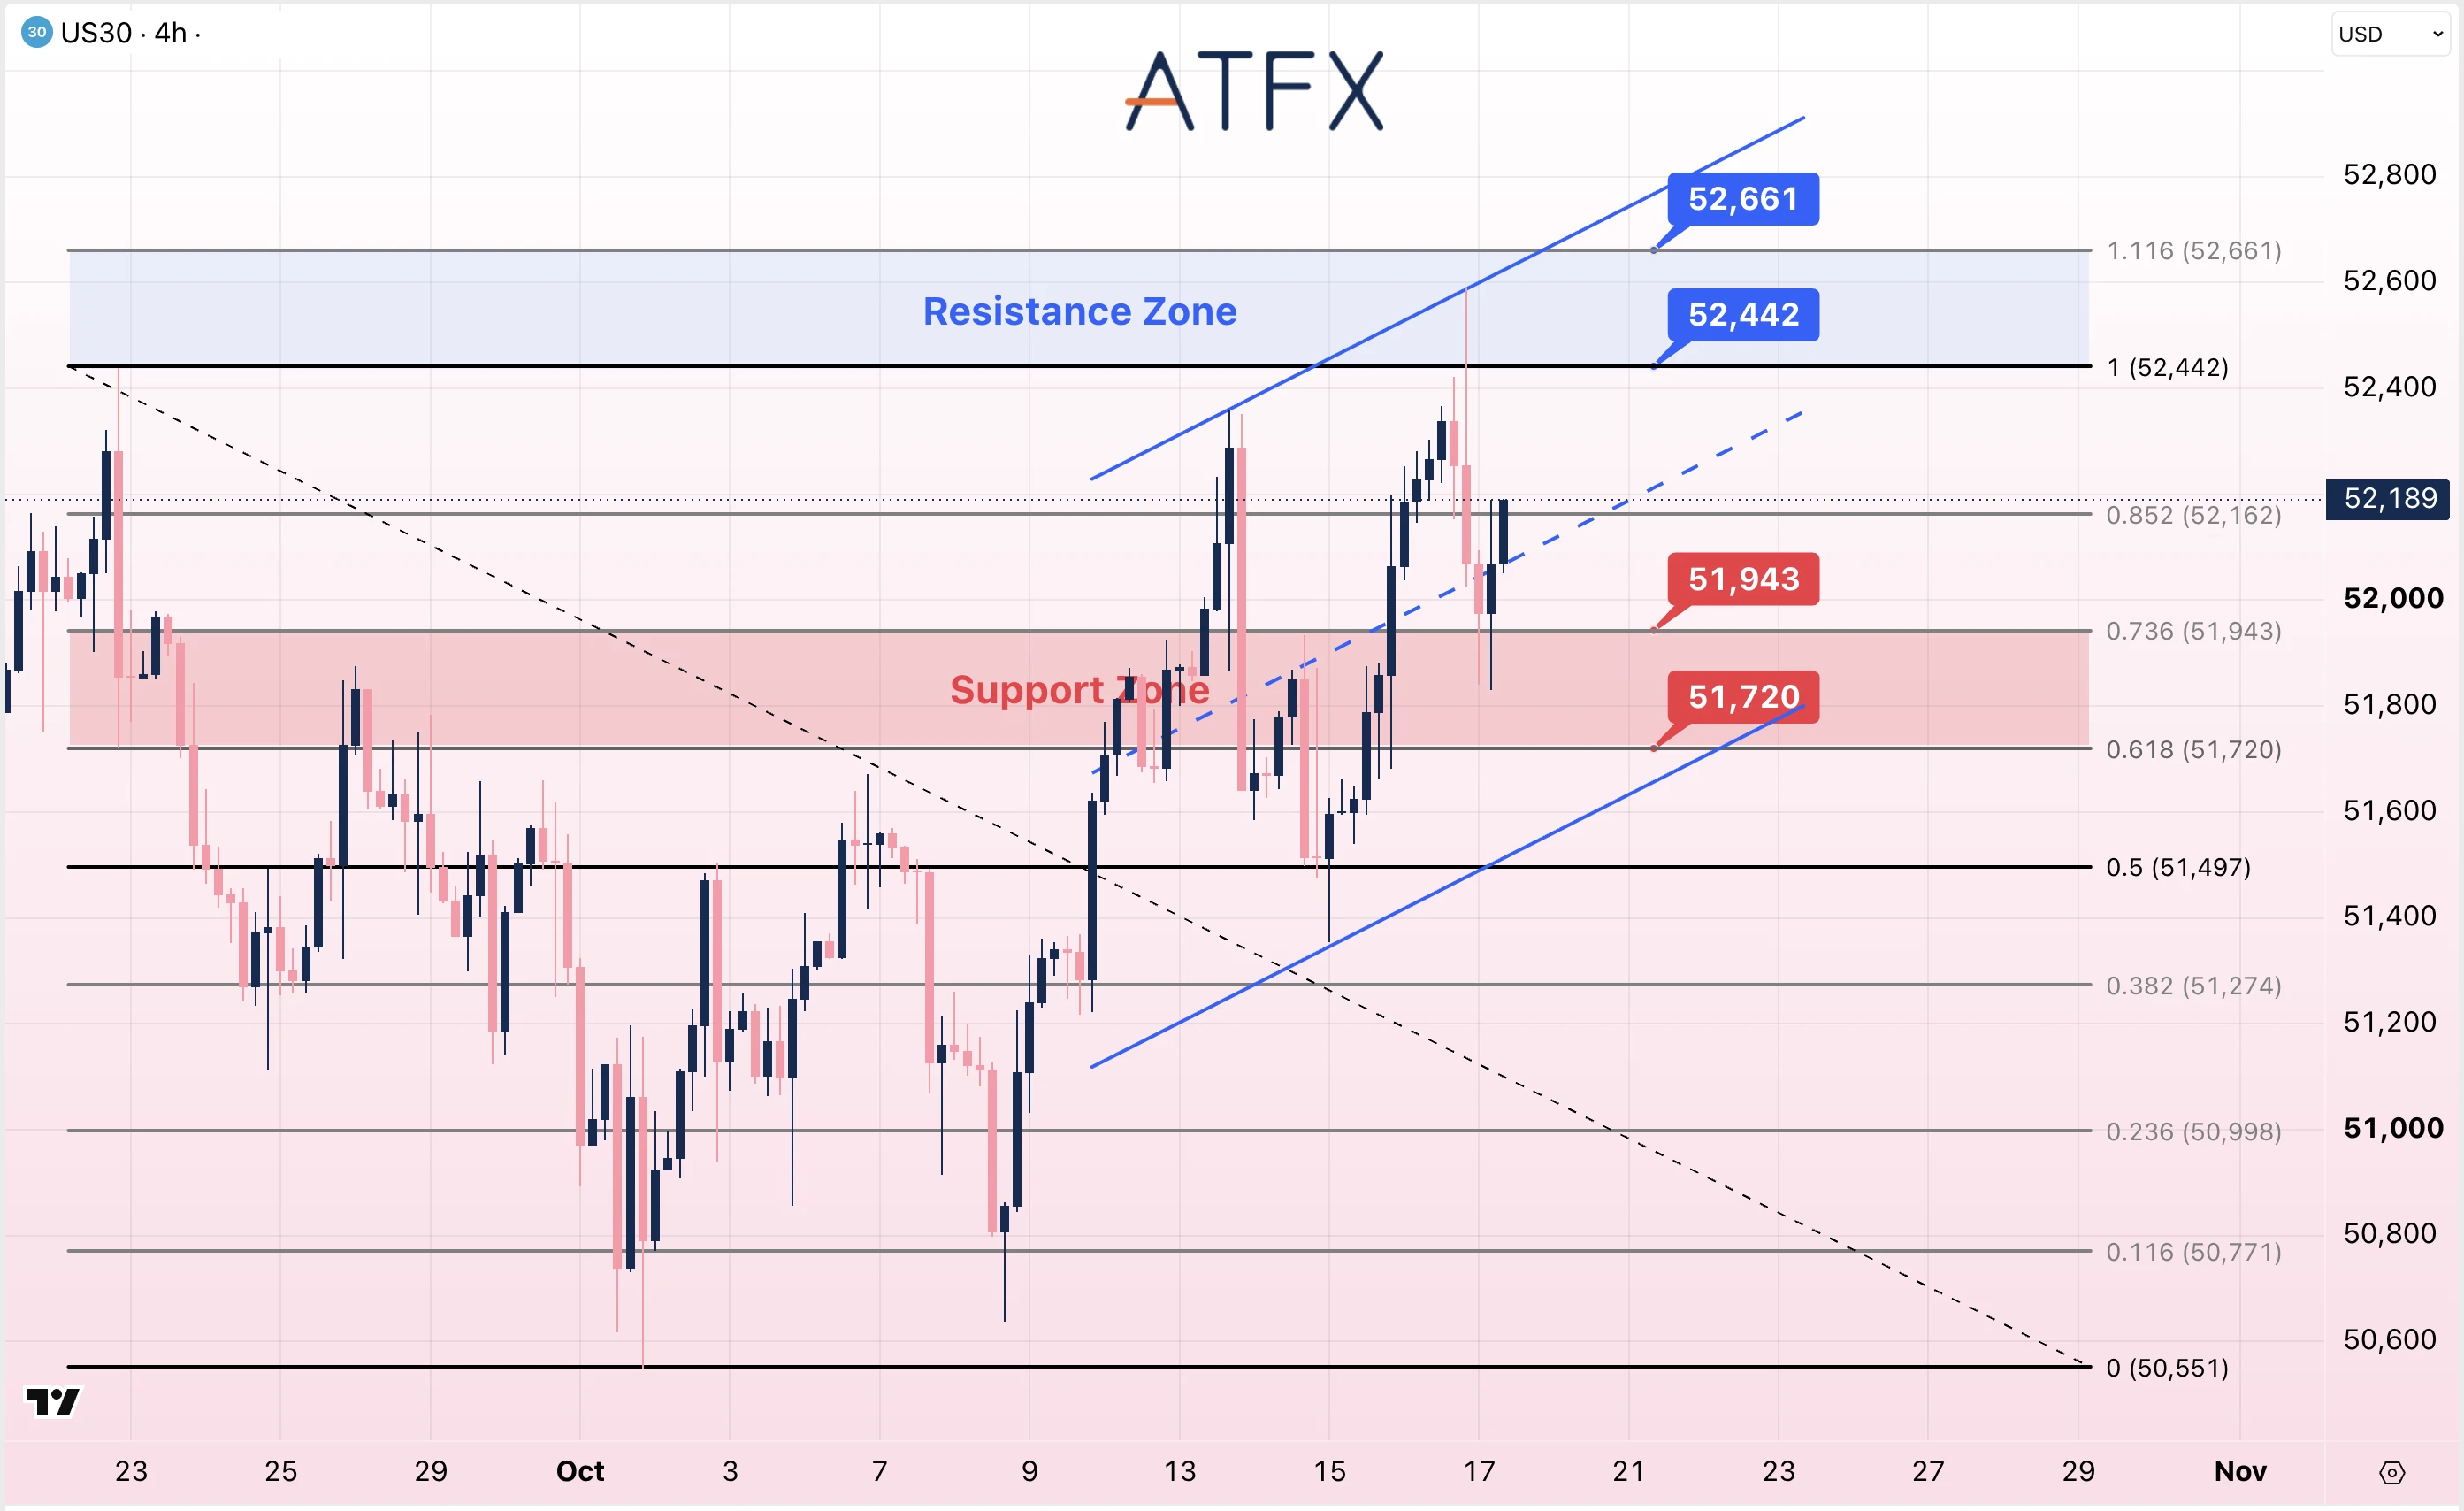
- Resistance: 52442/52661
- Support: 51943/51720
Technical Overview: US30 is near 52,189 after rebounding from around 51,830. Price is above the rising channel’s midline and close to the 52,162 Fibonacci level. A move above 52,442 would put 52,661 next among the marked resistance levels. Below 51,943, the next marked support is 51,720.
Bias: Neutral to Cautiously Bullish
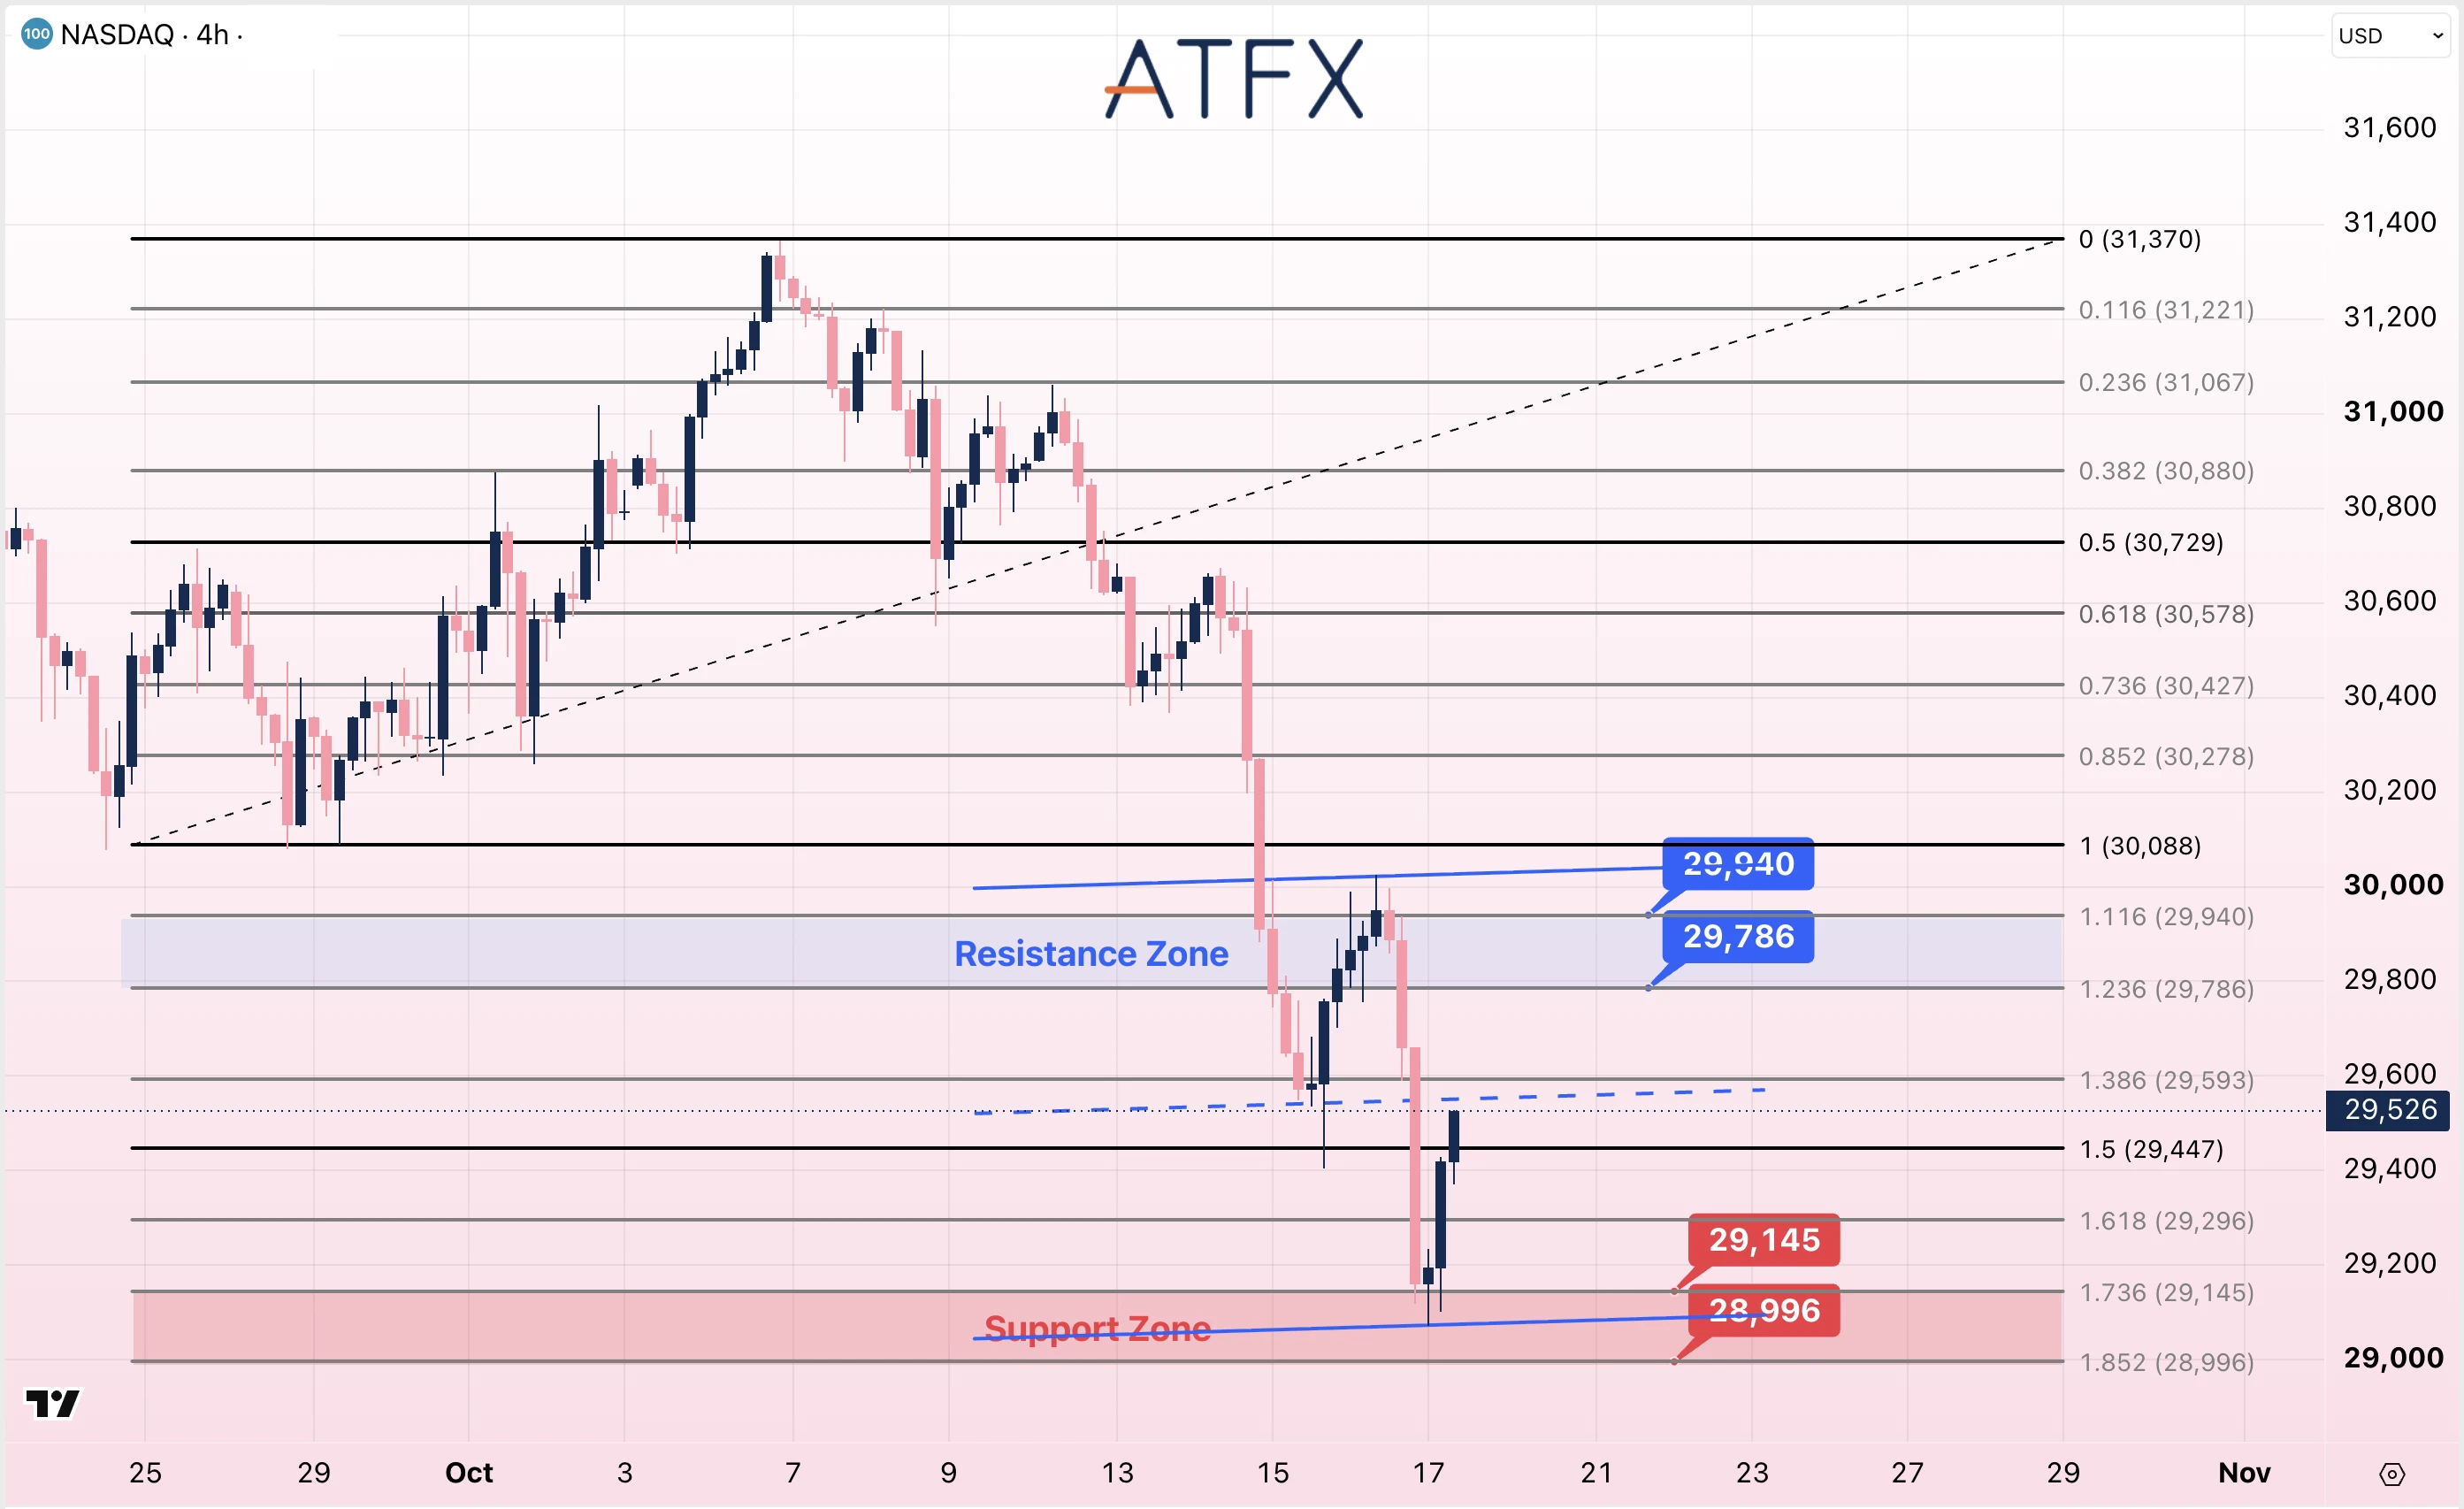
- Resistance: 29786/29940
- Support: 29145/28996
Technical Overview:NAS100 is near 29,526 after rebounding from around 29,100. Price remains below the 29,593 Fibonacci level and close to the channel’s midline. A recovery above 29,786 would bring 29,940 into focus. A move below 29,145 would leave 28,996 as the next marked support.
Bias: Cautiously Bearish
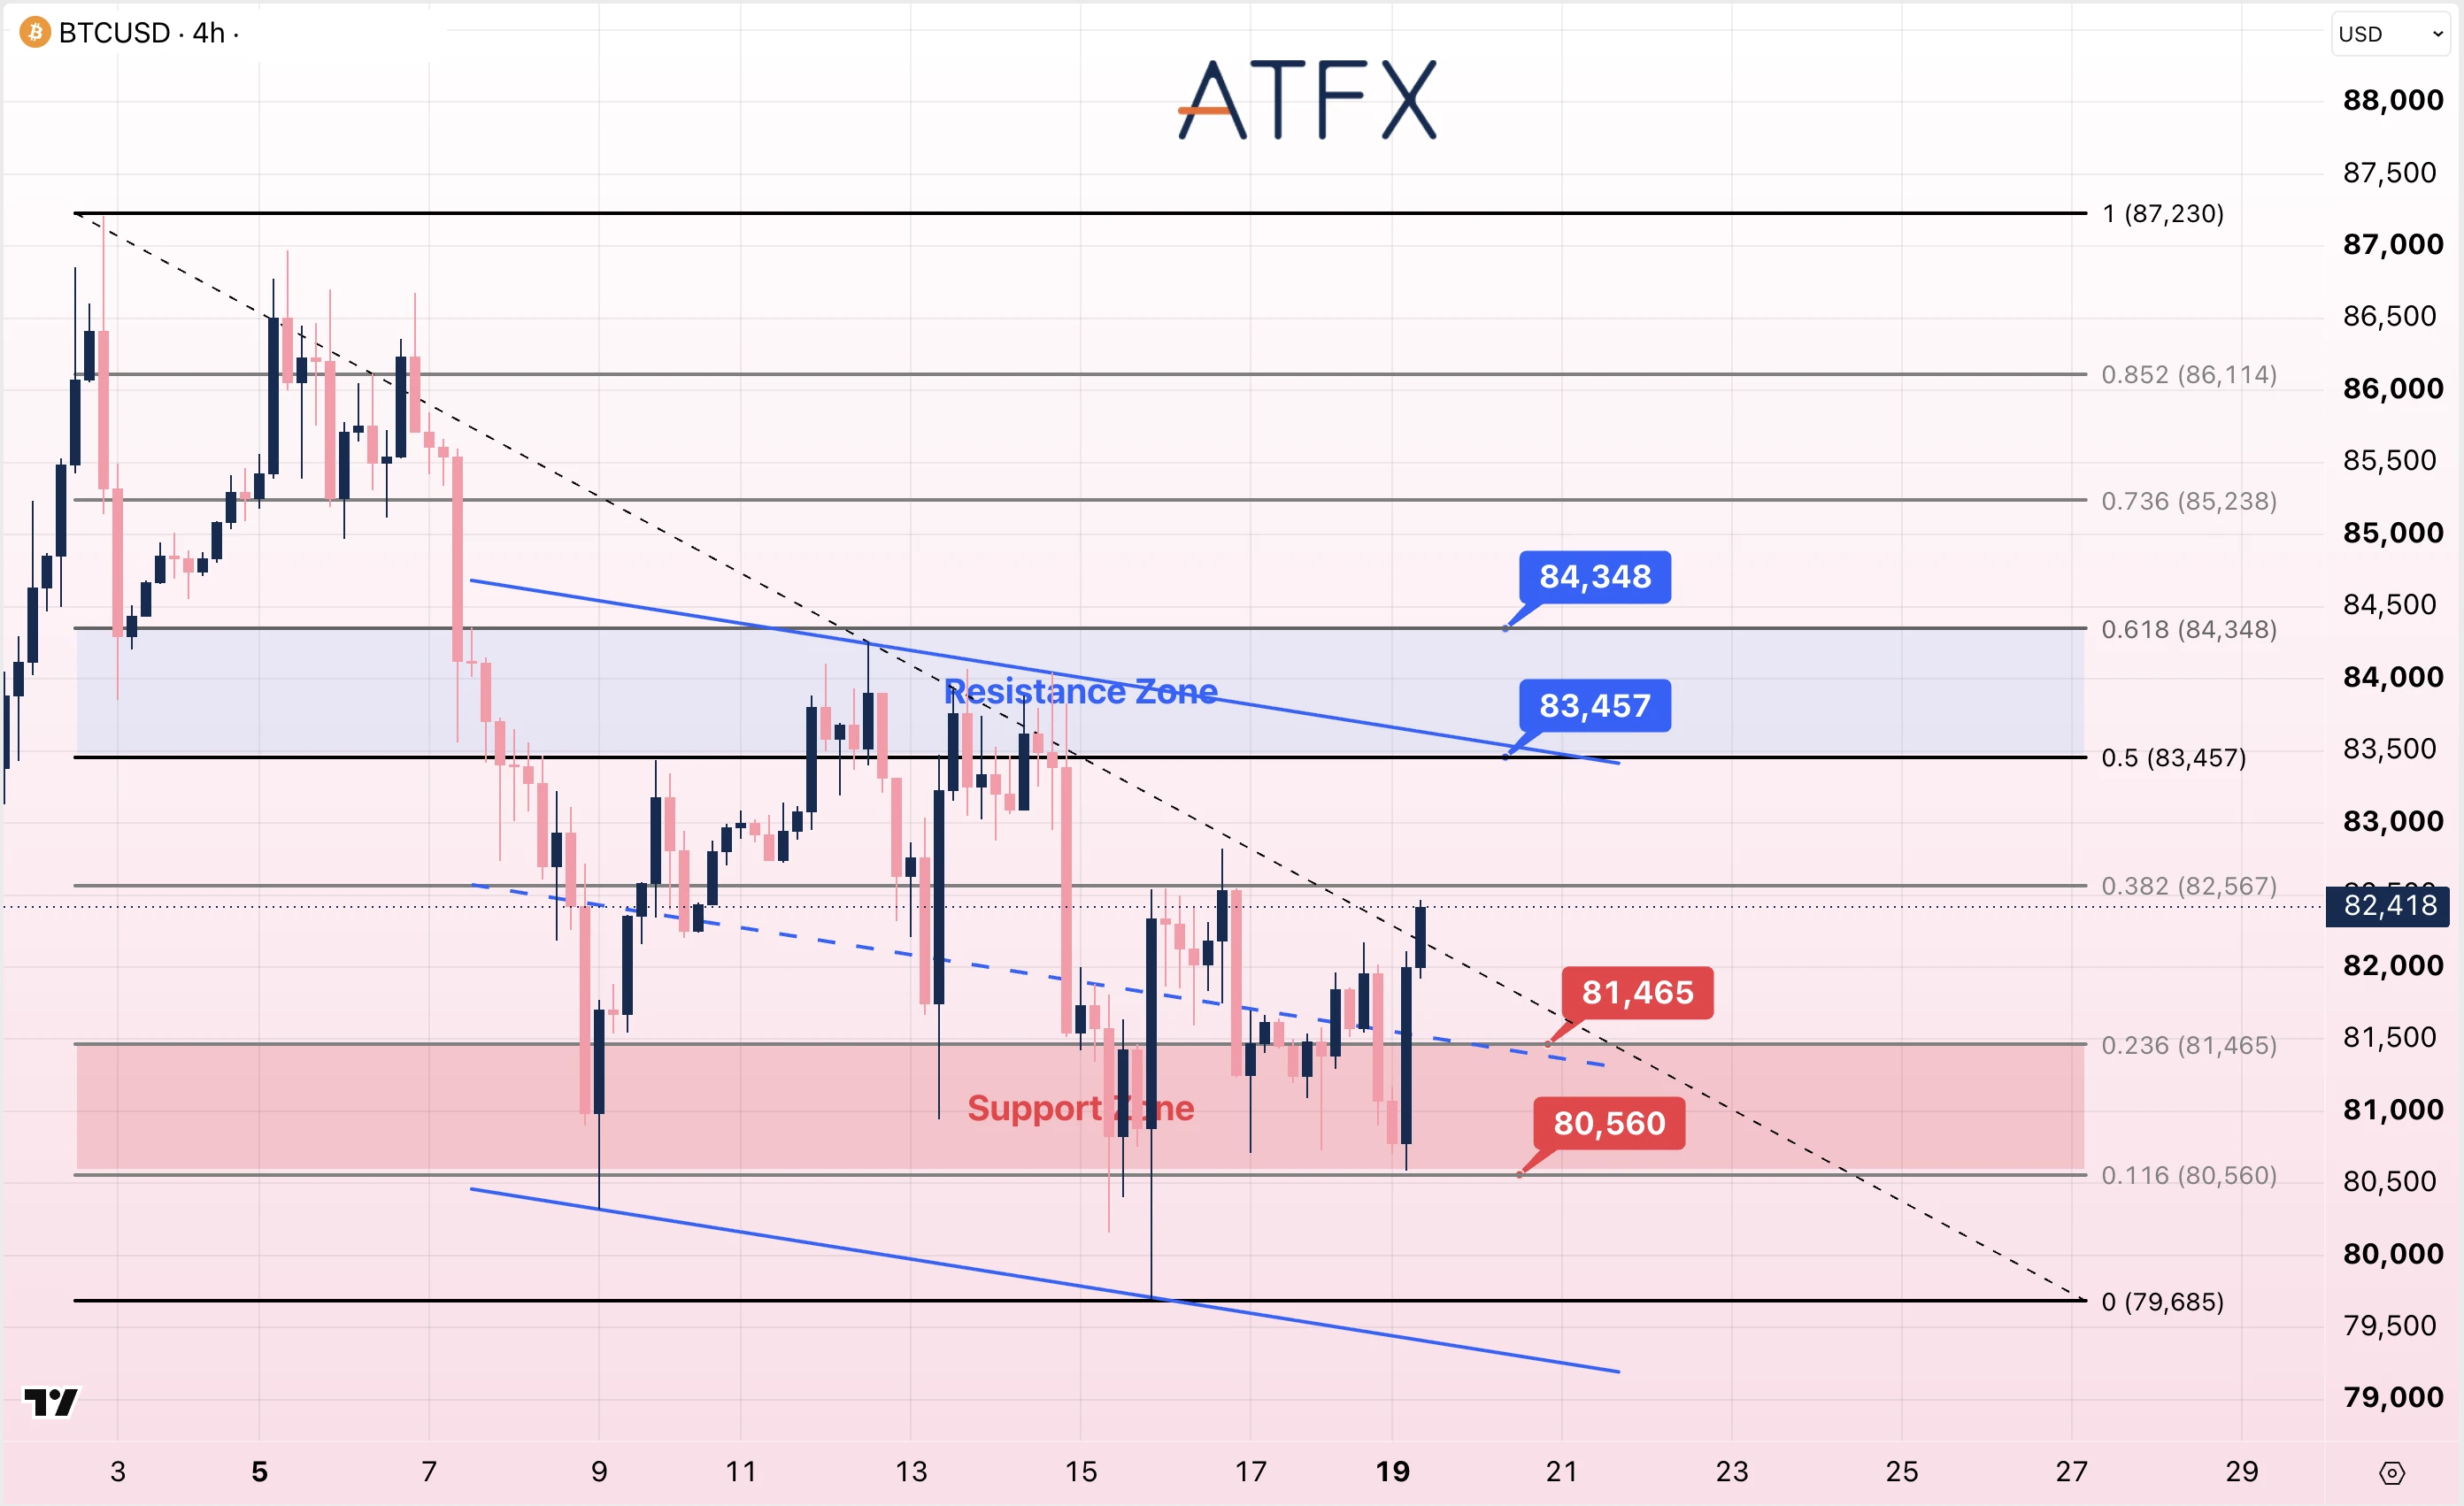
- Resistance: 83457/84348
- Support: 81465/80560
Technical Overview: On the supplied four-hour chart, Bitcoin is near $82,418 after rebounding from the $80,560 support area. Price has moved above the descending channel’s midline but remains below the $82,567 Fibonacci level. A recovery above this level would bring $83,457 and $84,348 into focus. Below $81,465, the next marked support is $80,560, followed by $79,685.
Bias: Neutral to Cautiously Bearish
Disclaimer: This analysis is for reference only and does not constitute investment advice.