

Key Takeaways
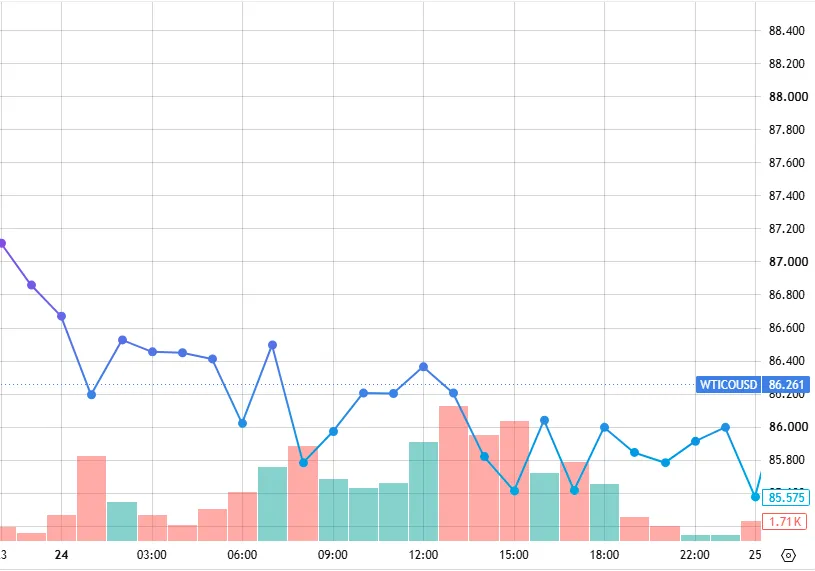
Today’s Focus: US PPI, retail sales and initial jobless claims are due at 20:30 (GMT+8). Forecasts point to faster monthly producer-price growth, slower retail-sales growth and a small increase in jobless claims. The releases will provide further information on prices, consumption and the labor market ahead of the October 27–28 Fed meeting. UK GDP and euro-area industrial production are also scheduled. Oil markets will monitor supply developments and the IEA’s discussion of a possible additional reserve release. |
Global Market Review 15/10/2026
- The Dow fell 0.09% to 51,621, the S&P 500 declined 1.11% to 7,718, and the Nasdaq fell 1.88% to 26,692.
- The Dollar Index rose 0.31% to 102.53.
- The 2-year Treasury yield increased 0.8 basis points to 4.797%, while the 10-year yield fell 2.3 basis points to 5.185%.
- Brent rose 0.35% to $106.06, WTI fell 0.01% to $95.08, and gold fell 1.24% to $4,105.12.
Economic Calendar
Key Events on October 15 (GMT+8)
| Time (GMT+8) | Event | Importance |
|---|---|---|
| 08:30 | AU Employment Change SEP | ** |
| 14:00 | UK GDP MoM AUG | ** |
| 17:00 | EU Industrial Production MoM AUG | ** |
| 20:30 | US PPI MoM SEP | *** |
| 20:30 | US Retail Sales MoM SEP | *** |
| 20:30 | US Initial Jobless Claims | *** |
Key Events on October 16 (GMT+8)
| Time (GMT+8) | Event | Importance |
|---|---|---|
| 00:00 | US EIA Crude Oil Stocks Change | ** |
| 10:00 | BoE Governor Bailey Speech | *** |
| 11:30 | Fed Chair Warsh Speech | *** |
| 17:00 | EU Final Inflation Rate YoY SEP | ** |
| 21:15 | US Industrial & Manufacturing Production MoM SEP | ** |
Markets Analysis 15/10/2026
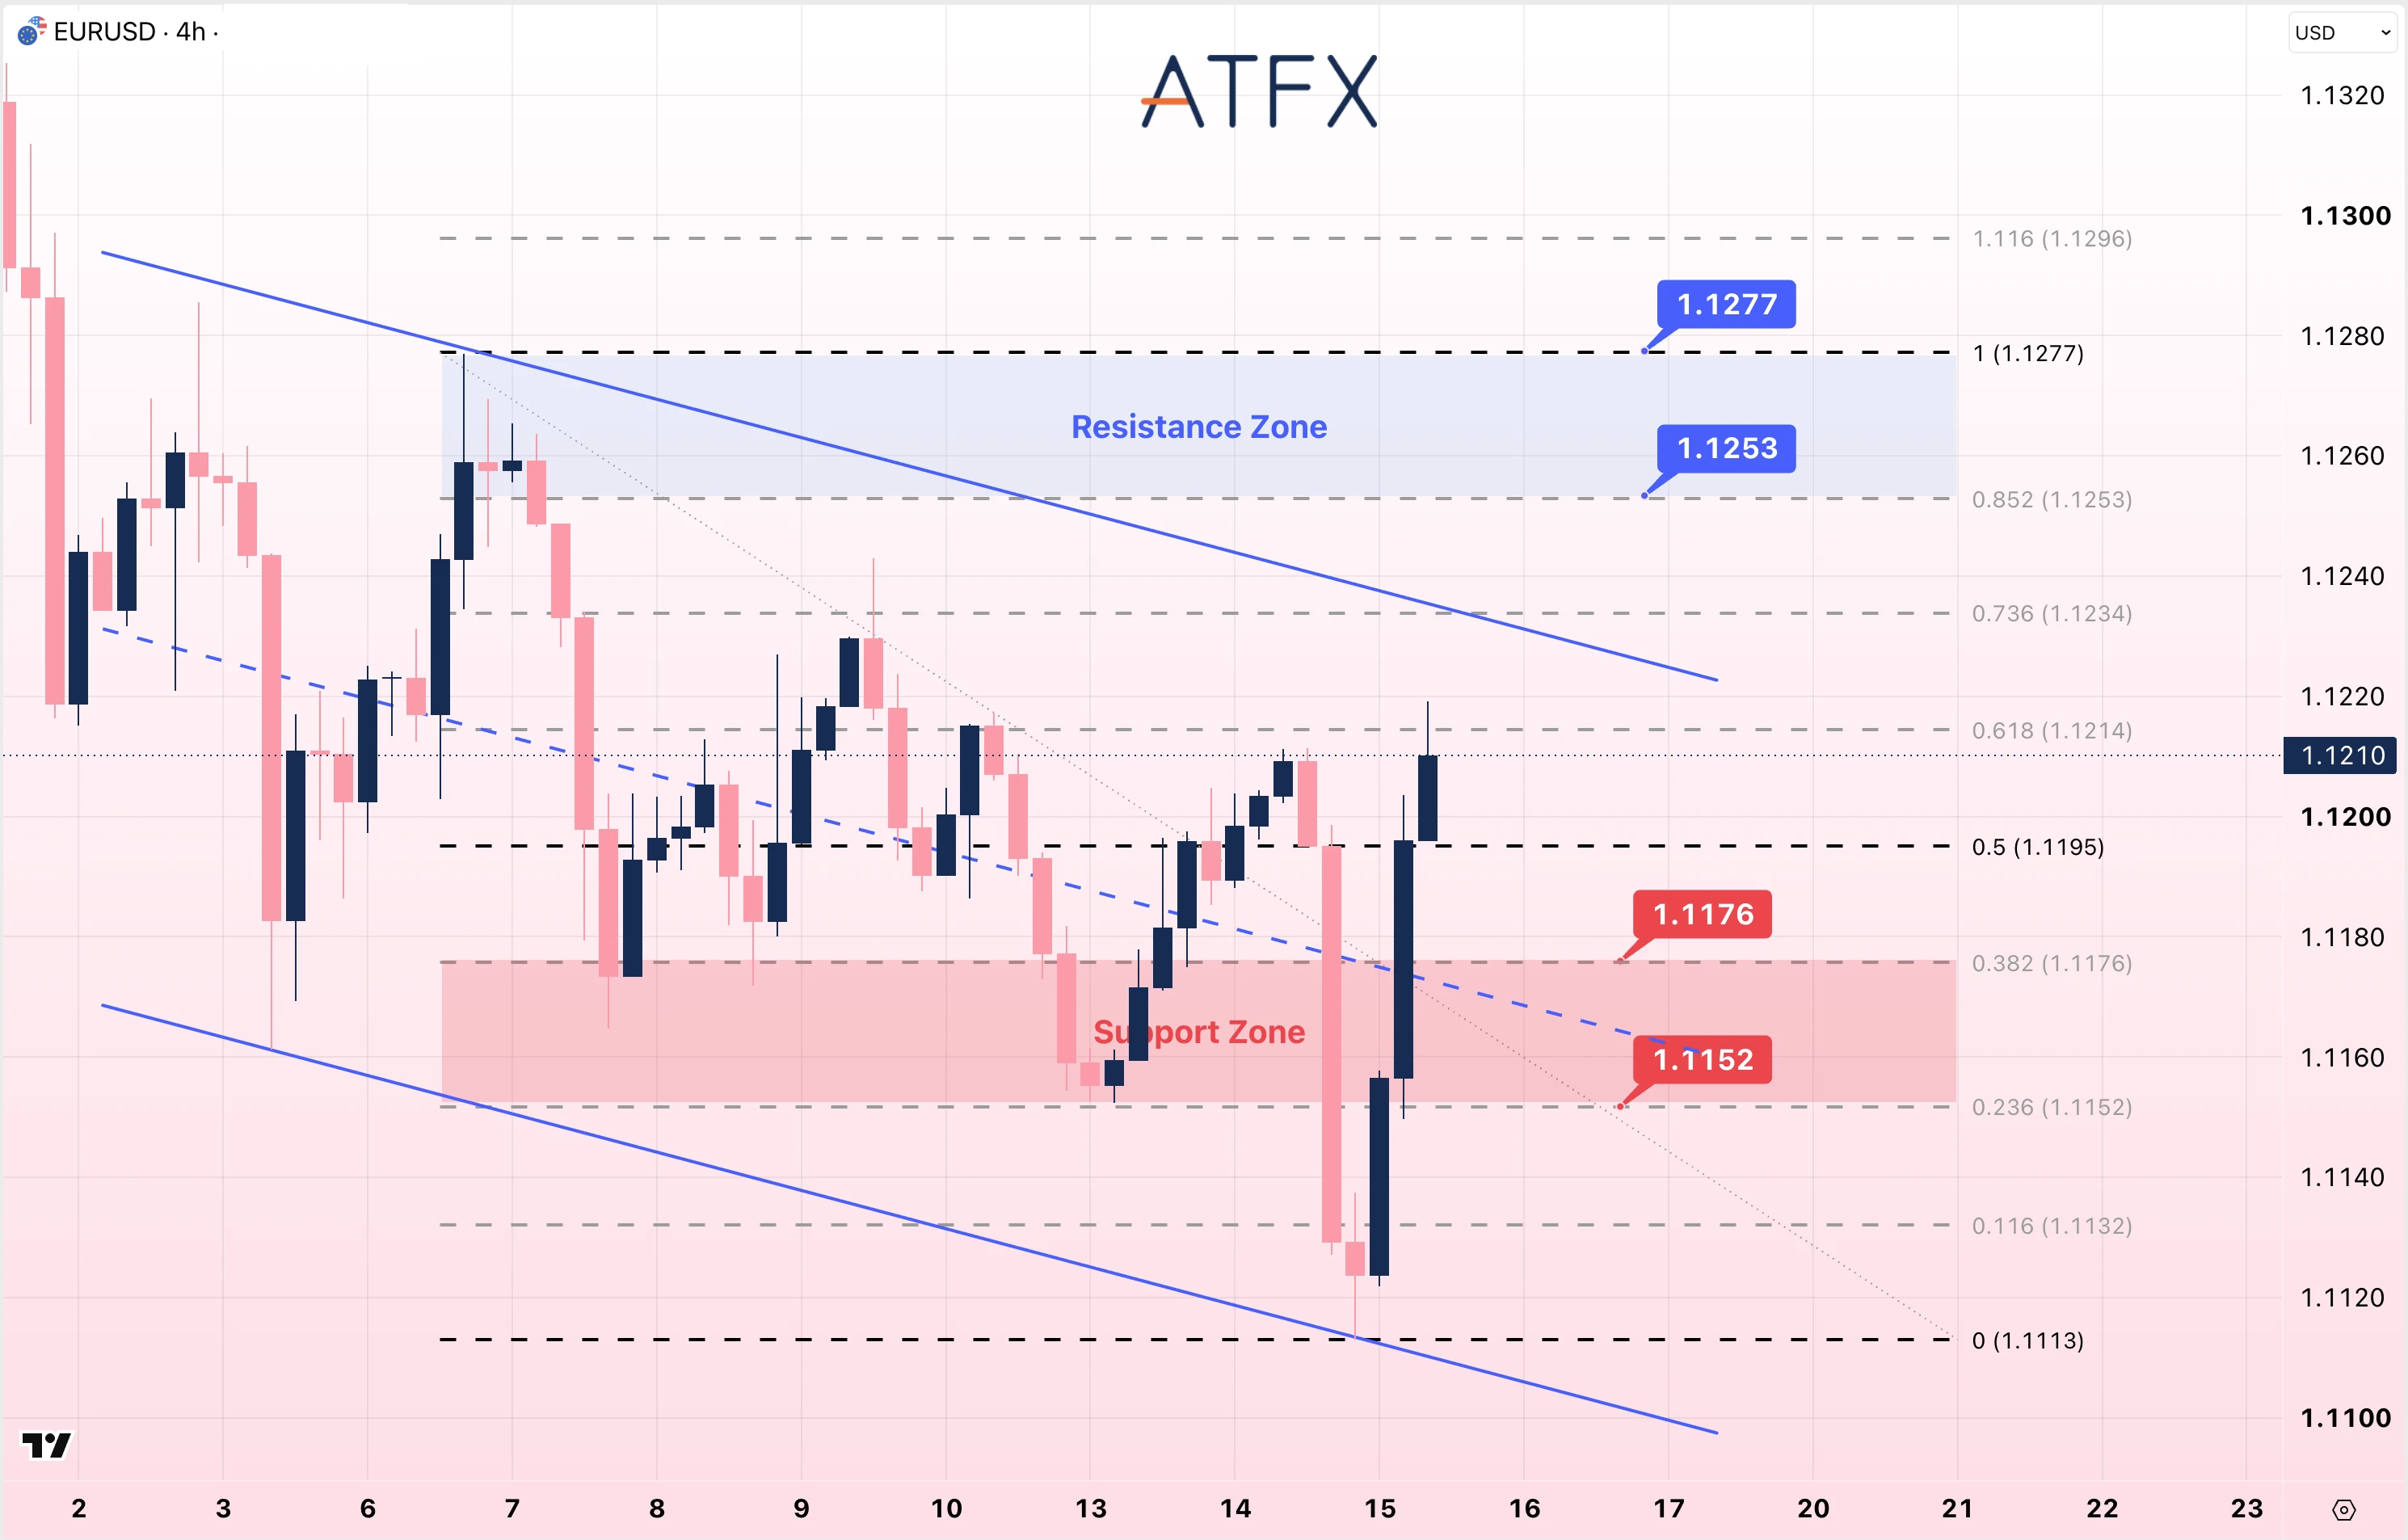
- Resistance: 1.1253/1.1277
- Support: 1.1176/1.1152
Technical Overview: EUR/USD is near 1.1210 after recovering from approximately 1.1123. Price has moved above the descending channel’s midline and the 1.1195 Fibonacci level, with 1.1214 nearby. A move above 1.1253 would put 1.1277 next among the marked resistance levels. Below 1.1176, the next marked support is 1.1152.
Bias: Neutral to Cautiously Bullish
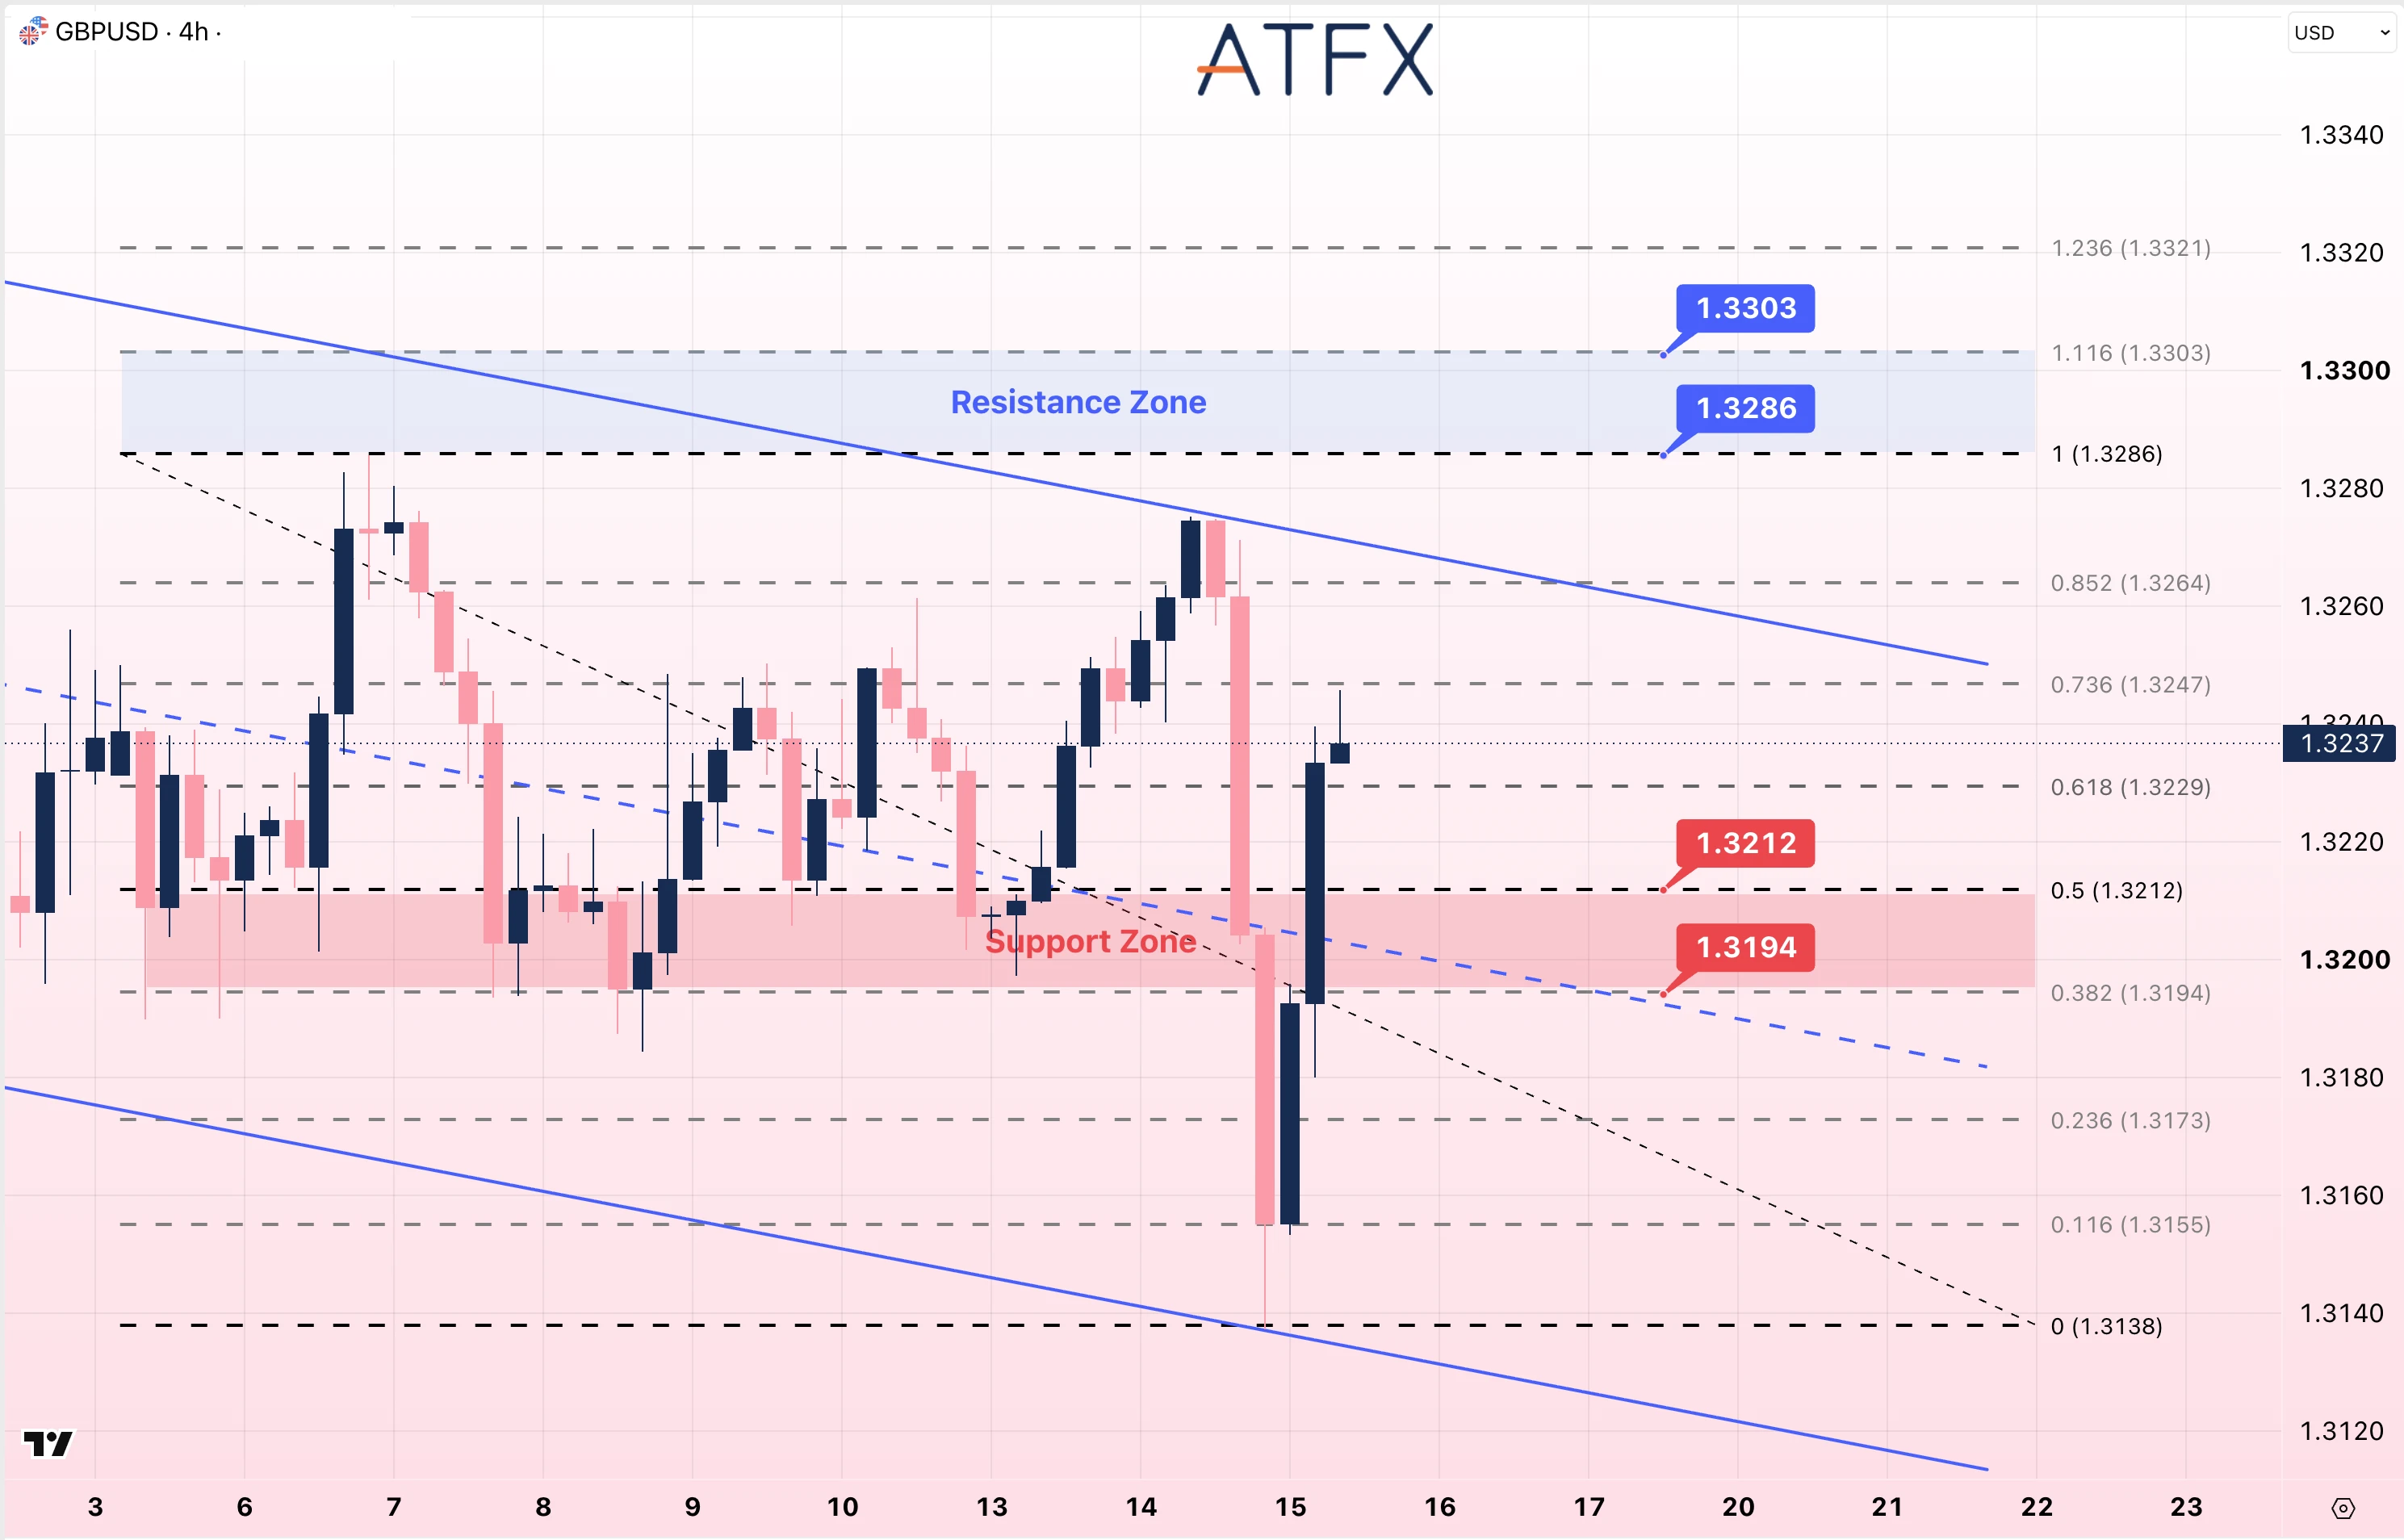
- Resistance: 1.3286/1.3303
- Support: 1.3212/1.3194
Technical Overview: GBP/USD is near 1.3237 after rebounding from around 1.3140. It is above the descending channel’s midline, with 1.3247 an intermediate Fibonacci level before the upper boundary. The marked resistance zone is 1.3286–1.3303. A move below 1.3212 would bring 1.3194 into focus. UK GDP is scheduled for 14:00 (GMT+8).
Bias: Neutral to Mildly Bullish
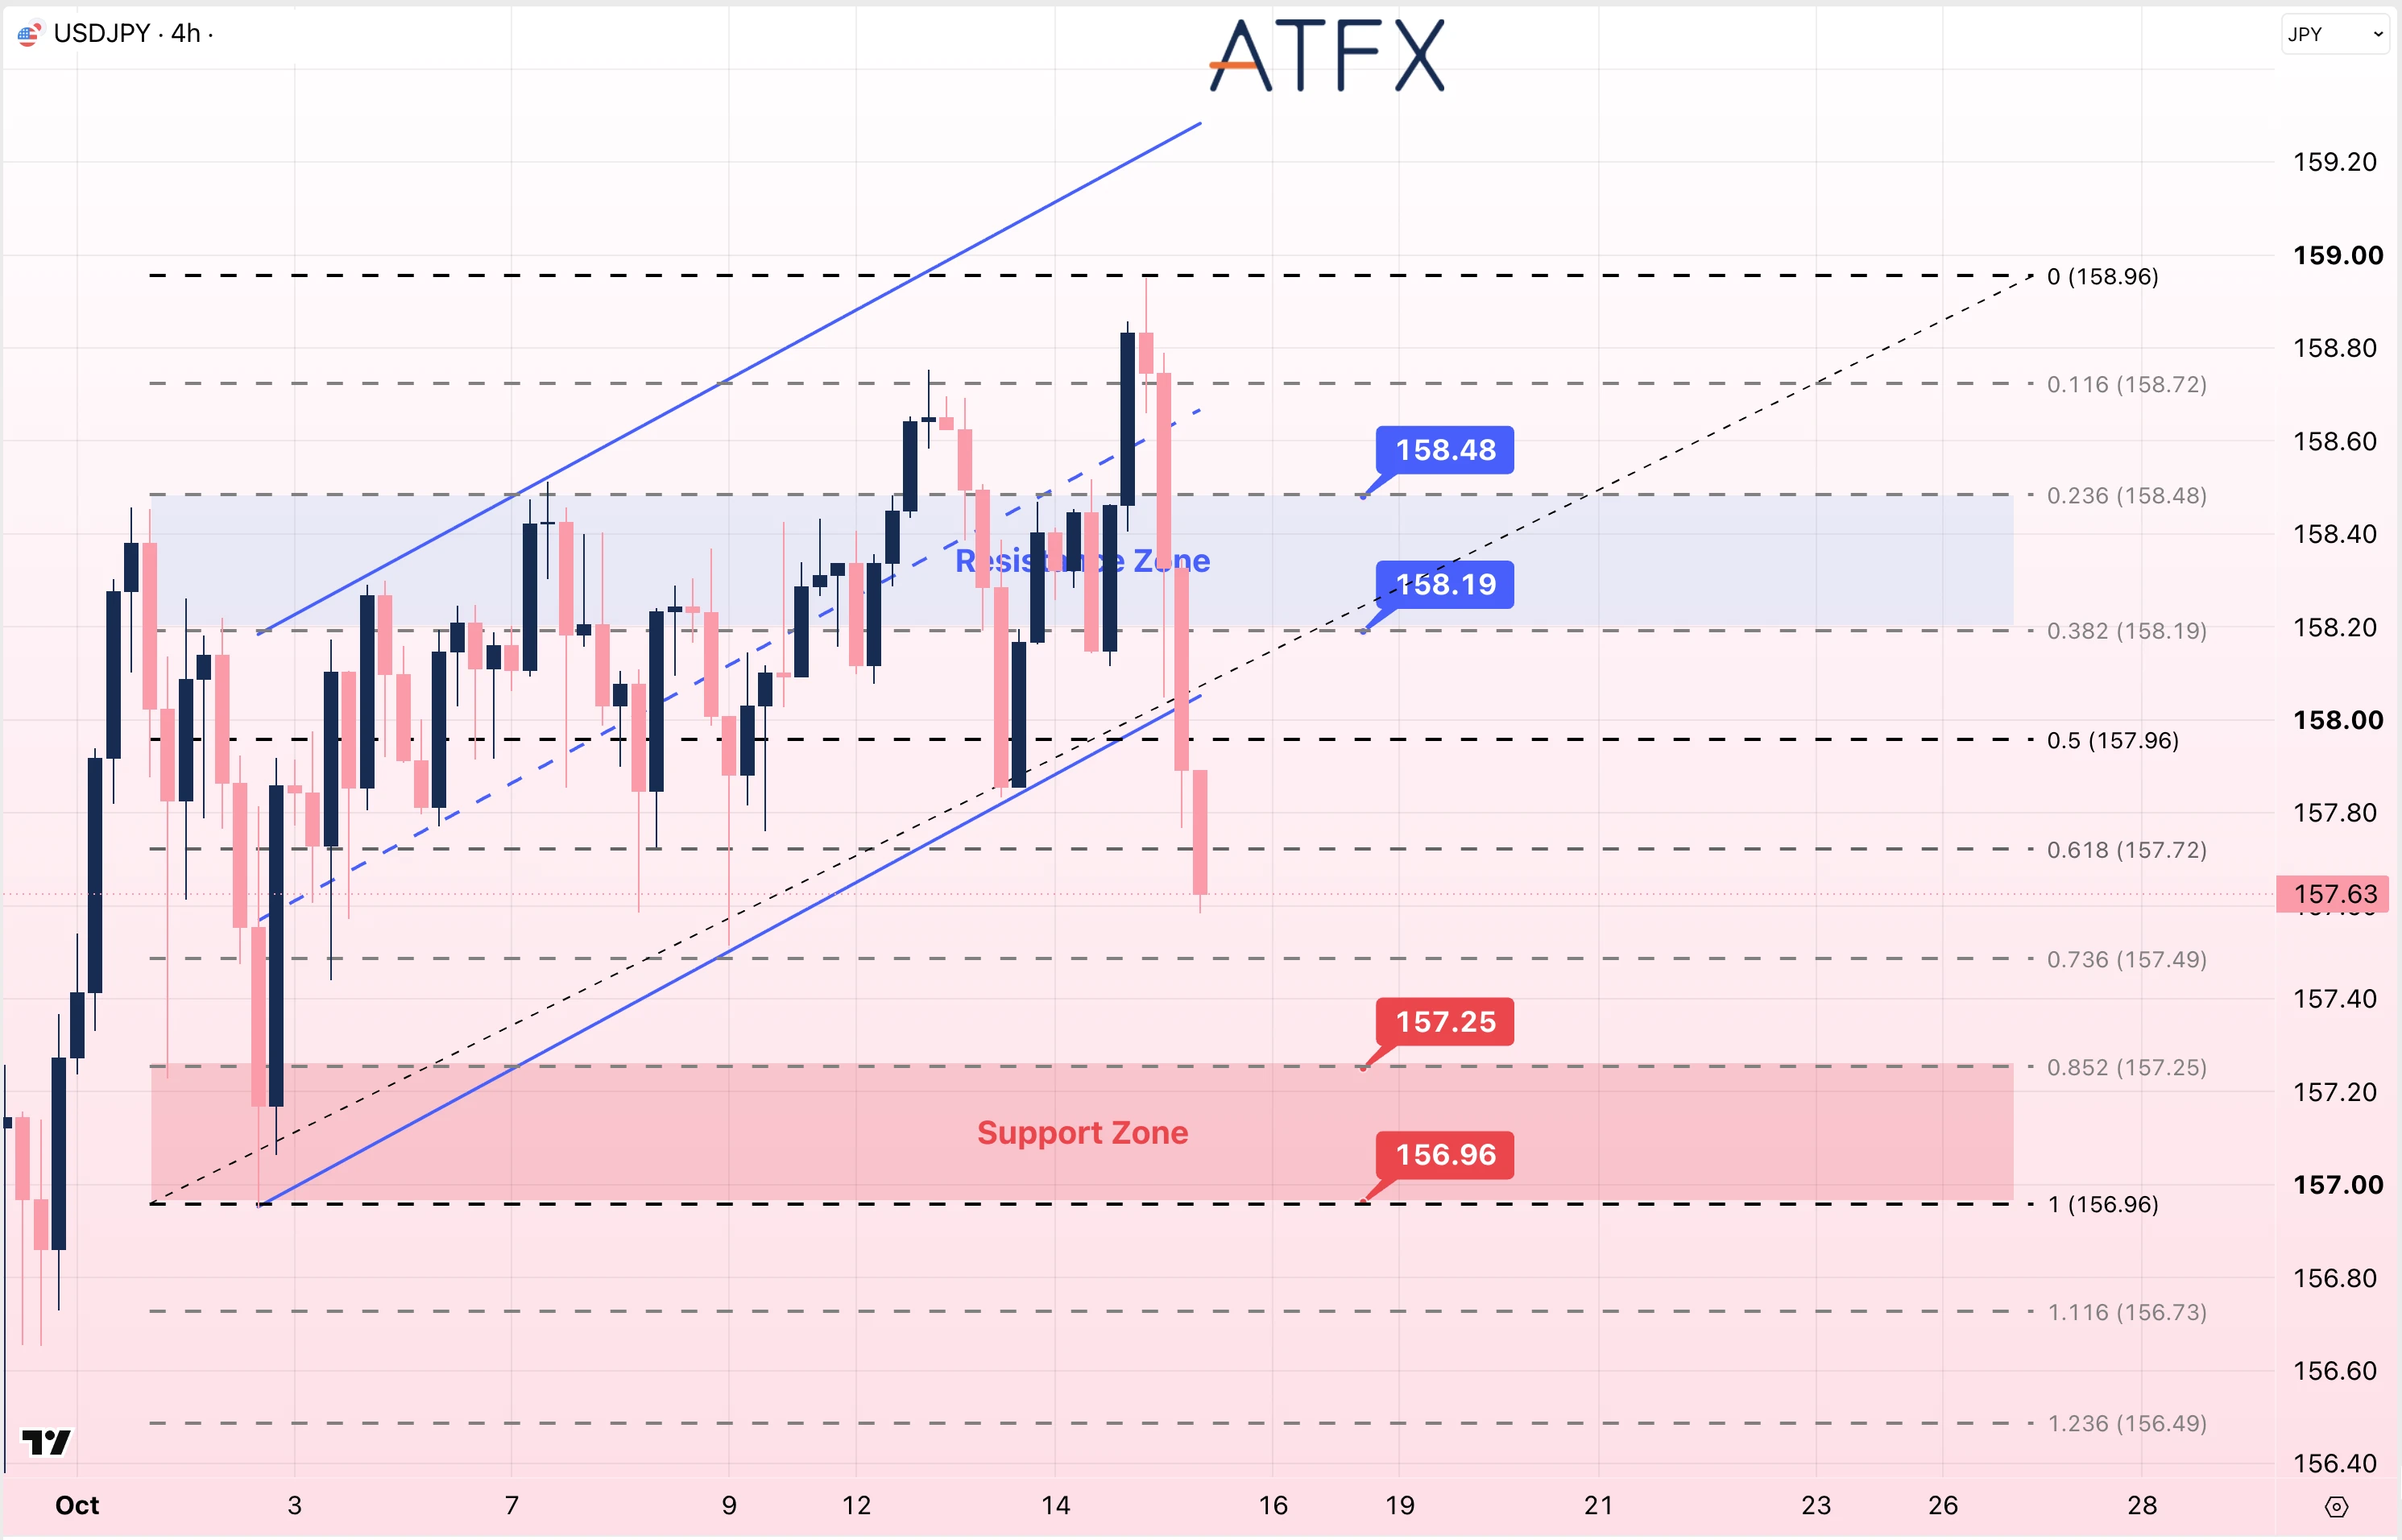
- Resistance: 158.19/158.48
- Support: 157.25/156.96
Technical Overview: USD/JPY is near 157.63 after reversing from approximately 158.96. Price has moved below the previous rising channel and the 157.96 Fibonacci level. The marked resistance levels are 158.19 and 158.48. A move below 157.25 would put 156.96 next among the marked supports.
Bias: Cautiously Bearish
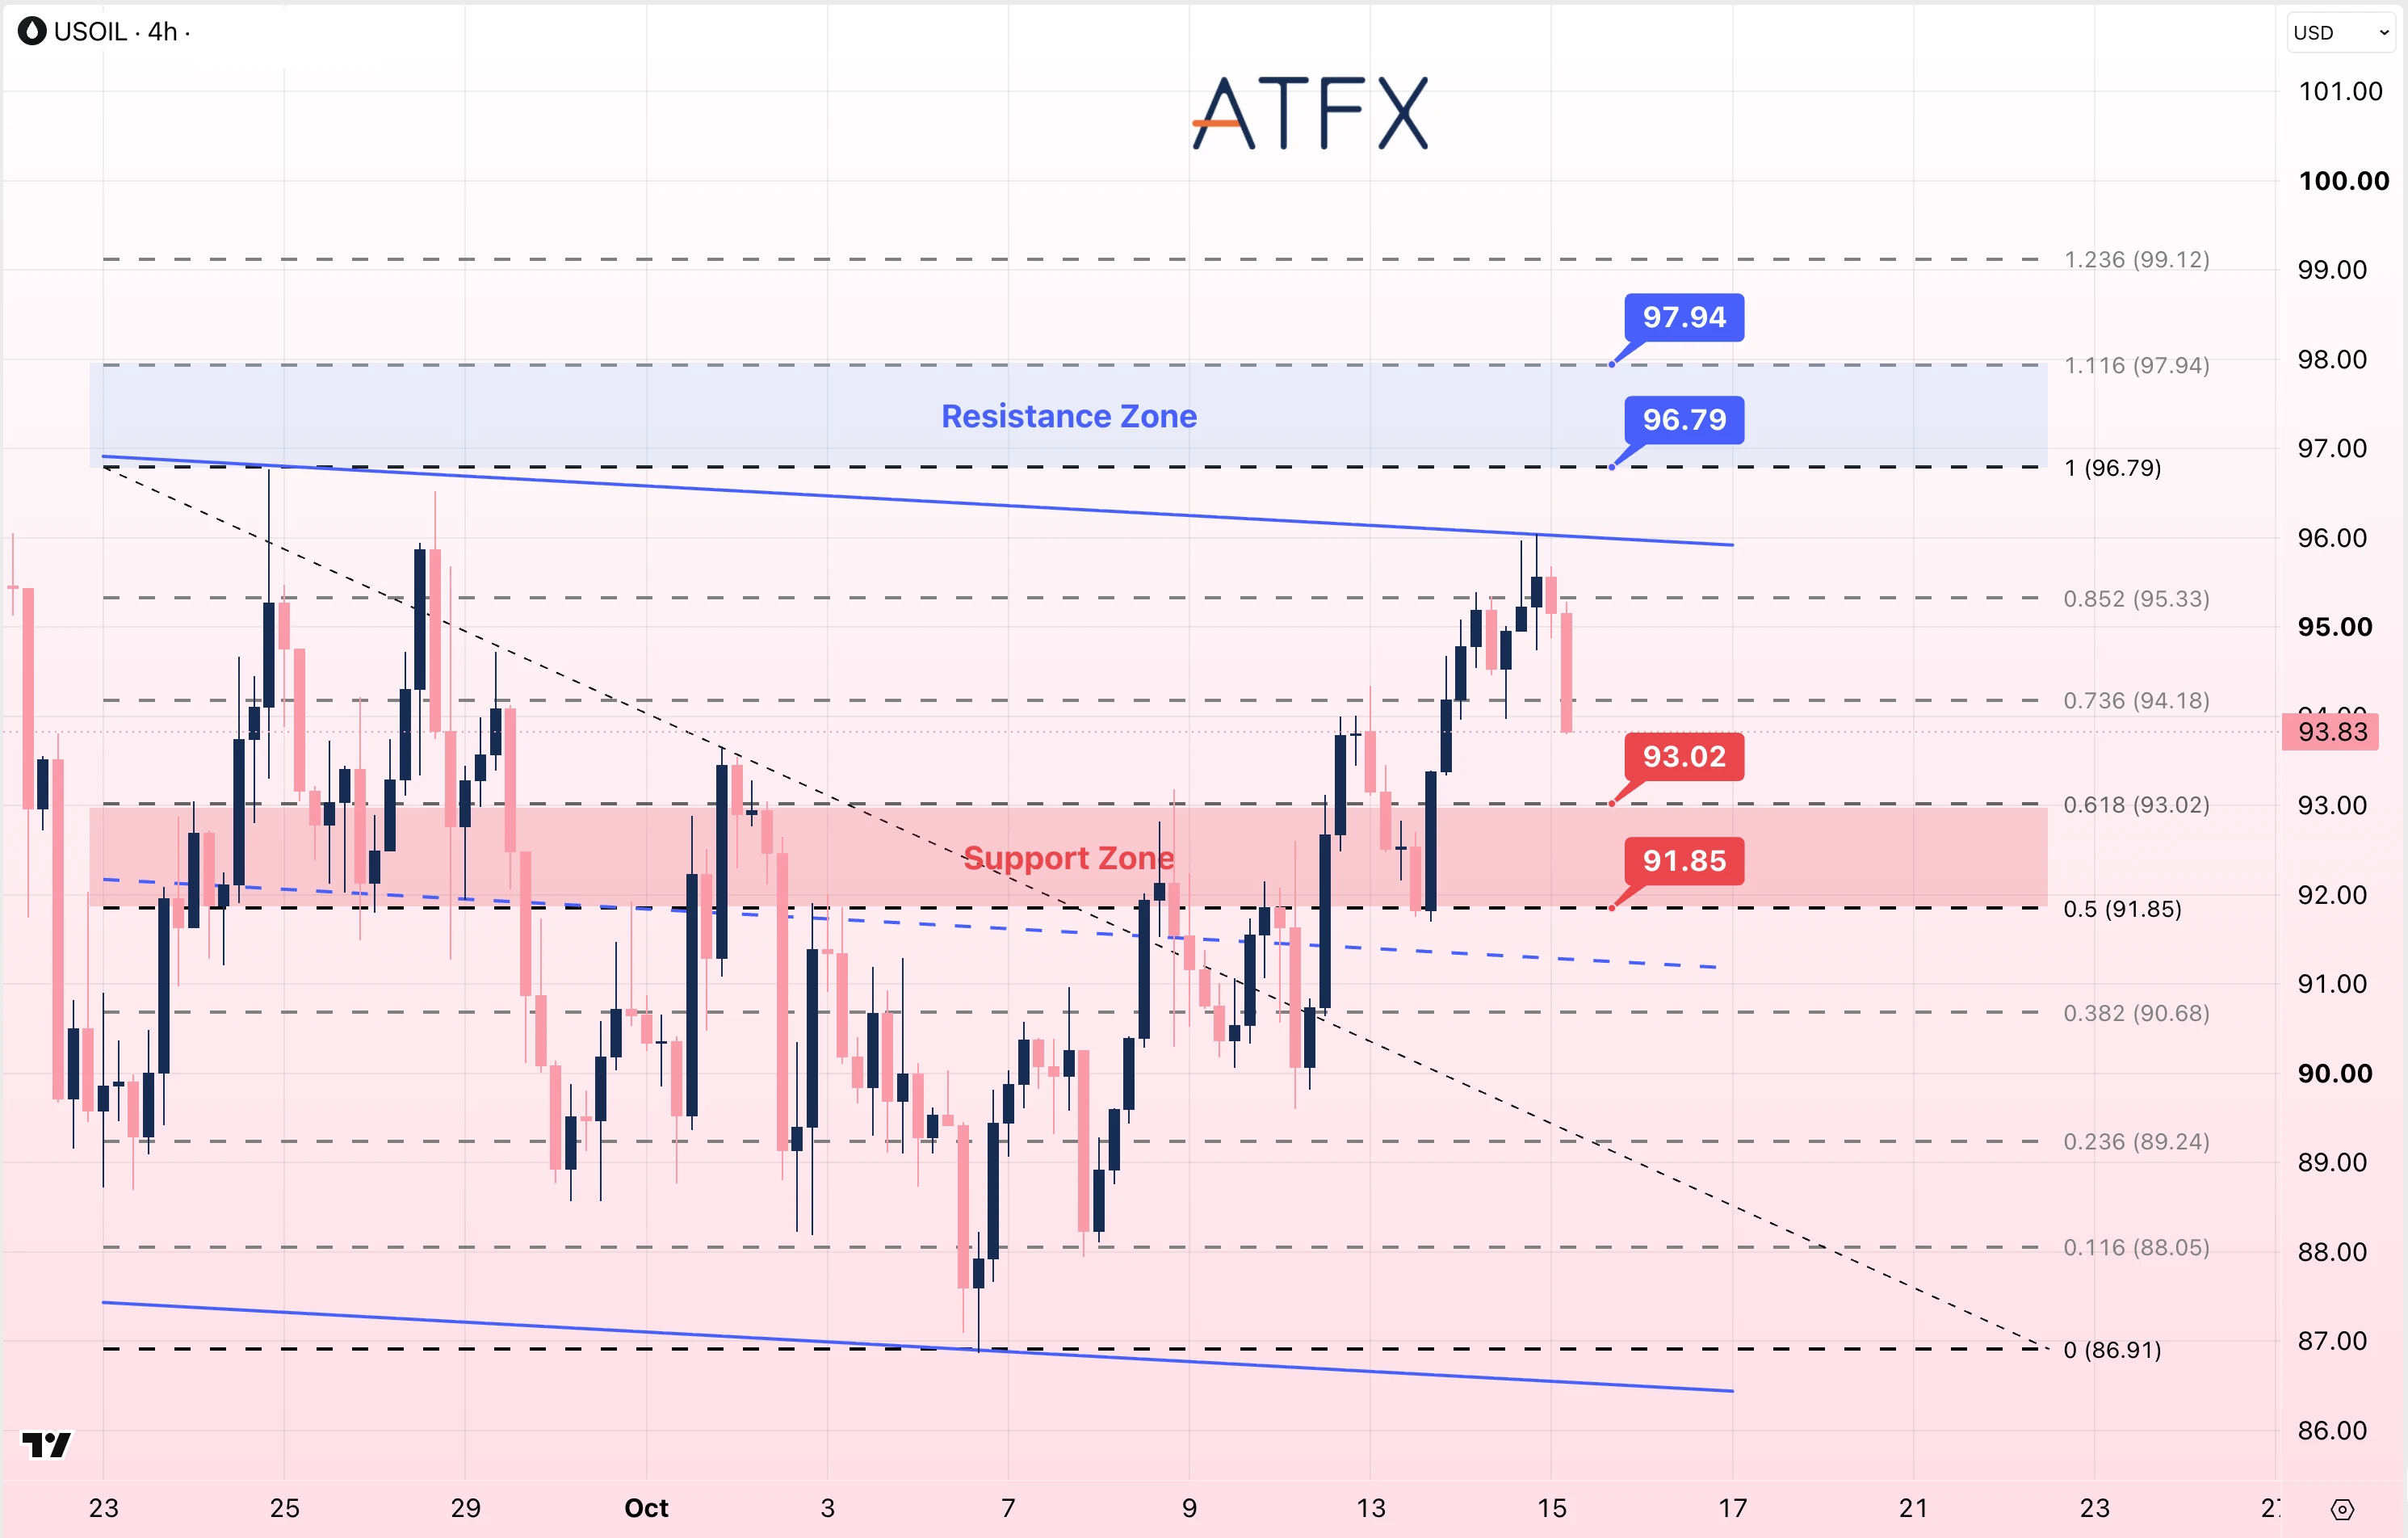
- Resistance: 96.79/97.94
- Support: 93.02/91.85
Technical Overview: USOIL is near $93.83 after declining from the descending channel’s upper boundary around $96. Price is below $94.18, while $93.02 is the first marked support, followed by $91.85. A move above $96.79 would place price above the current upper boundary, with $97.94 the next marked resistance. API reported a crude-inventory draw, while the IEA is discussing a possible additional reserve release.
Bias: Cautiously Bearish
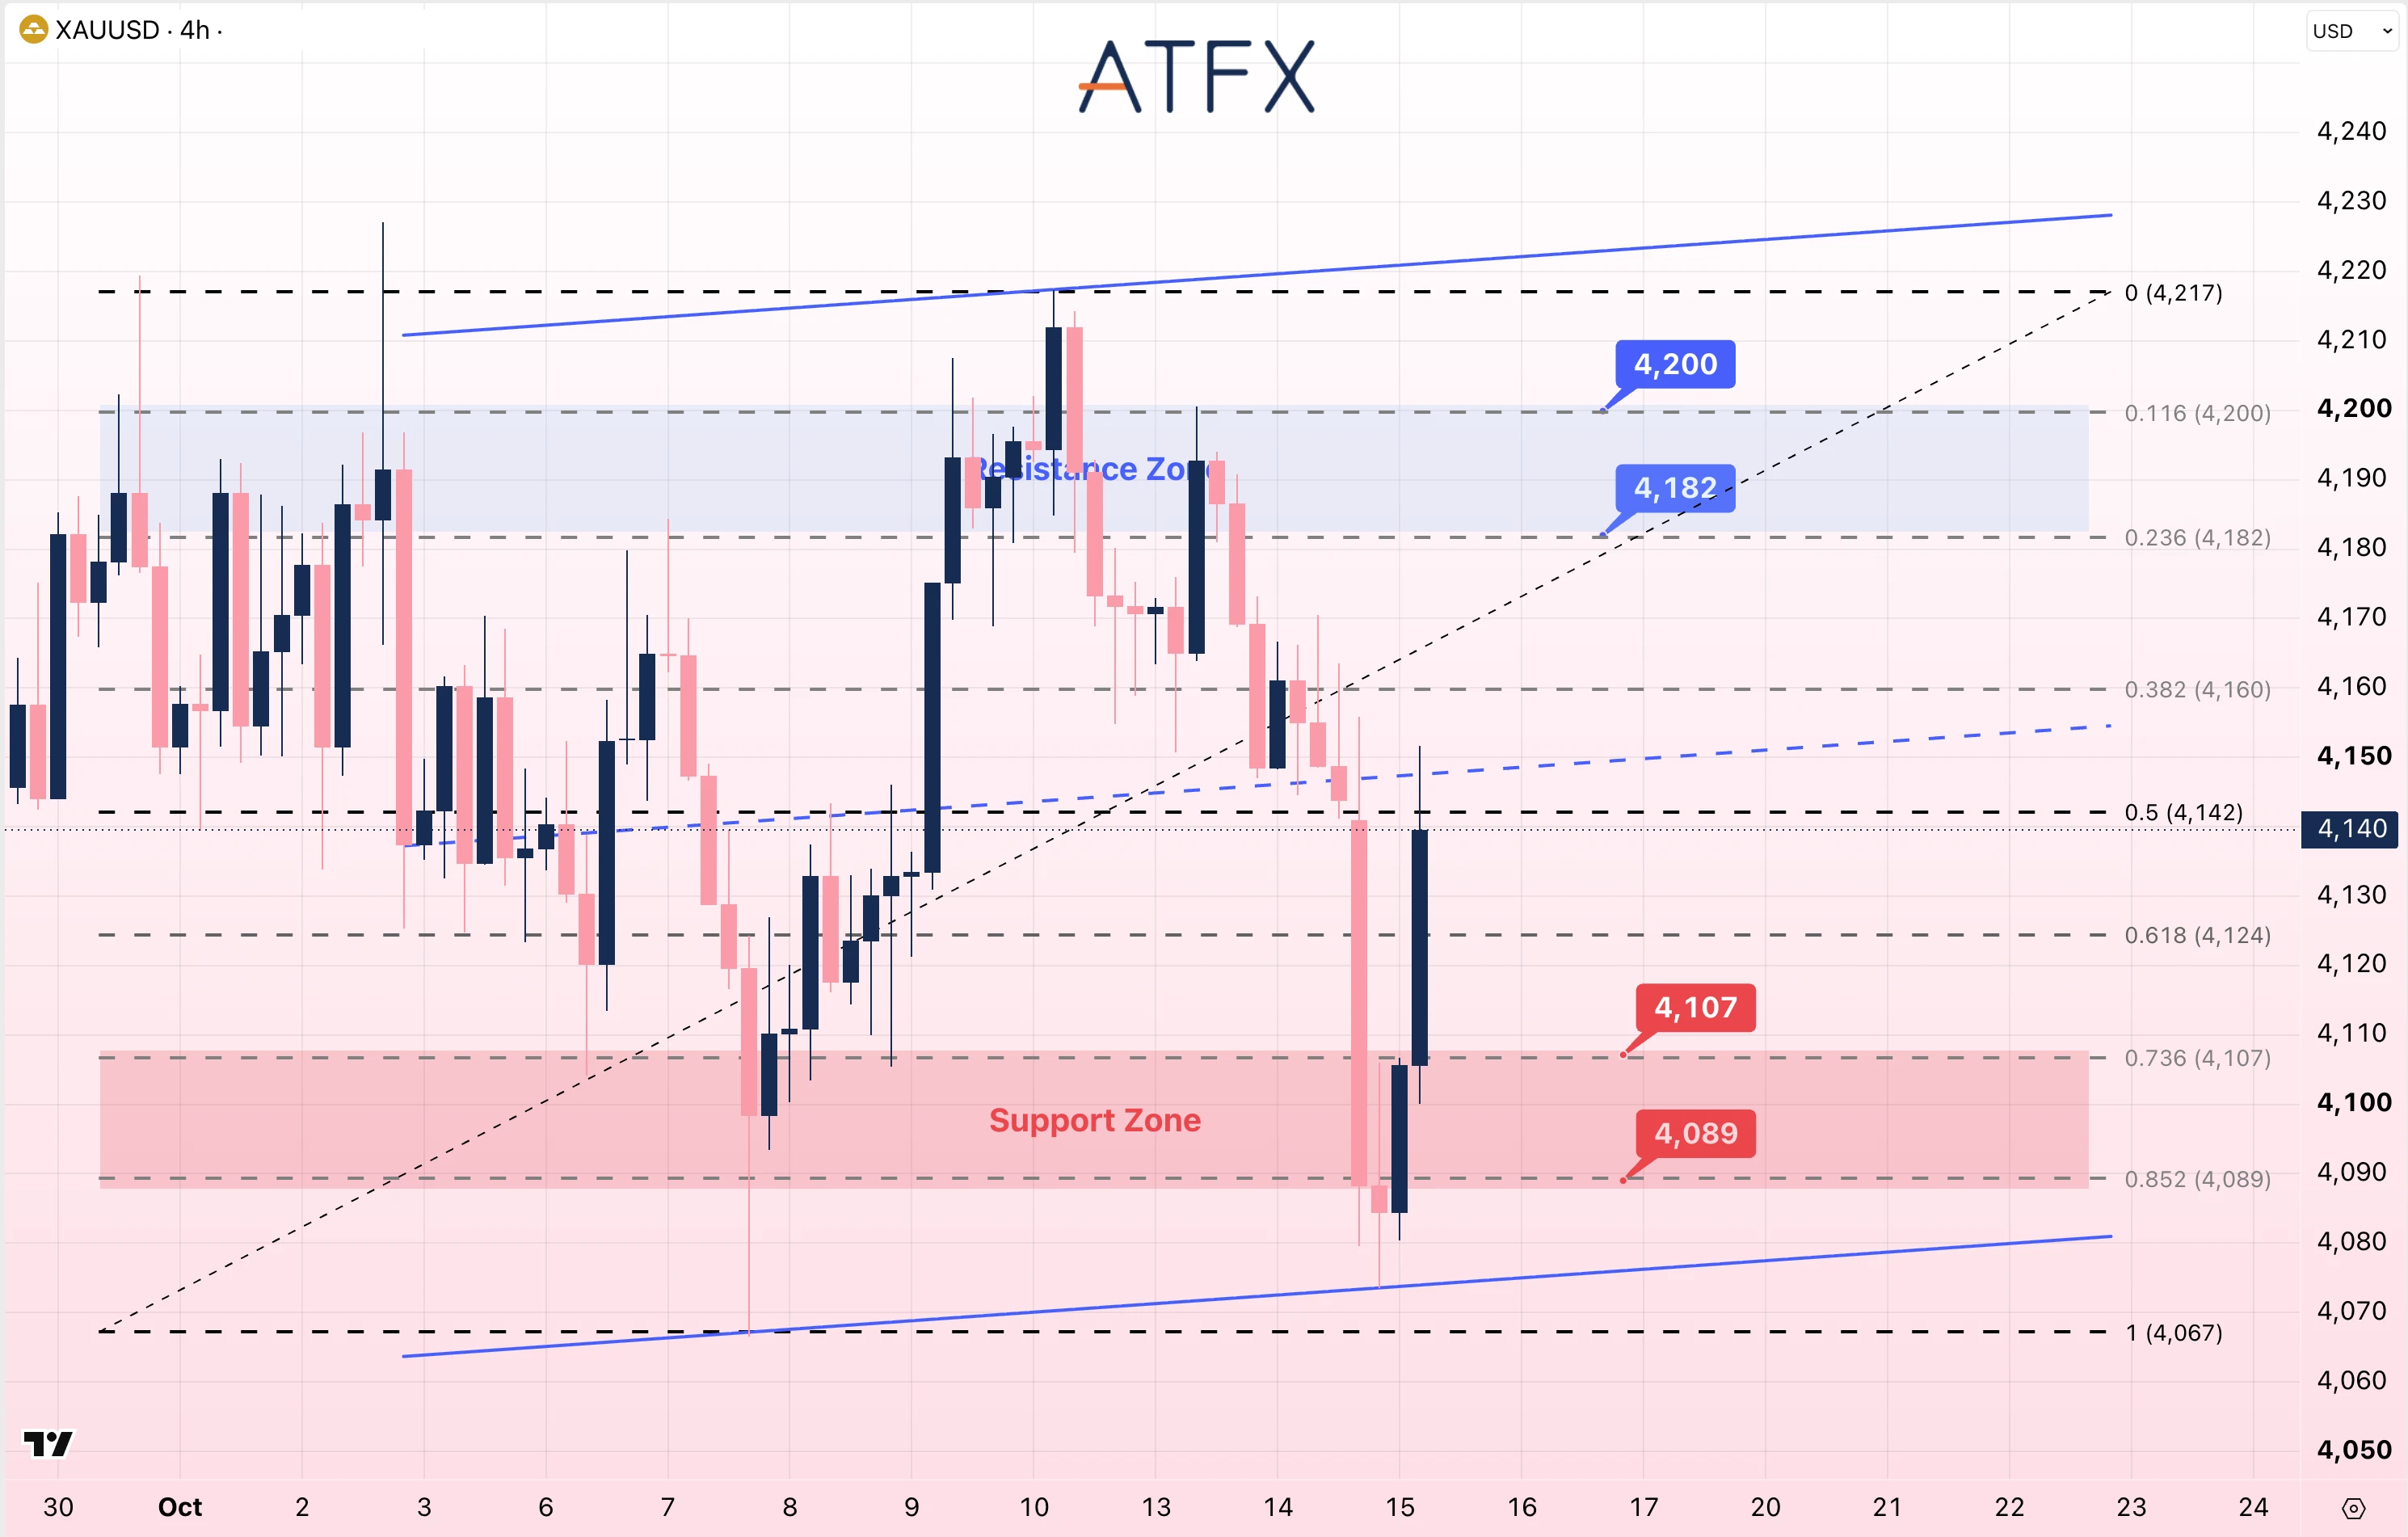
- Resistance: 4182/4200
- Support: 4107/4089
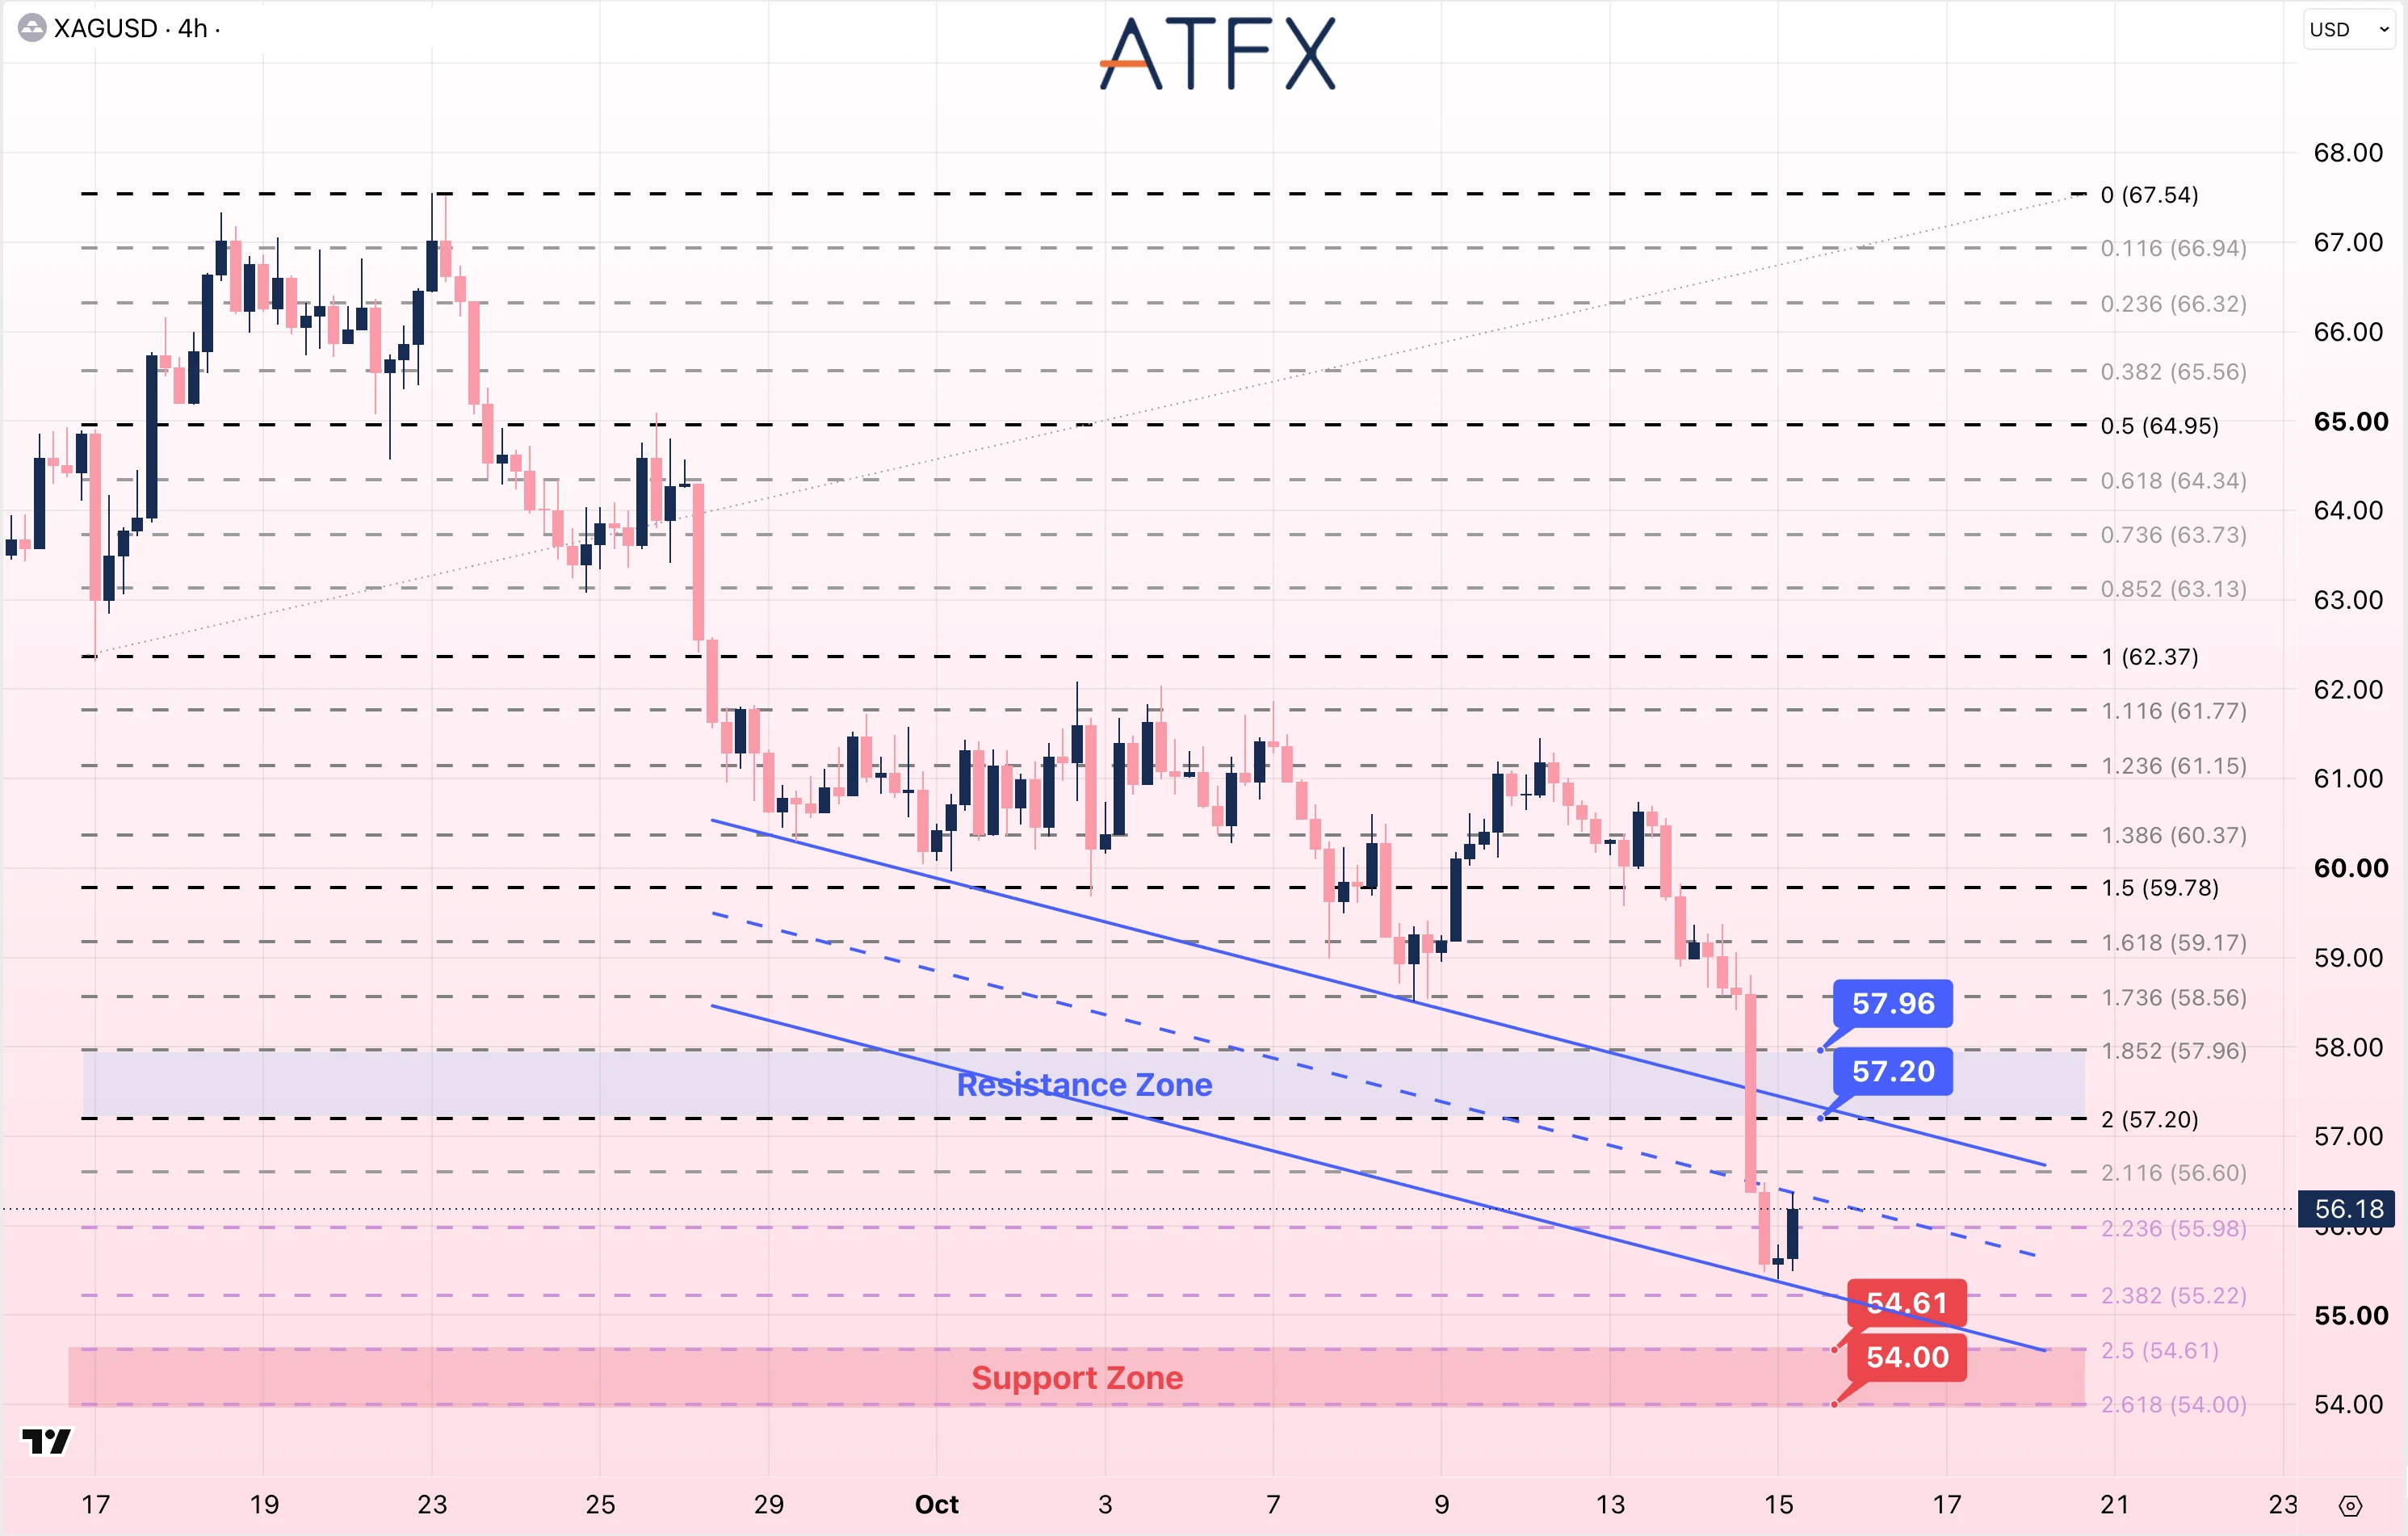
- Resistance: 57.20/57.96
- Support: 54.61/54.00
Technical Overview: Gold is near $4,140 after recovering from around $4,080. It has moved back above the $4,107/$4,089 support levels but remains below the midline of the gently rising channel near $4,150. The marked resistance levels are $4,182 and $4,200. Silver is near $56.18 after falling below $57.20 and then rebounding. It remains within a descending channel, with resistance at $57.20/$57.96 and support at $54.61/$54.00.
Bias: Gold Neutral; Silver Cautiously Bearish
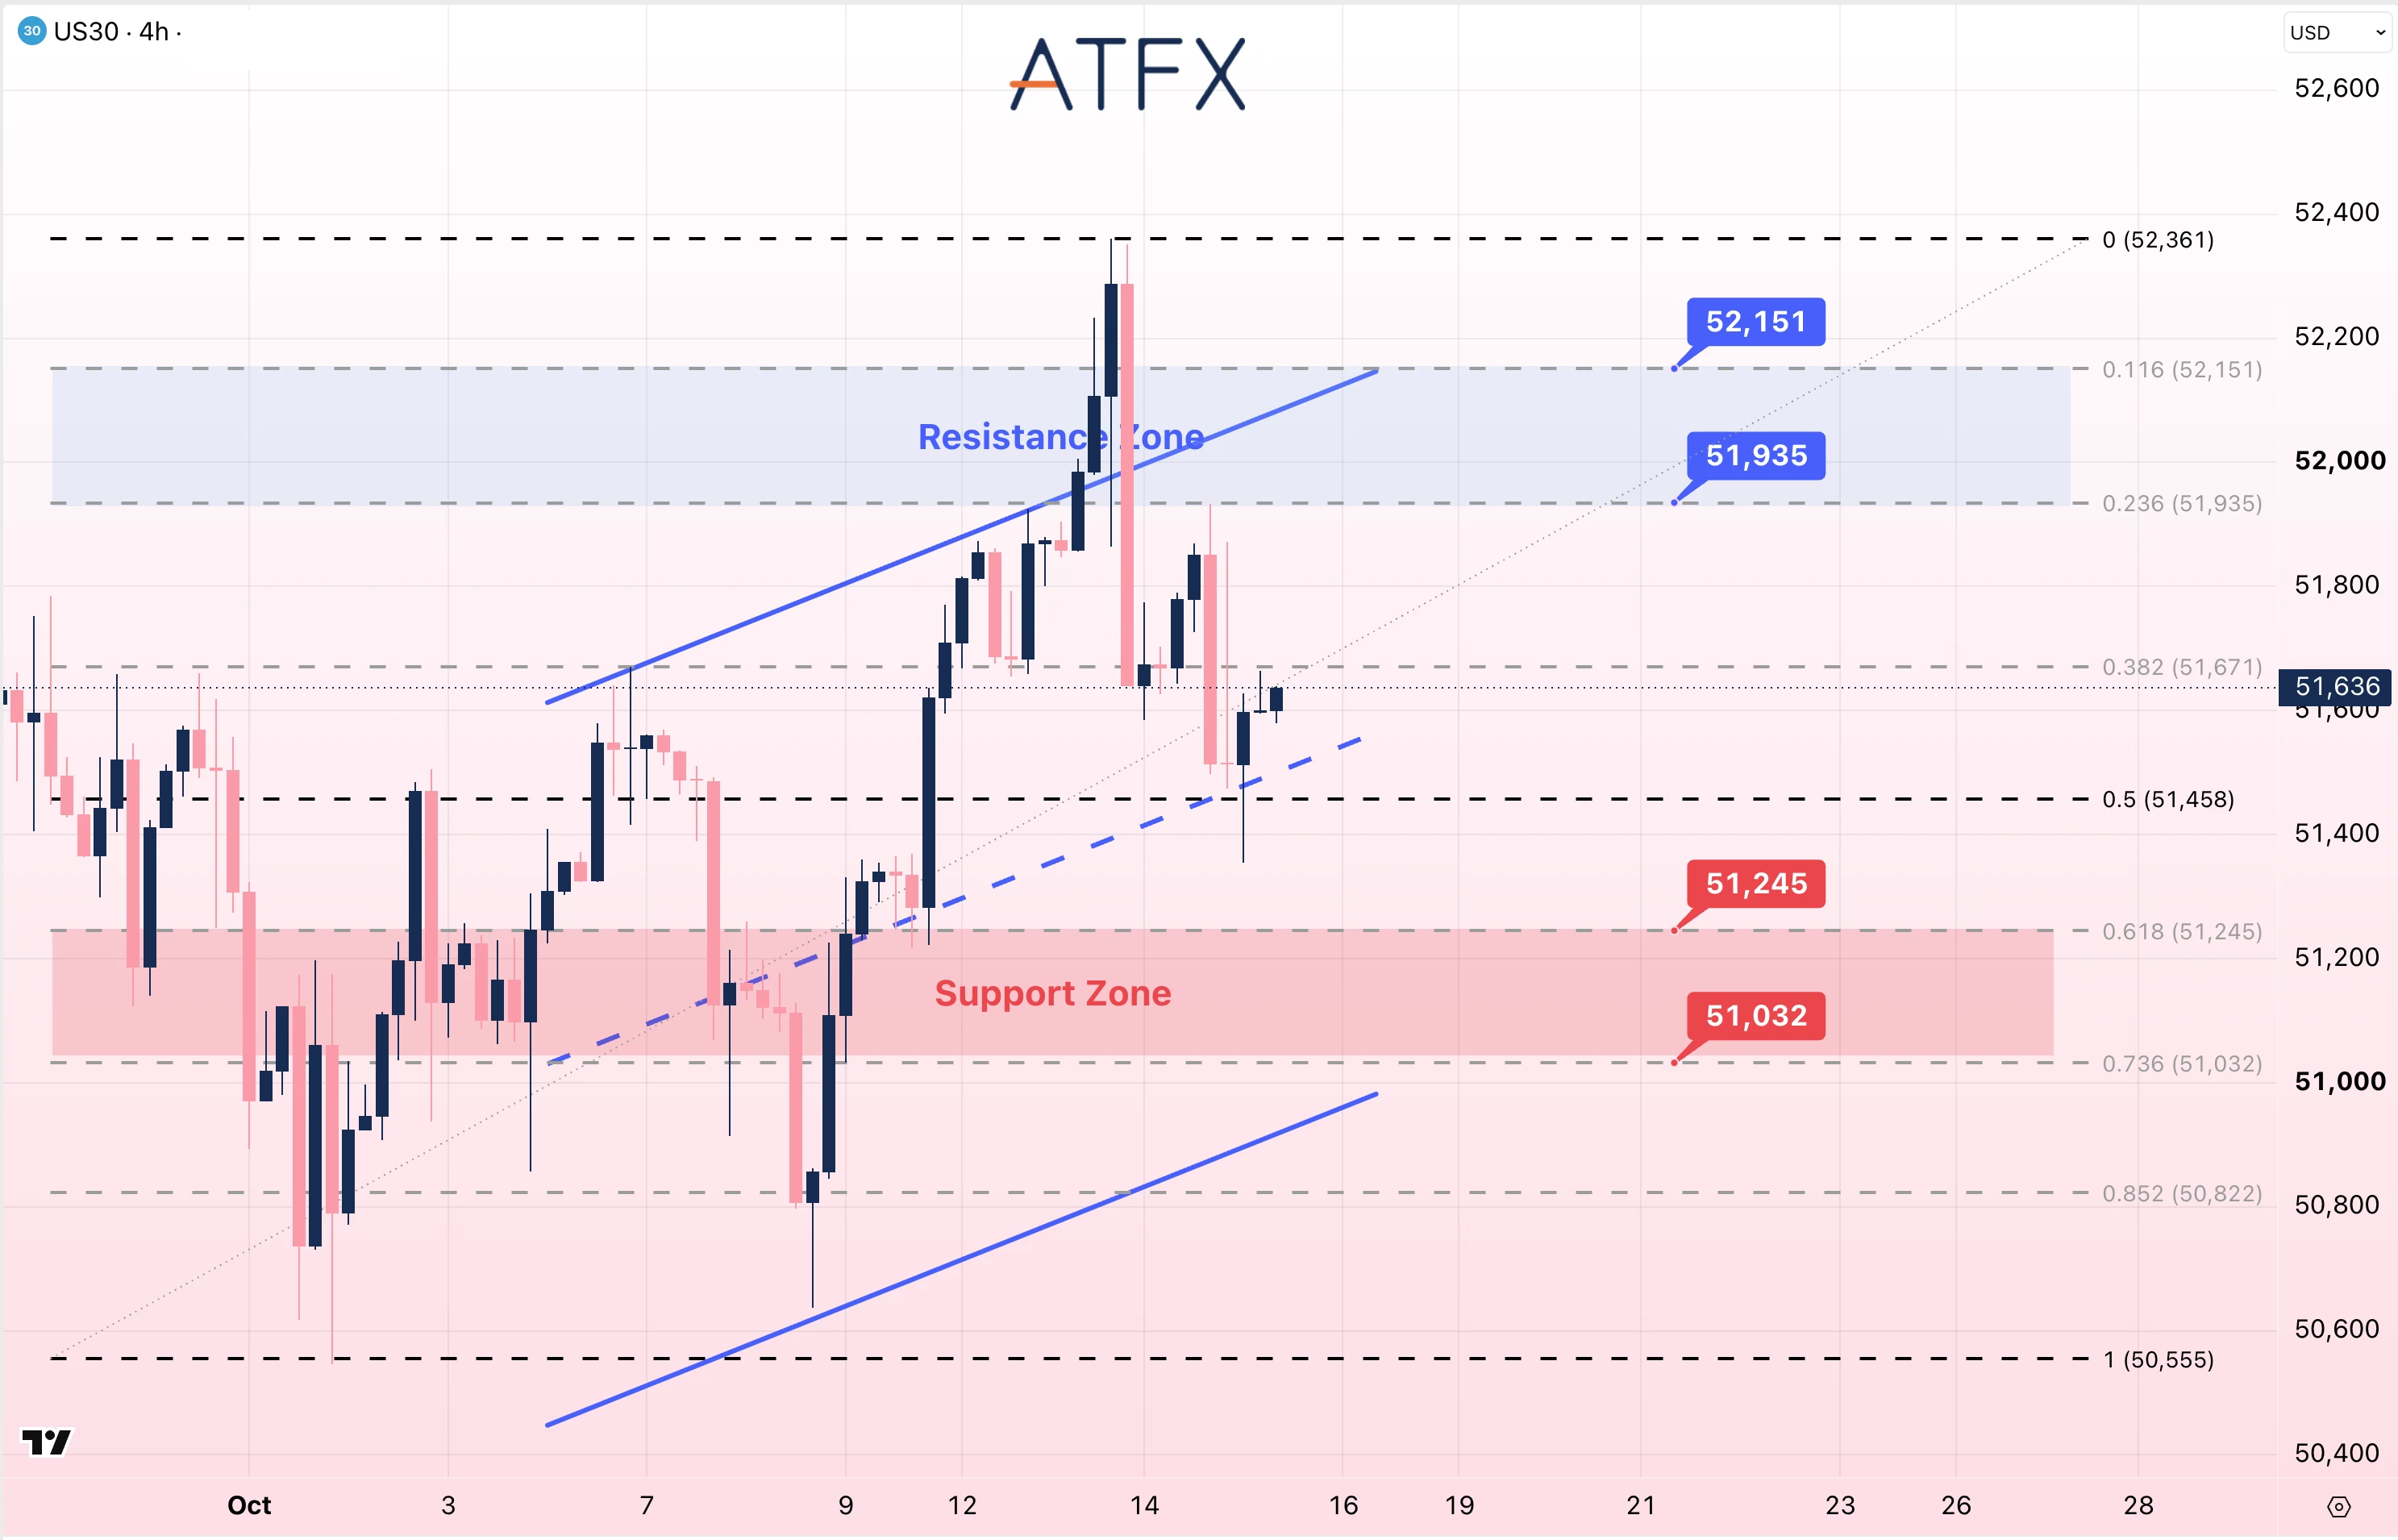
- Resistance: 51935/52151
- Support: 51245/51032
Technical Overview: US30 is near 51,636 after declining from 52,361 and rebounding from around 51,350. Price remains within the broader rising channel and above its midline, with 51,671 an intermediate Fibonacci level. A move above 51,935 would put 52,151 next among the marked resistance levels. Below 51,245, the next marked support is 51,032.
Bias: Neutral
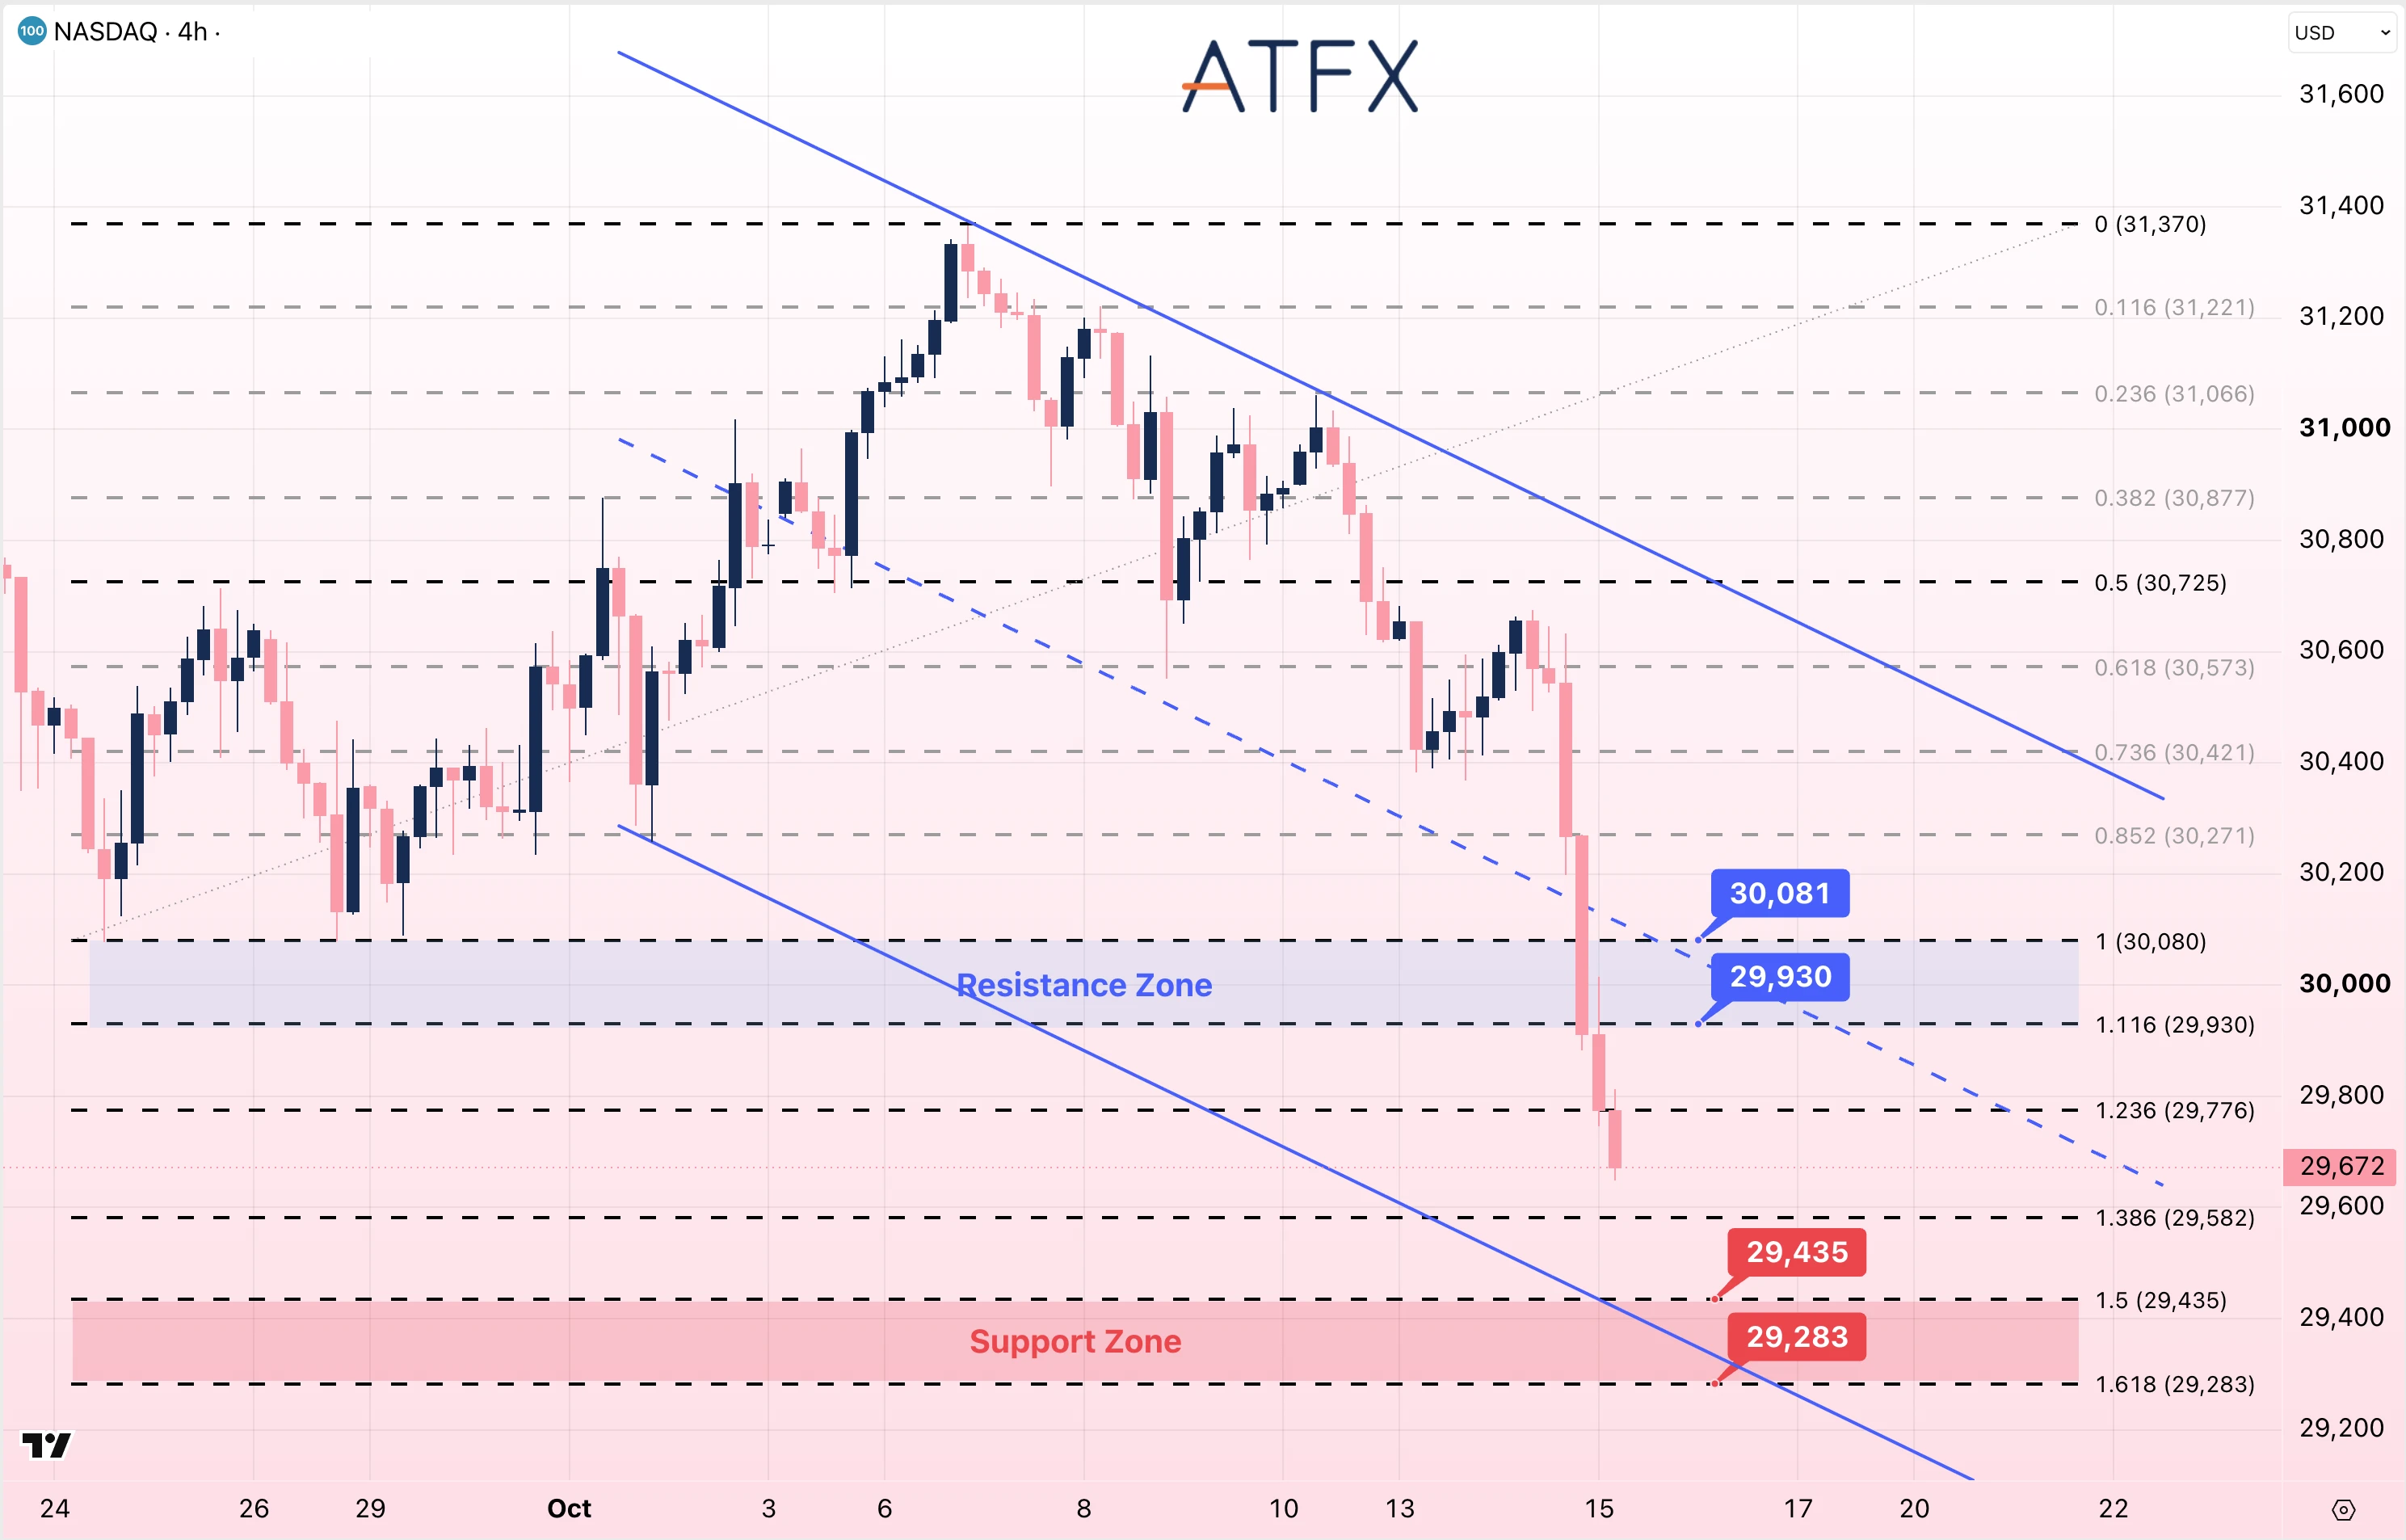
- Resistance: 29930/30081
- Support: 29435/29283
Technical Overview: NAS100 is near 29,672 after falling below 30,080 and the midline of the descending channel. Price is also below the 29,776 Fibonacci extension, with 29,582 an intermediate level above the 29,435/29,283 support zone. A move above 29,930 would return price to the marked resistance zone, which extends to 30,081.
Bias: Cautiously Bearish
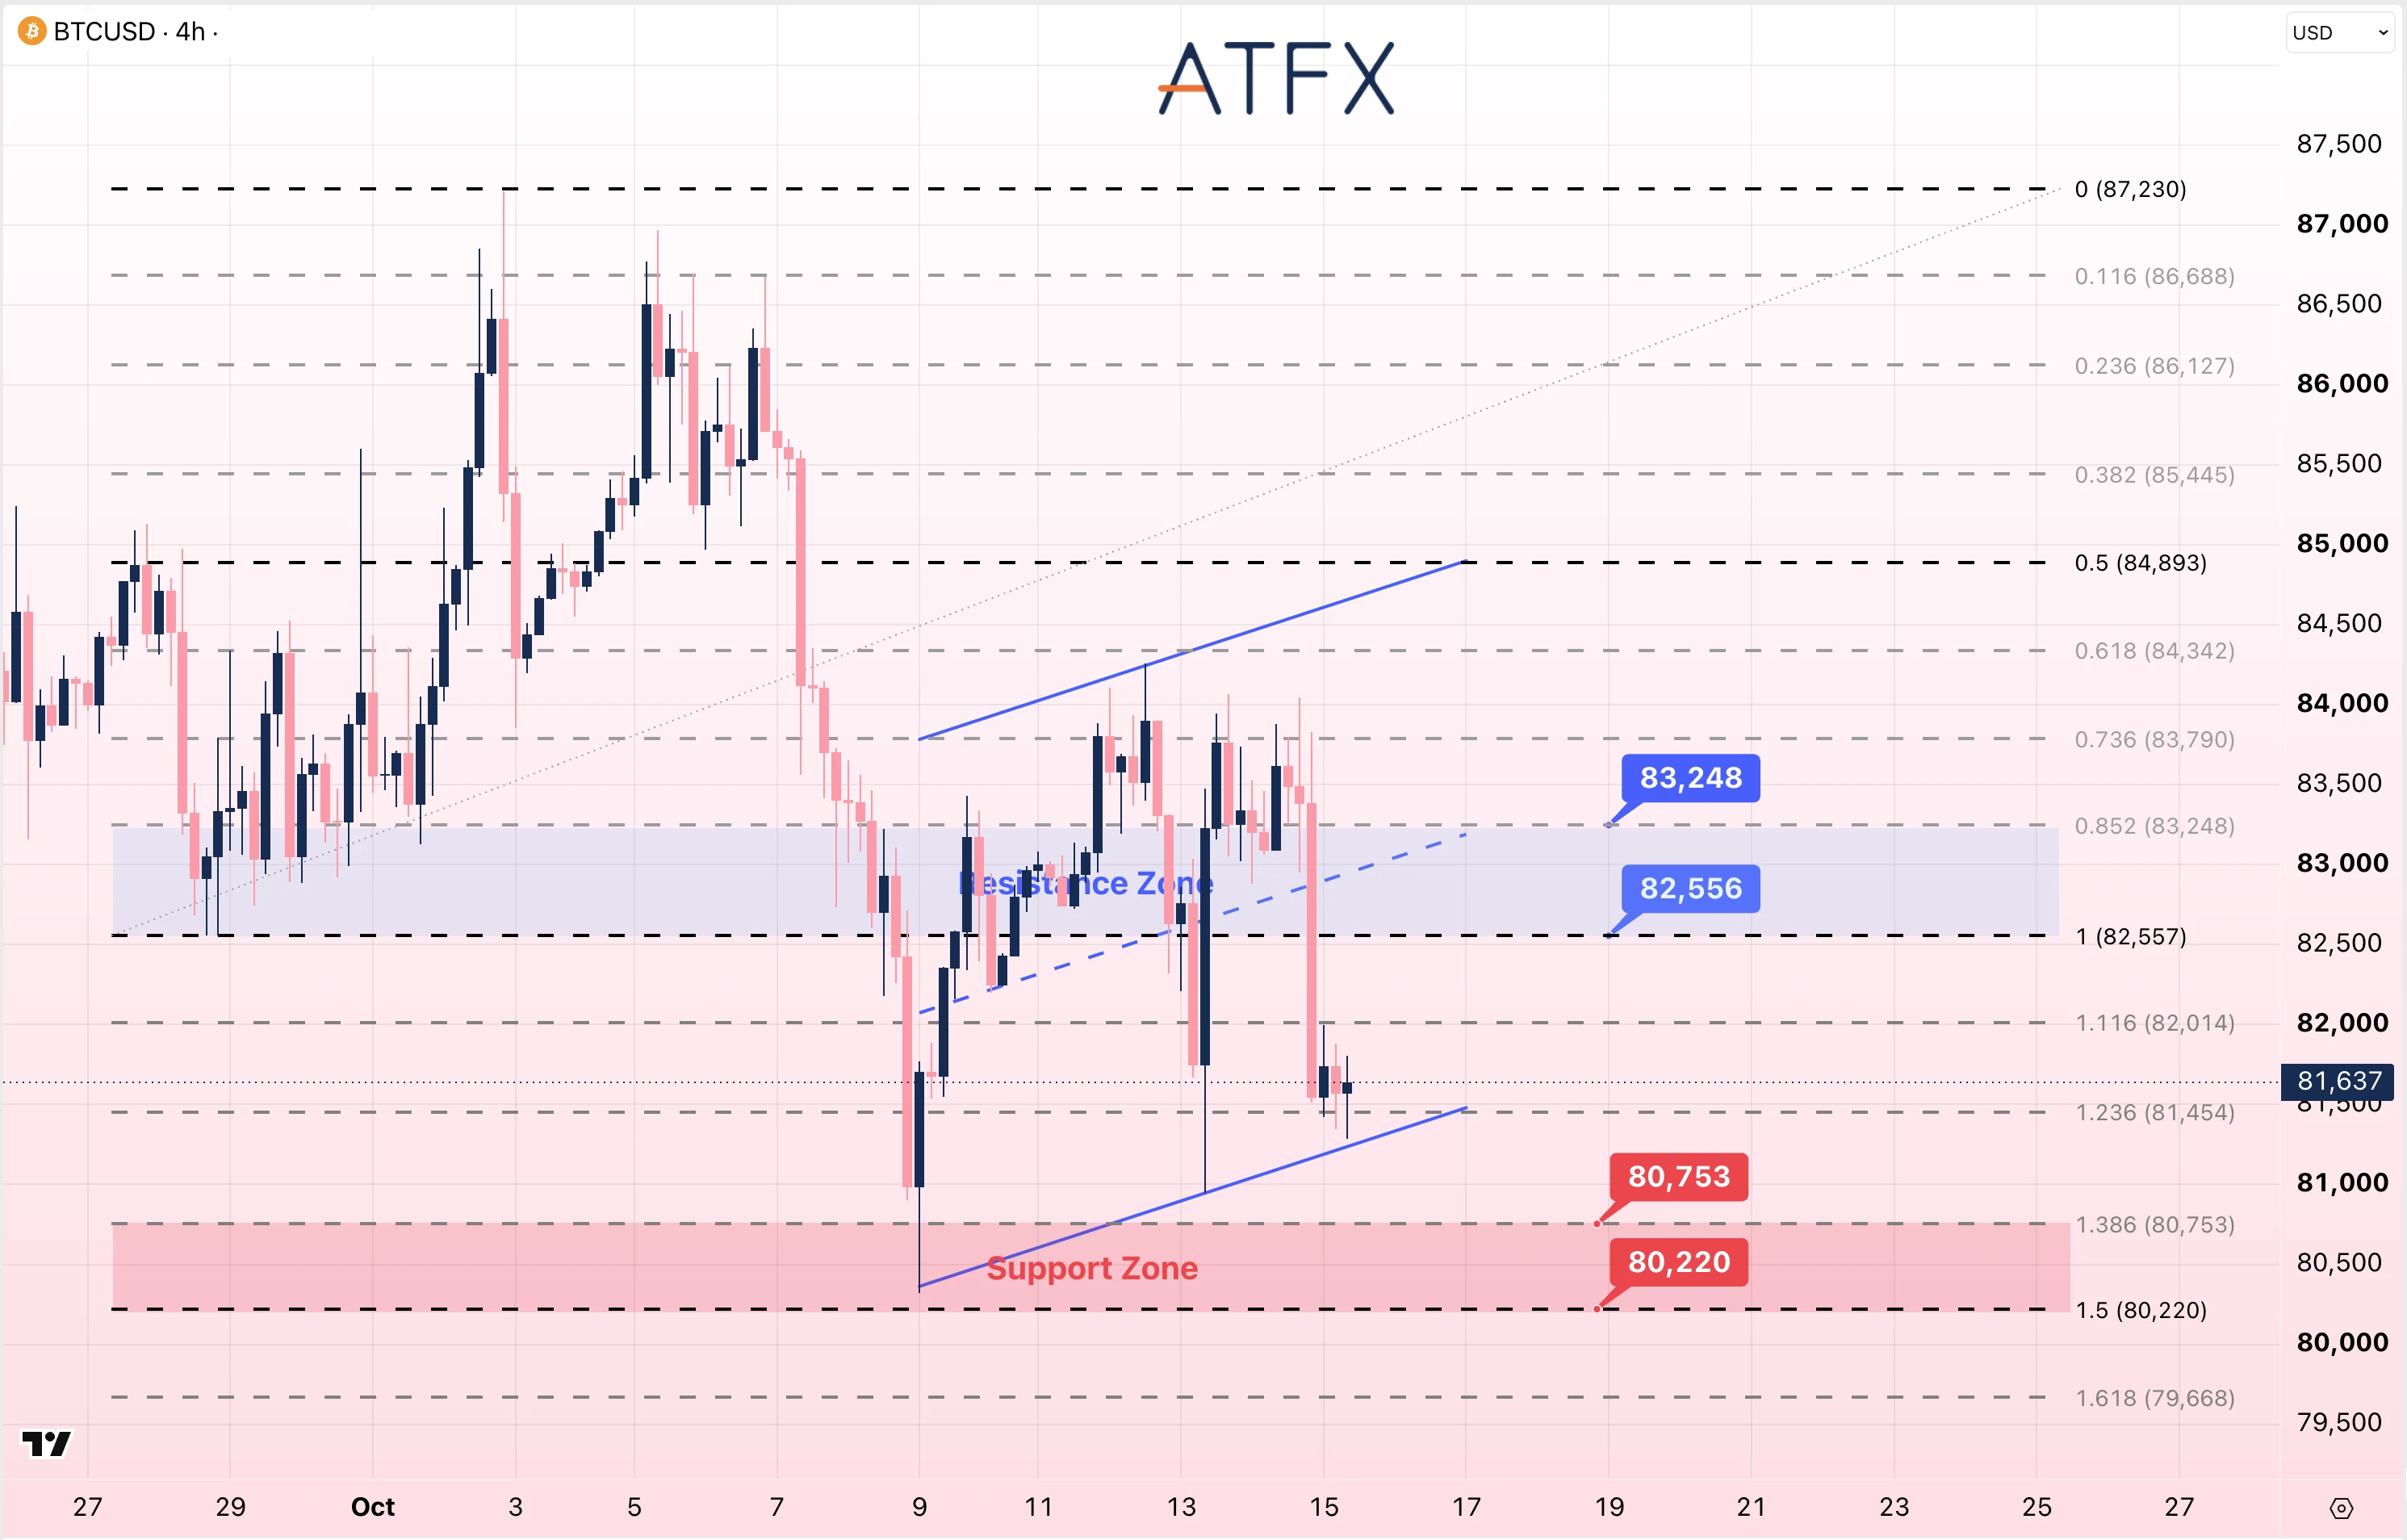
- Resistance: 82556/83248
- Support: 80753/80220
Technical Overview: Bitcoin is nearly $81,637 after declining from around $83,800. Price is below the short-term rising channel’s midline and near its lower boundary, with $81,454 as an intermediate Fibonacci level. A move above $82,556 would return price to the marked resistance zone, extending to $83,248. Below $80,753, the next marked support is $80,220.
Bias: Neutral to Cautiously Bearish
Disclaimer: This analysis is for reference only and does not constitute investment advice.