


Key Takeaways
Today’s Focus: Today’s calendar includes policy remarks from Fed Chair Warsh at 11:30 (GMT+8). Comments may clarify how policymakers are assessing inflation and growth. Euro-area final September inflation at 17:00 is forecast at 3.8% year-on-year, versus 3.2% previously. US September industrial and manufacturing production follows at 21:15, with industrial output forecast to rise 0.4% month-on-month after no change. Oil markets also remain focused on inventories, reserve releases and Middle East supply developments. |
Global Market Review 16/10/2026
- The Dow rose 1.08% to 52,177, the S&P 500 gained 0.33% to 7,744, and the Nasdaq added 0.08% to 26,713.
- The Dollar Index fell 0.51% to 102.00.
- The 10-year fell 12.7 basis points to 5.058%.
- Brent declined 0.24% to $105.81, WTI rose 2.65% to $97.61, and gold gained 1.59% to $4,170.25.
Economic Calendar
Key Events on October 16 (GMT+8)
| Time (GMT+8) | Event | Importance |
|---|---|---|
| 00:00 | US EIA Crude Oil Stocks Change | ** |
| 10:00 | BoE Governor Bailey Speech | *** |
| 11:30 | Fed Chair Warsh Speech | *** |
| 17:00 | EU Final Inflation Rate YoY SEP | ** |
| 21:15 | US Industrial & Manufacturing Production MoM SEP | ** |
Key Data and Events Coming Next Week (October 19–23, GMT+8)
- Monday, October 19: Hong Kong Holiday; CN GDP Q3; CA CPI SEP
- Tuesday, October 20: CN Loan Prime Rate (LPR); UK Unemployment Rate AUG; US ADP Weekly Employment Change; US Housing Starts & Building Permits
- Wednesday, October 21: US API Crude Oil Stock Change; UK CPI & PPI SEP; US EIA Crude Oil Stocks Change
- Thursday, October 22: NZ CPI Q3; US Initial Jobless Claims; US CB Leading Index
- Friday, October 23: AU, JP, Germany, EU, UK & US Manufacturing & Services PMI OCT; JP National CPI SEP; UK Retail Sales SEP; US Michigan Consumer Sentiment OCT
Markets Analysis 16/10/2026
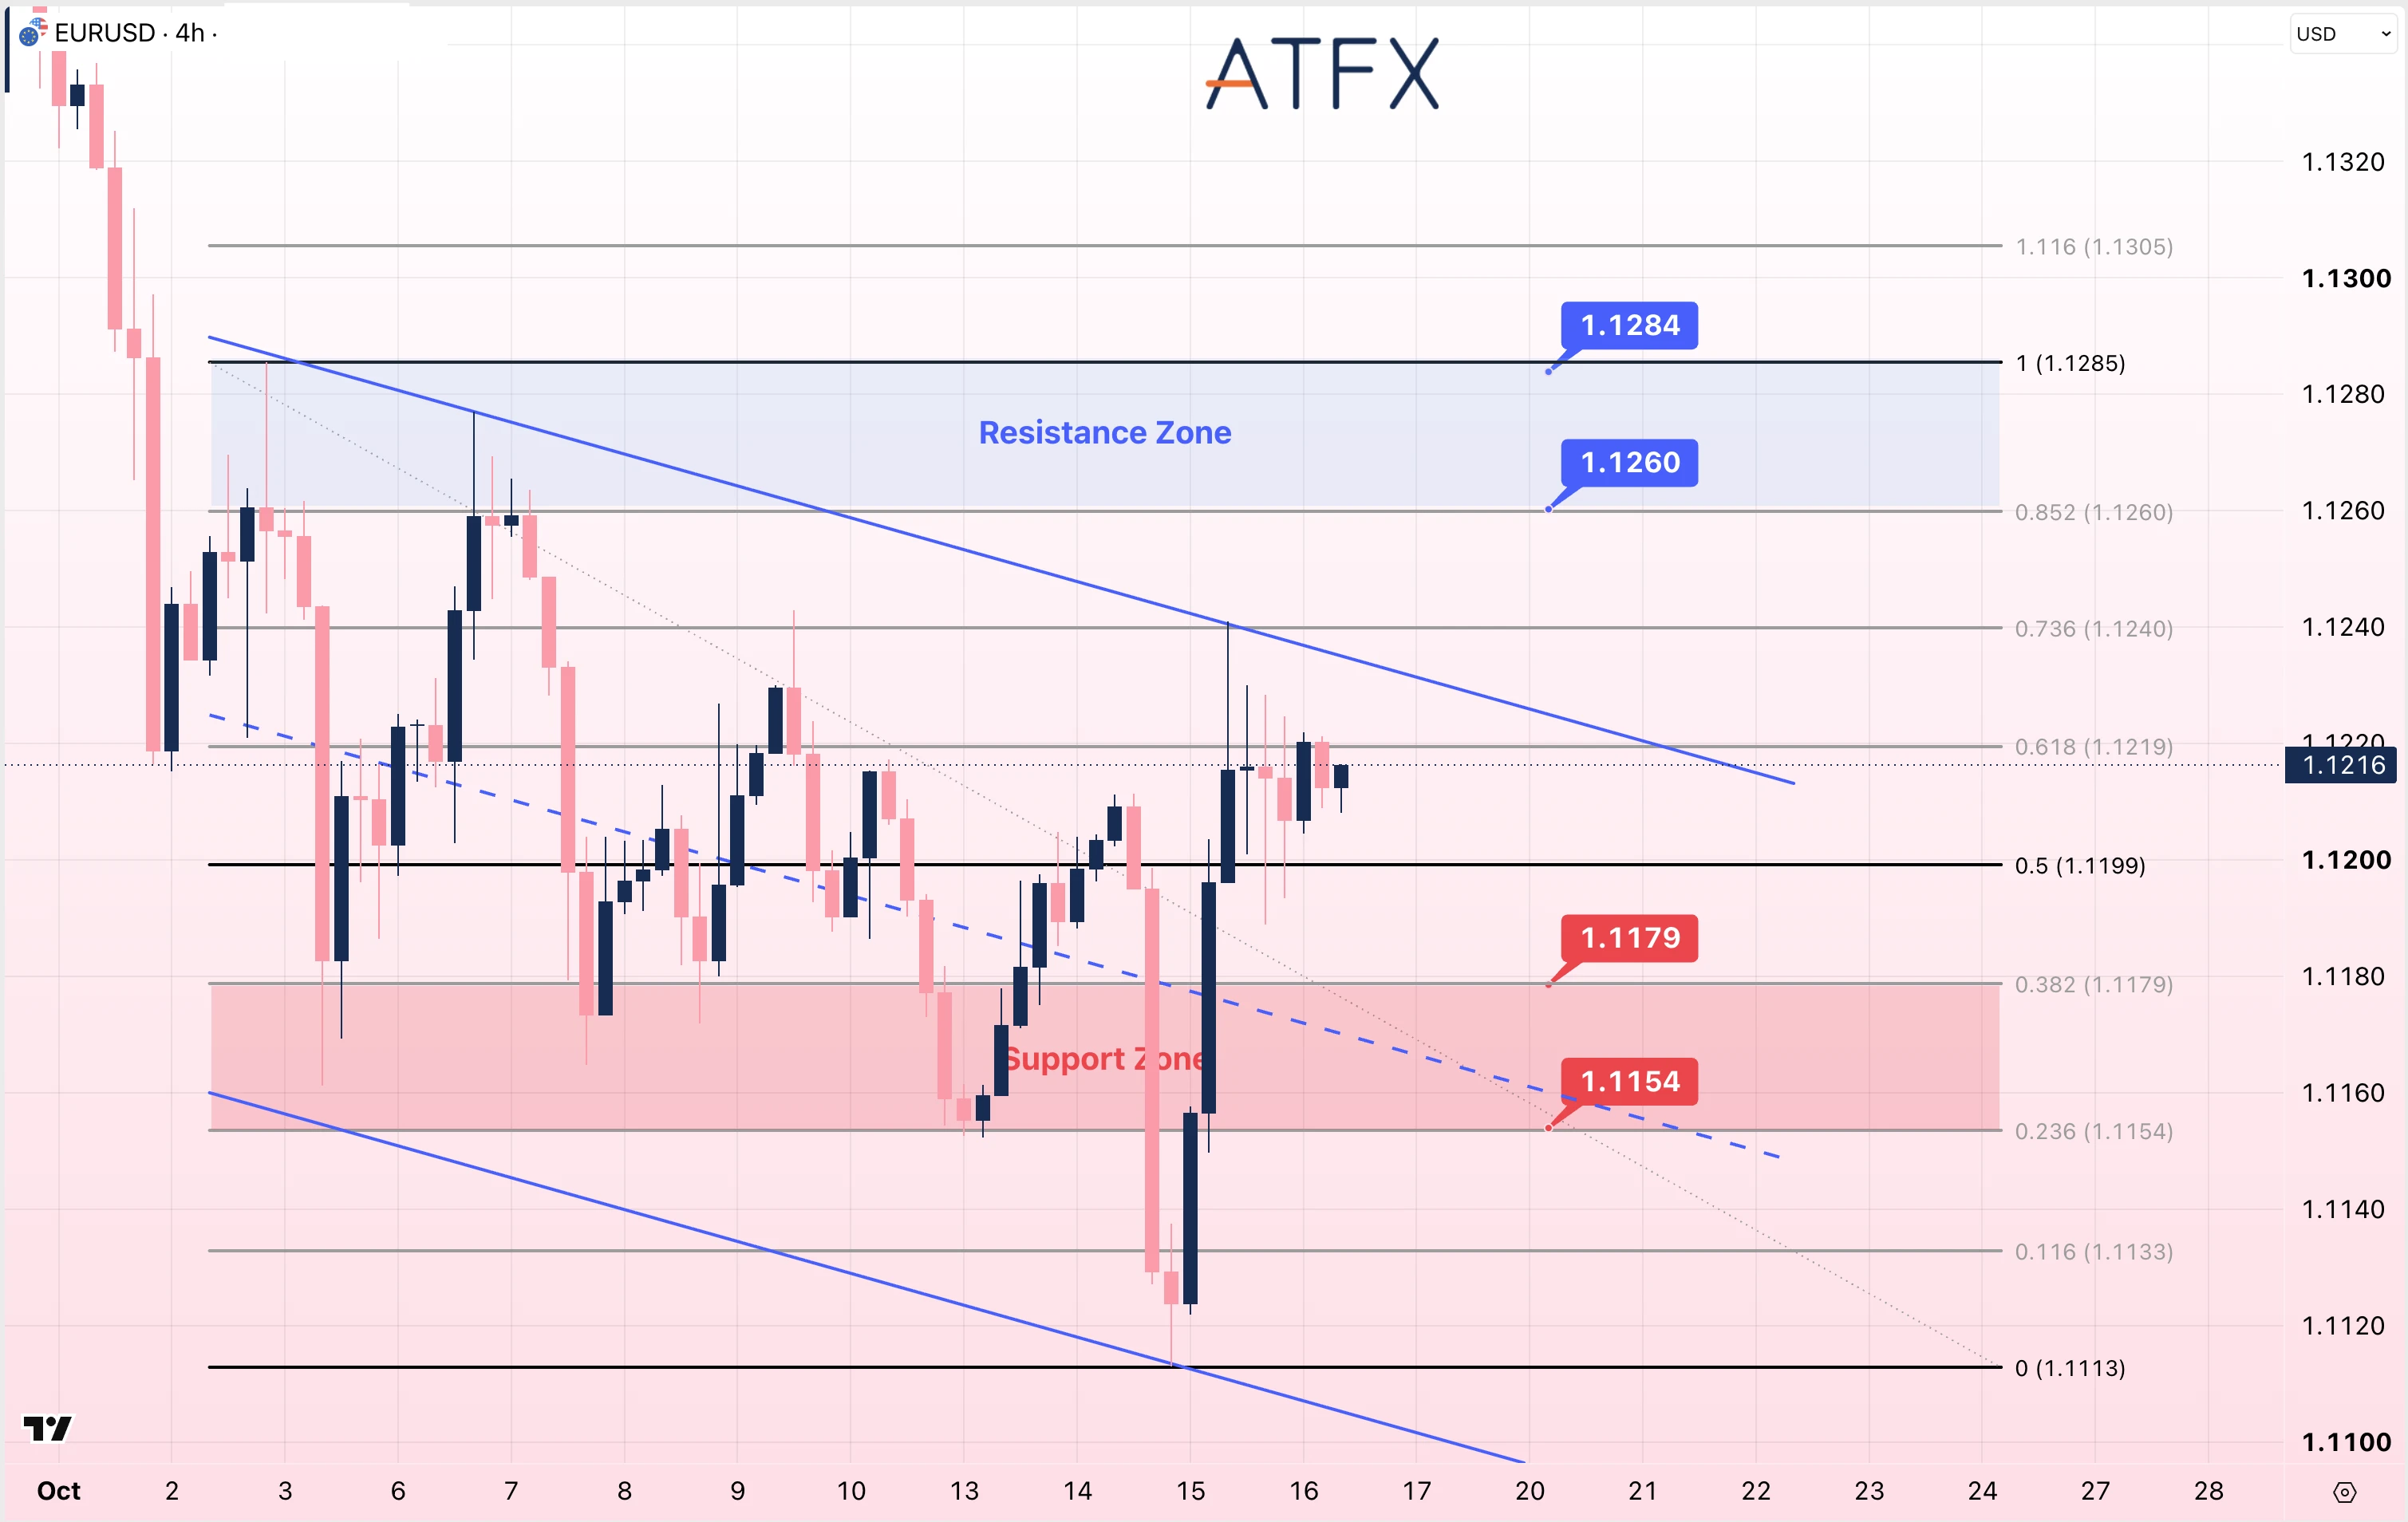
- Resistance: 1.1260/1.1284
- Support: 1.1179/1.1154
Technical Overview: EUR/USD is near 1.1216 after rebounding from the 1.1113 area. Price is above the descending channel’s midline but below the 1.1219 Fibonacci level, with the upper boundary nearby. A move above 1.1260 would put 1.1284 next among the marked resistance levels. Below 1.1179, the next marked support is 1.1154.
Bias: Neutral to Cautiously Bullish
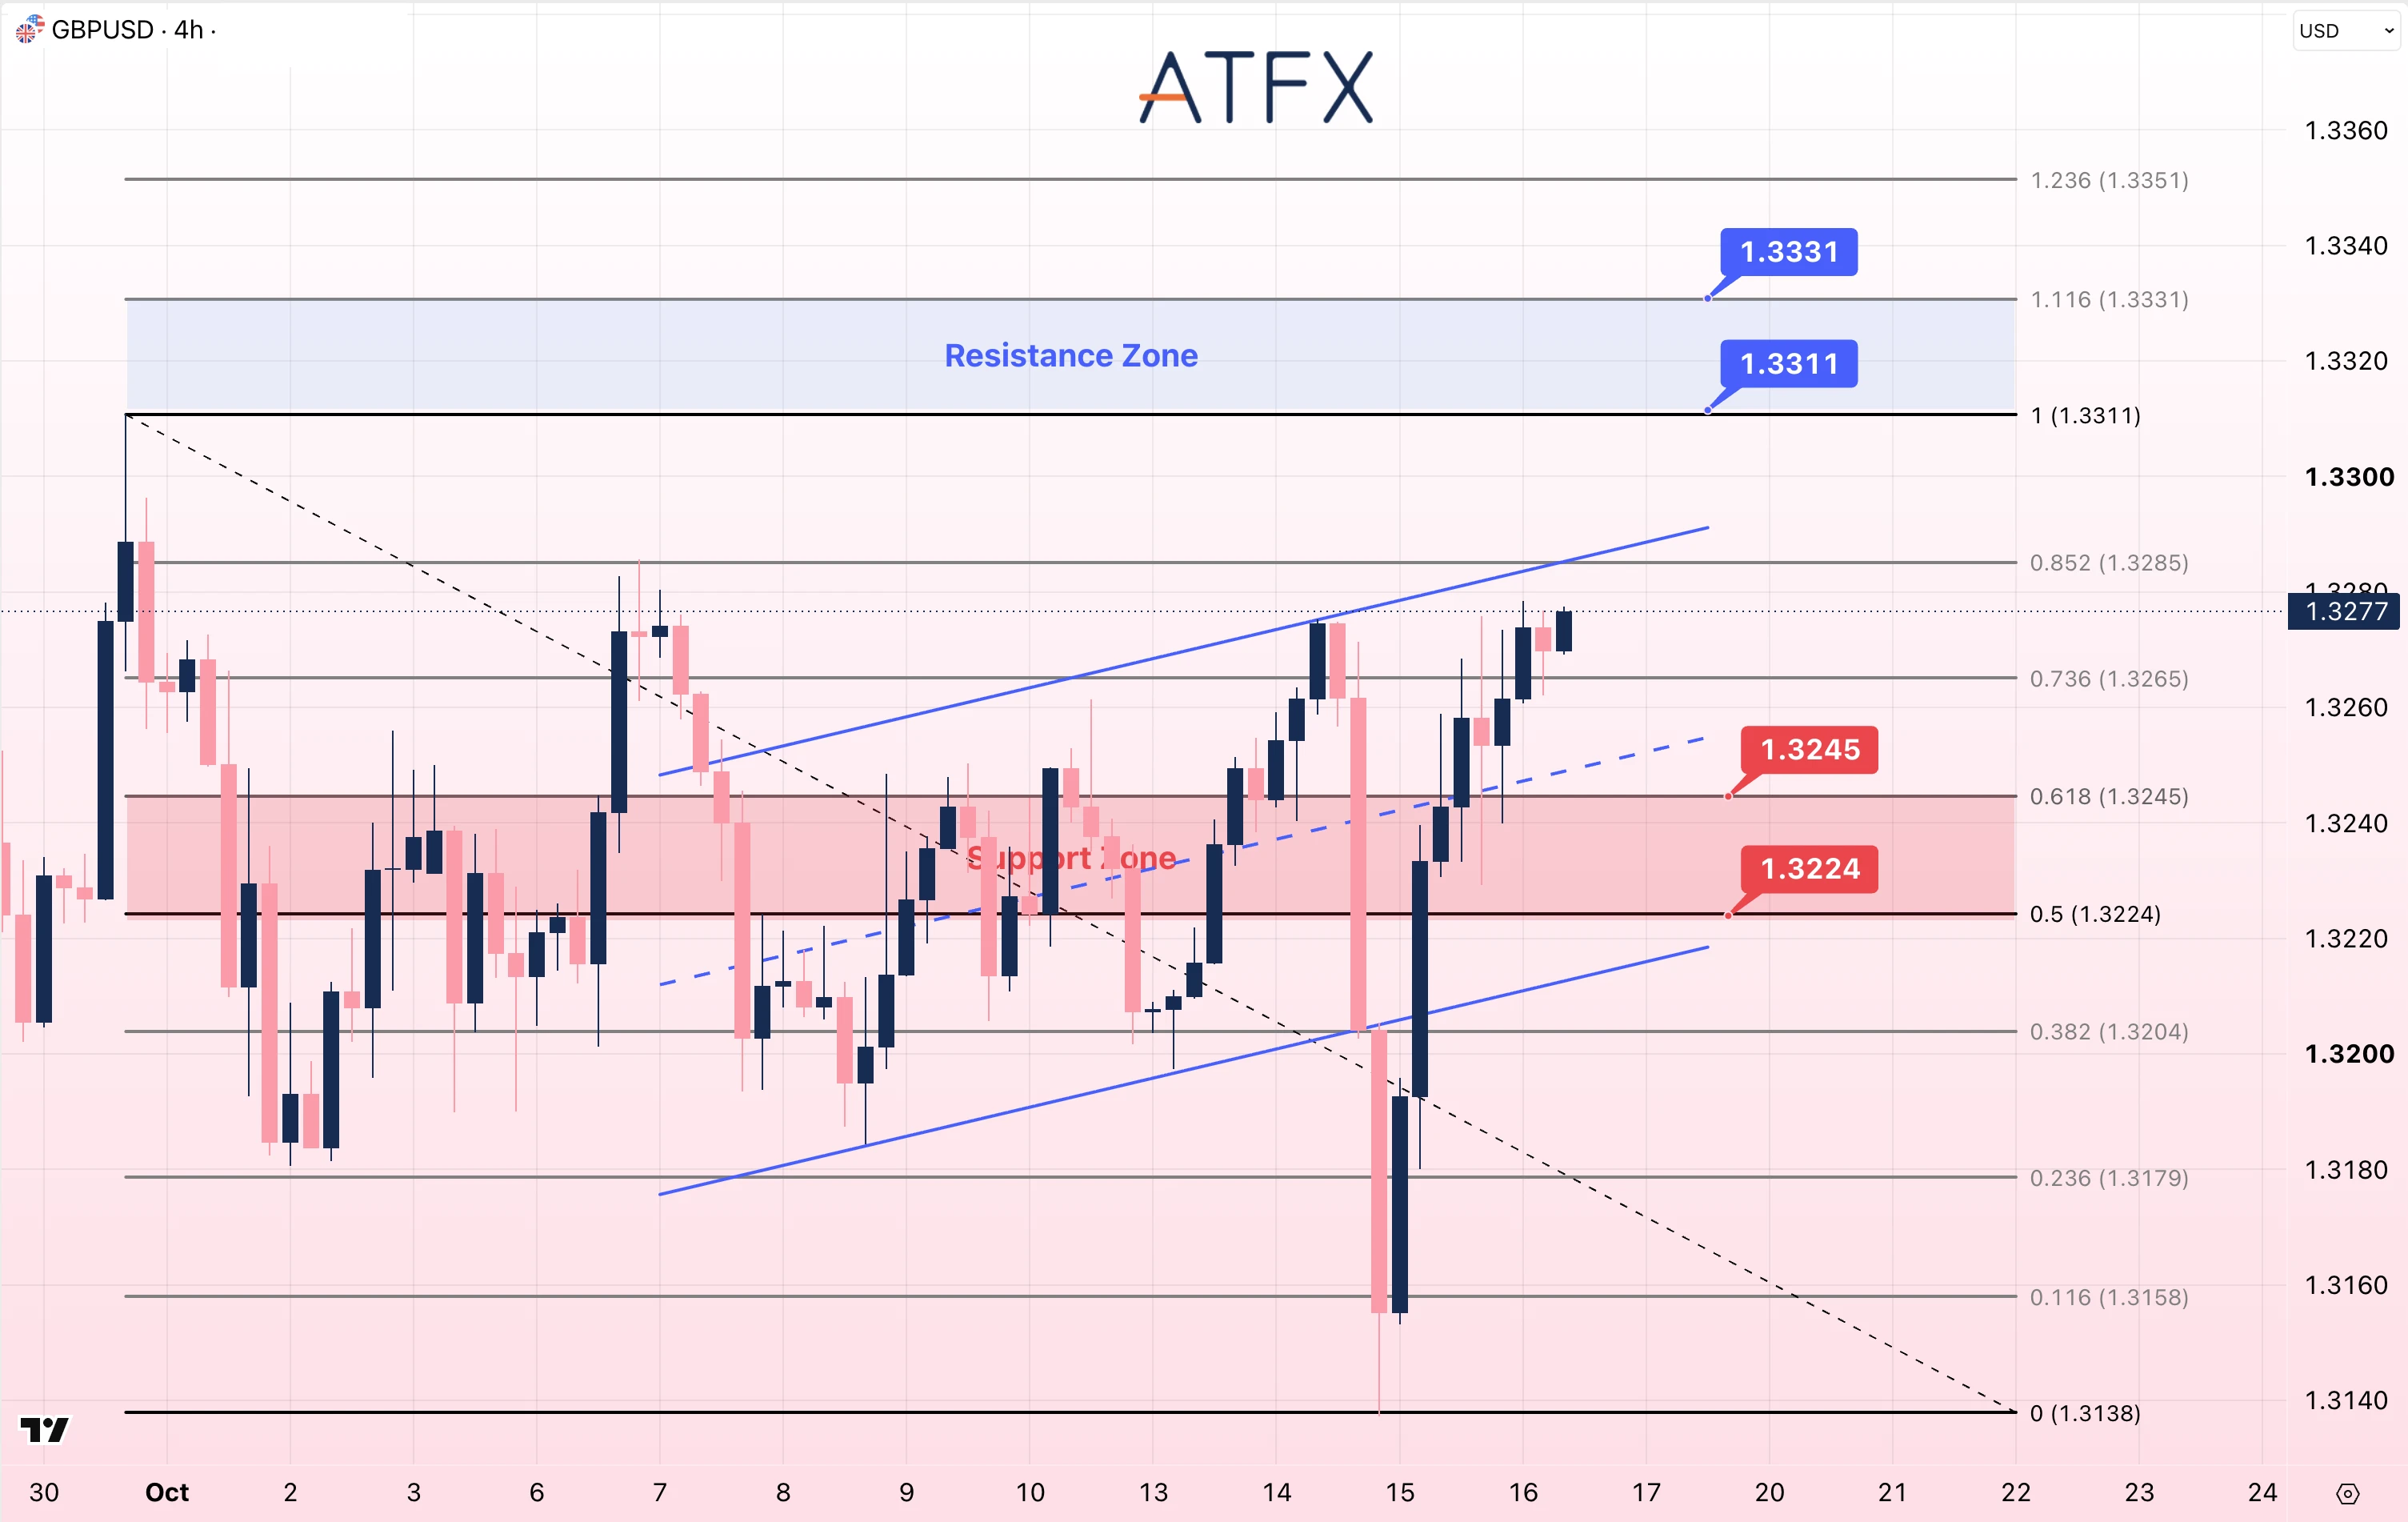
- Resistance: 1.3311/1.3331
- Support: 1.3245/1.3224
Technical Overview: GBP/USD is near 1.3277 after the Dollar weakened and UK August GDP grew 0.1%. On the four-hour chart, price is above the rising channel’s midline and the 1.3265 Fibonacci level. The next intermediate level is 1.3285, before marked resistance at 1.3311/1.3331. Below 1.3245, the next marked support is 1.3224.
Bias: Mildly Bullish
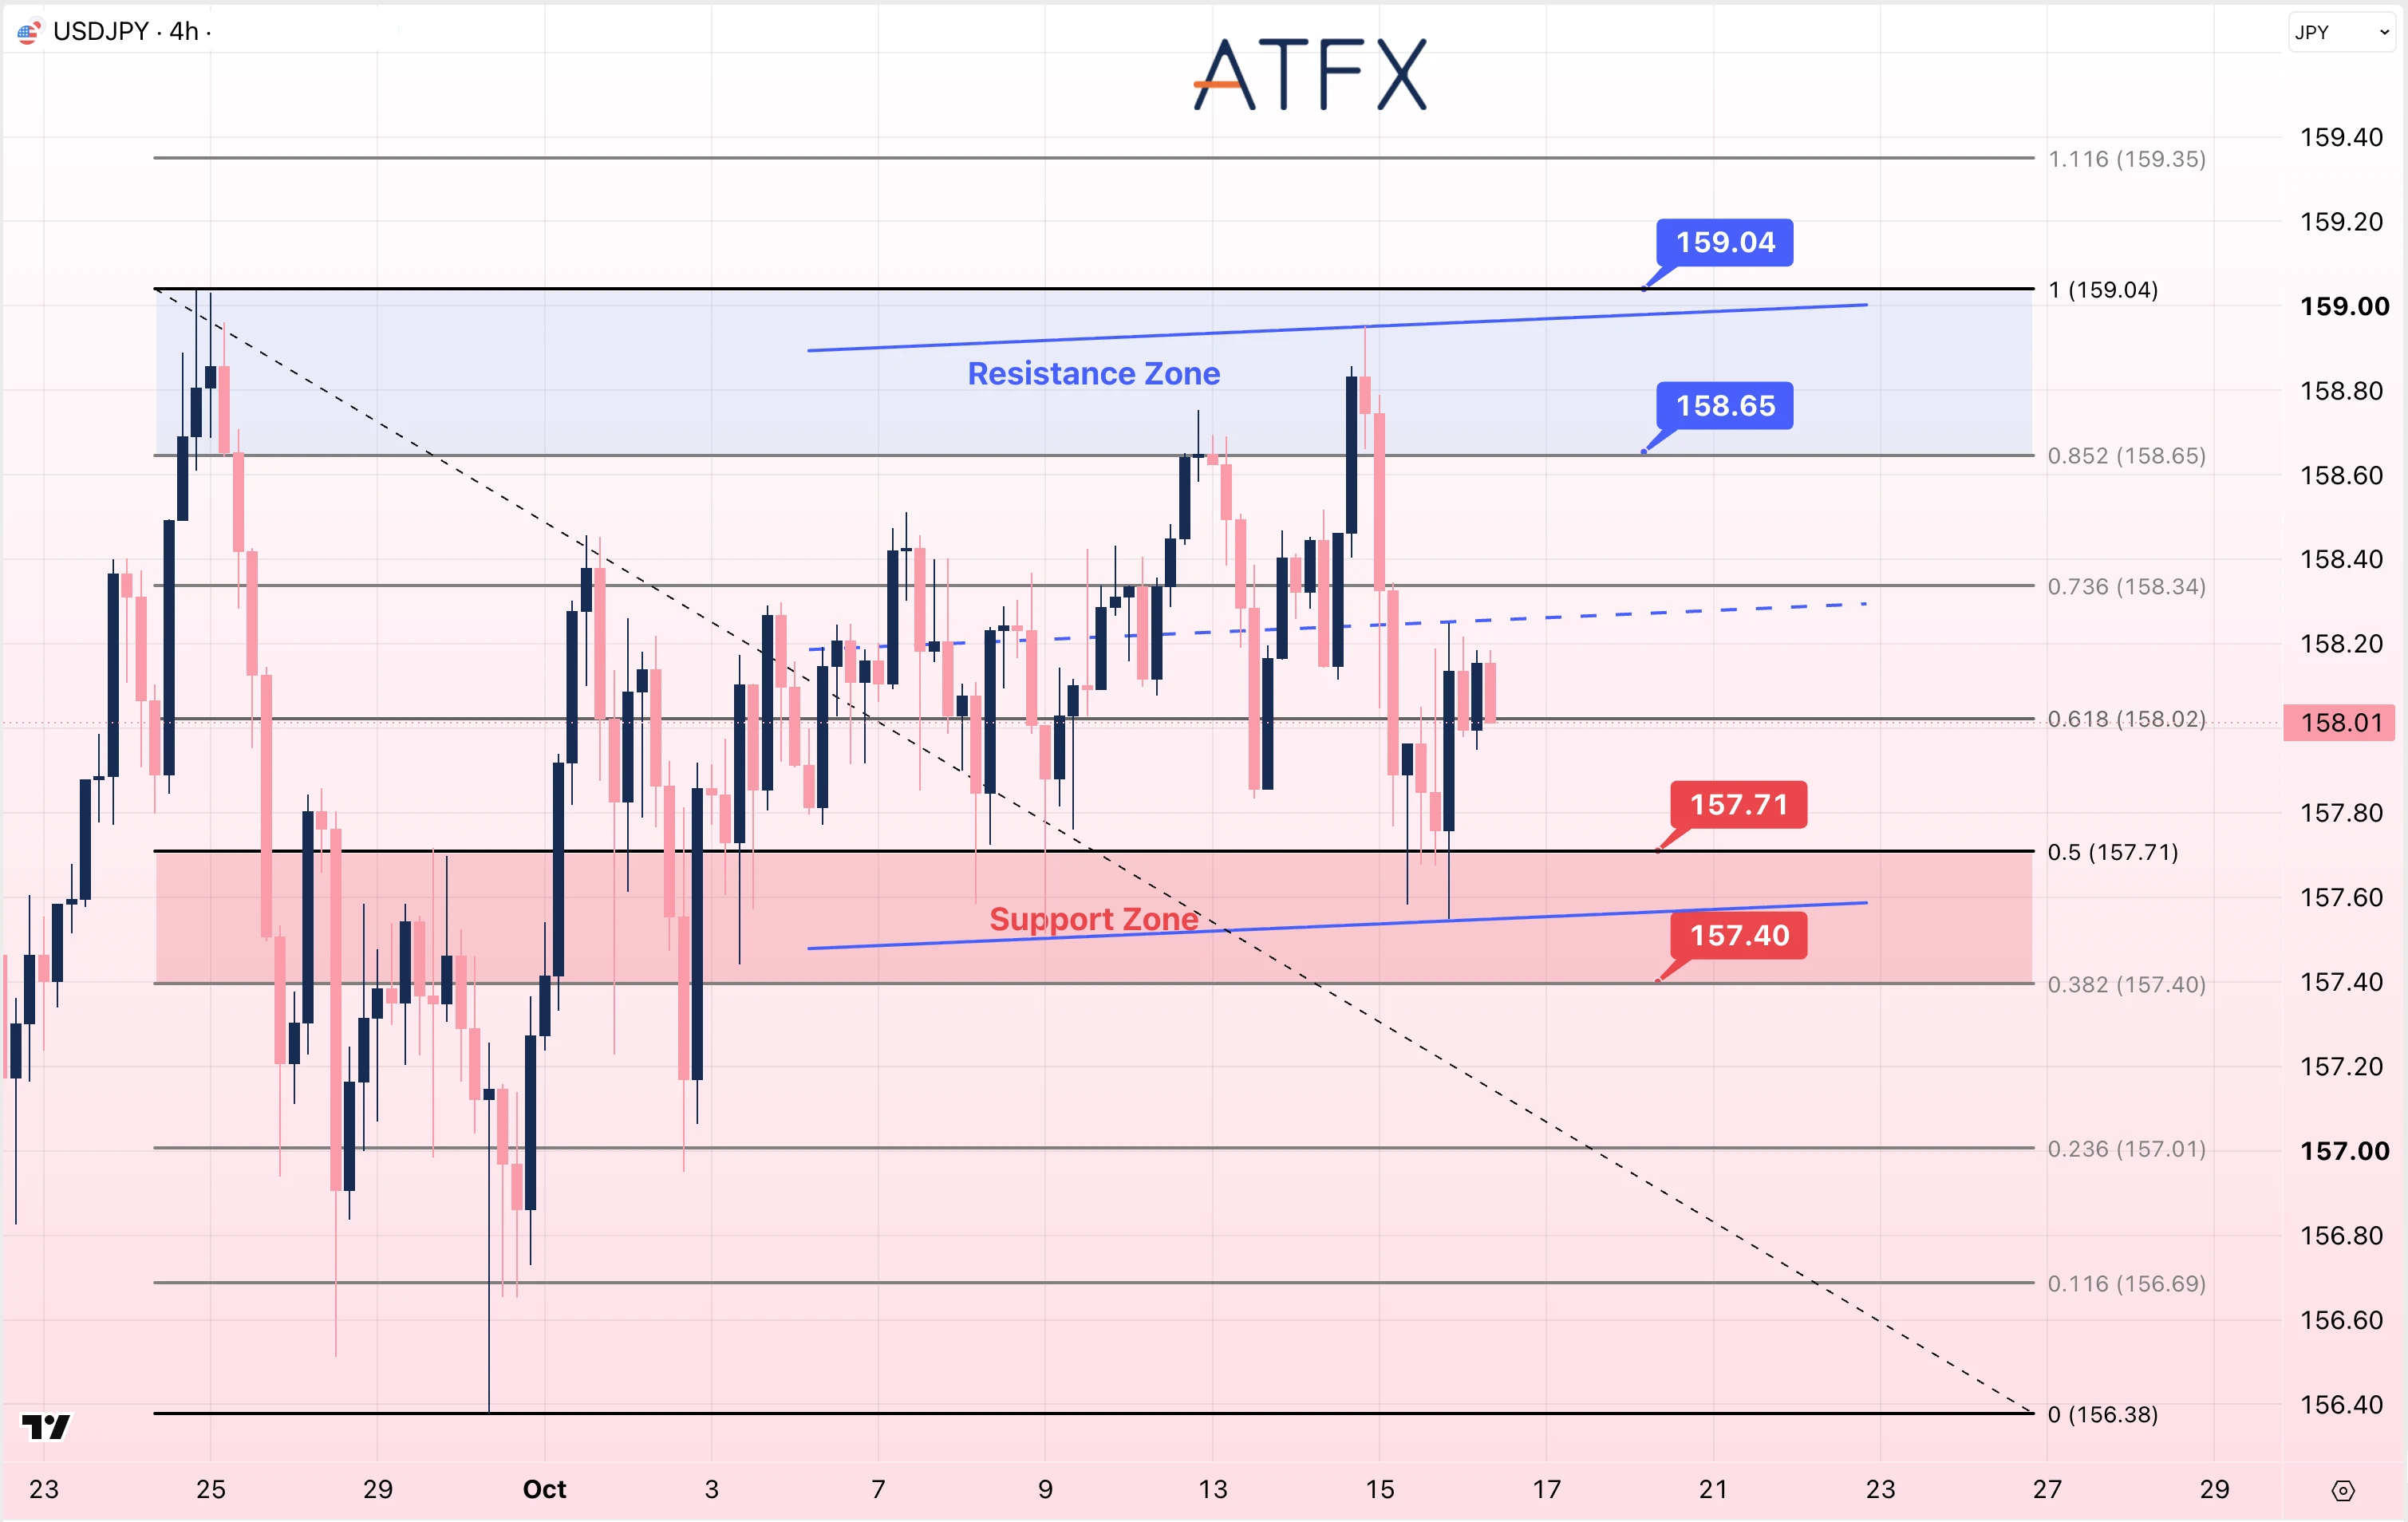
- Resistance: 158.65/159.04
- Support: 157.71/157.40
Technical Overview: USD/JPY is near 158.01 after recovering from the channel’s lower boundary around 157.55. Price remains below the gently rising channel’s midline and the 158.34 Fibonacci level. Resistance is marked at 158.65 and 159.04. A move below 157.71 would put 157.40 next among the marked support levels.
Bias: Neutral to Cautiously Bearish
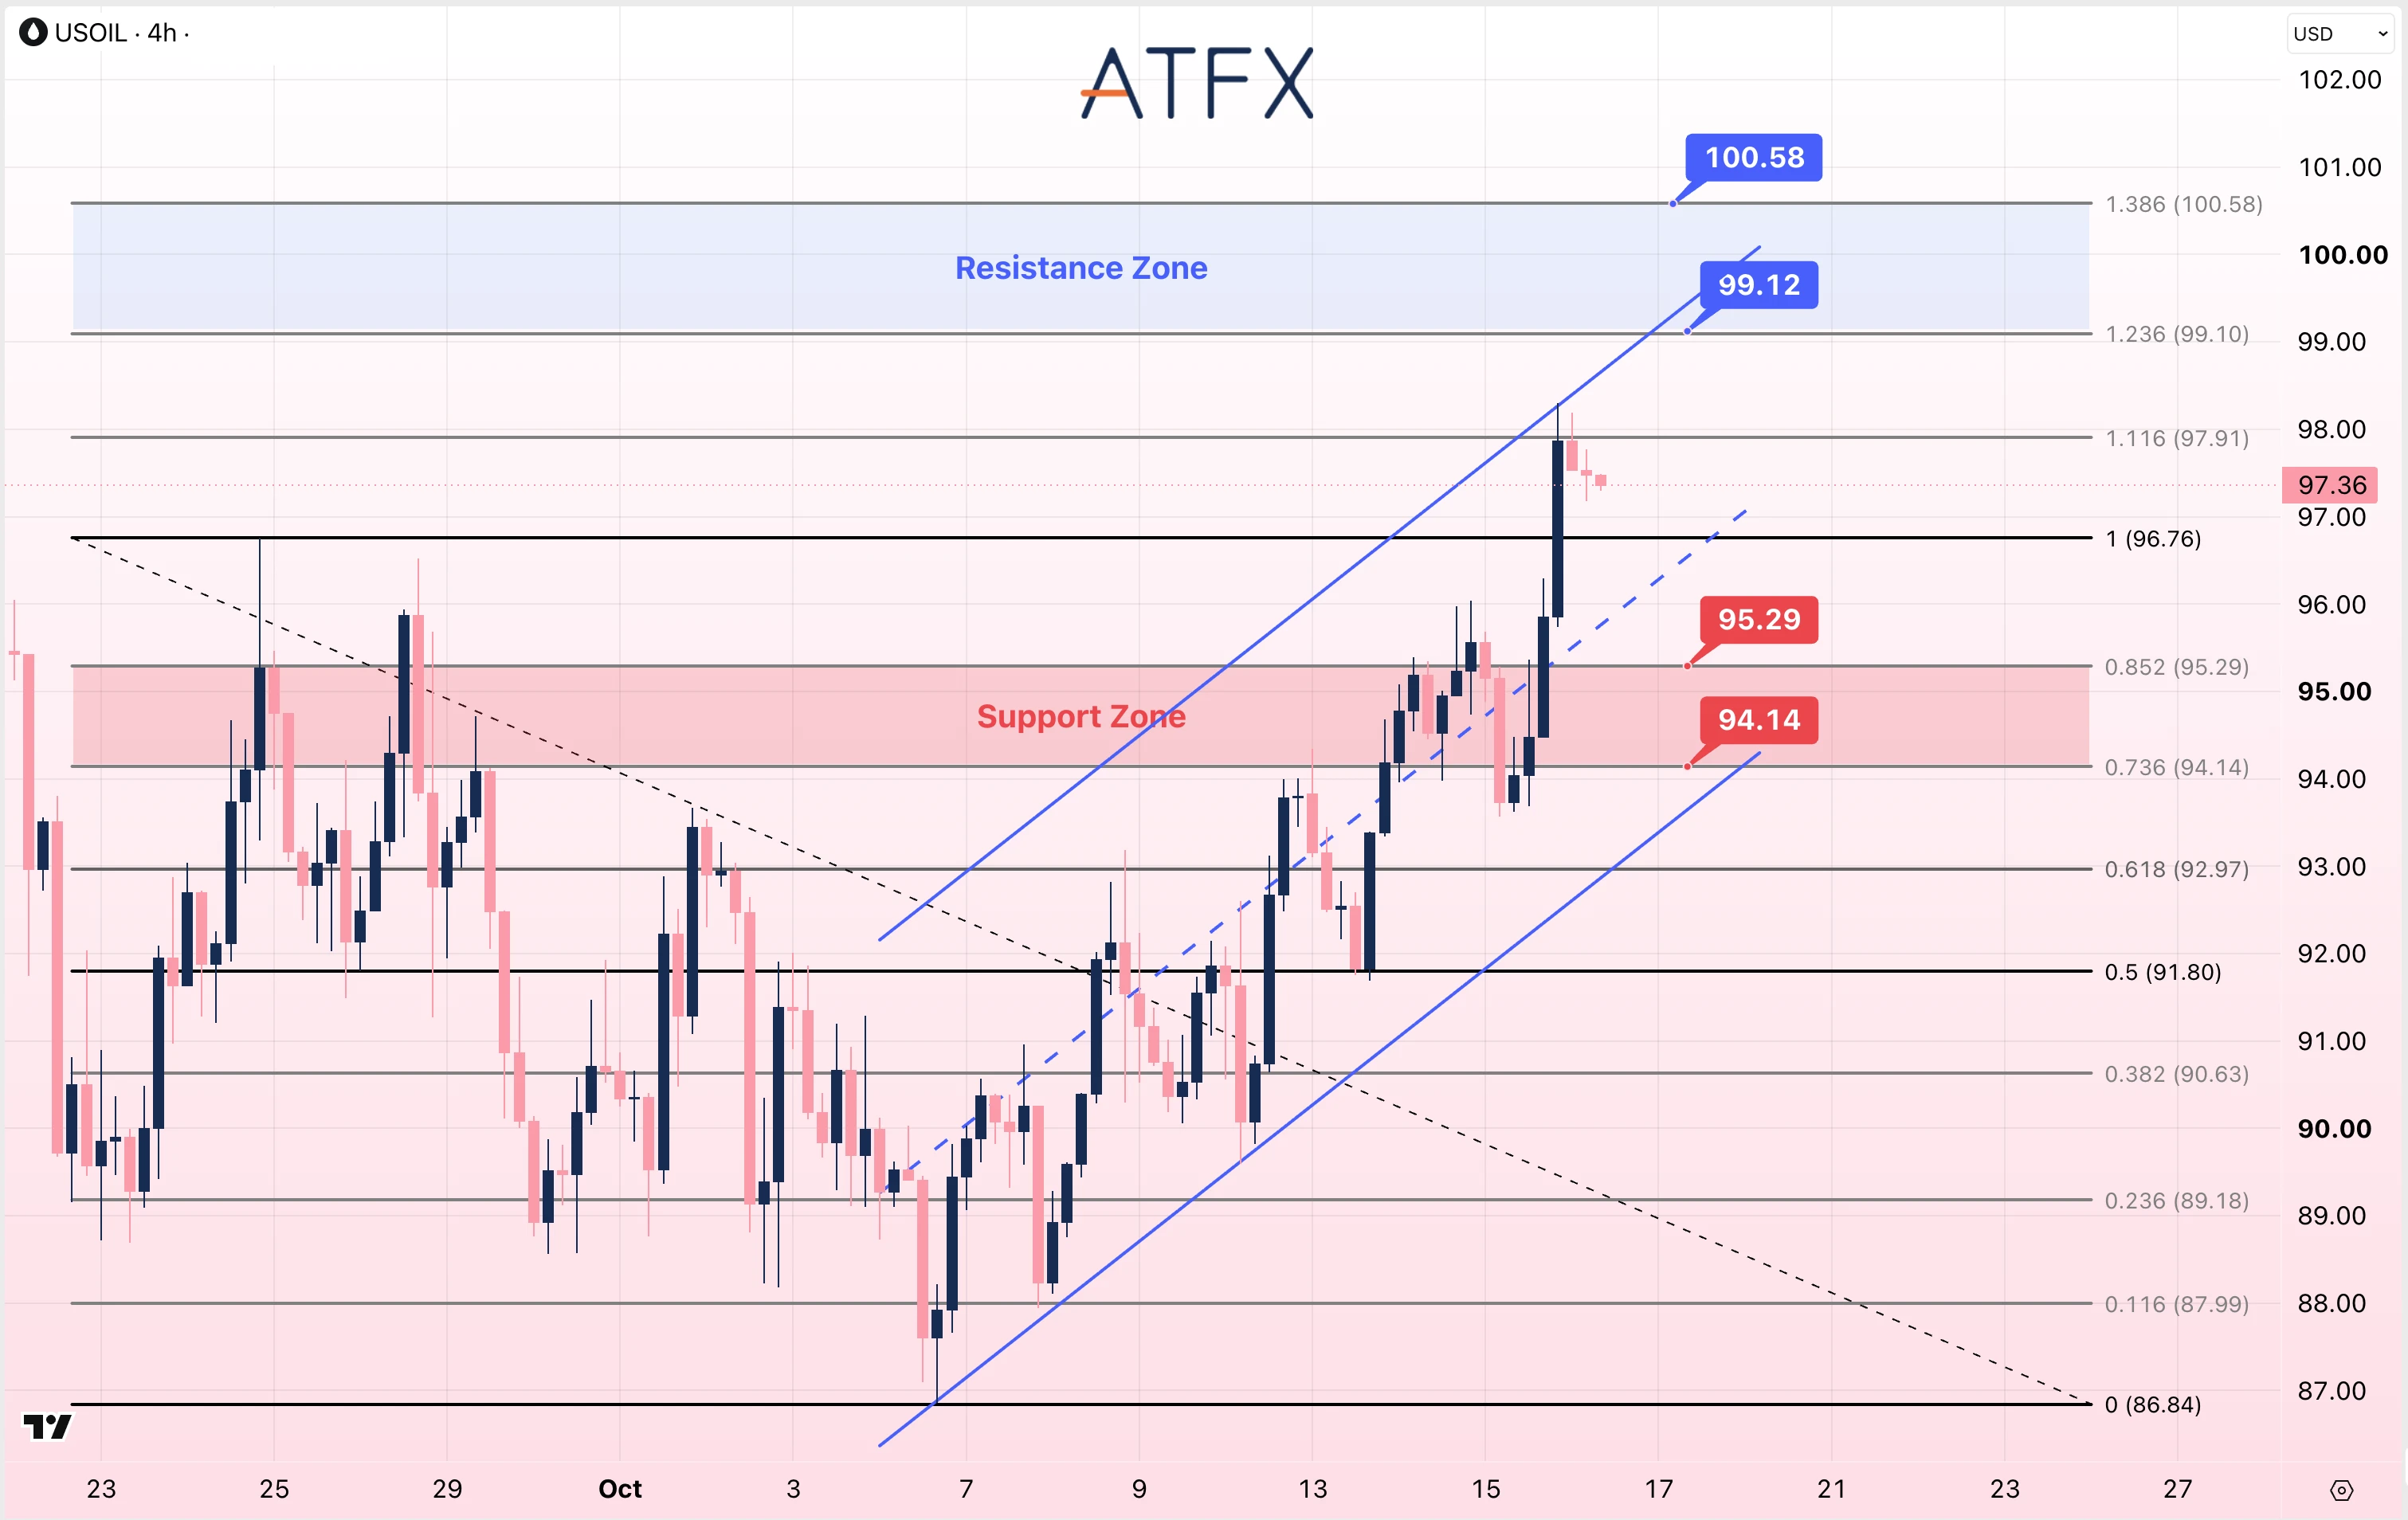
- Resistance: 99.12/100.58
- Support: 95.29/94.14
Technical Overview: USOIL is near $97.36 after moving above $96.76 and testing the $97.91 Fibonacci extension. Price remains above the midline of the rising channel. The marked resistance levels are $99.12 and $100.58. A move back below $96.76 would return price below the previous high, with the next marked support at $95.29, followed by $94.14.
Bias: Cautiously Bullish
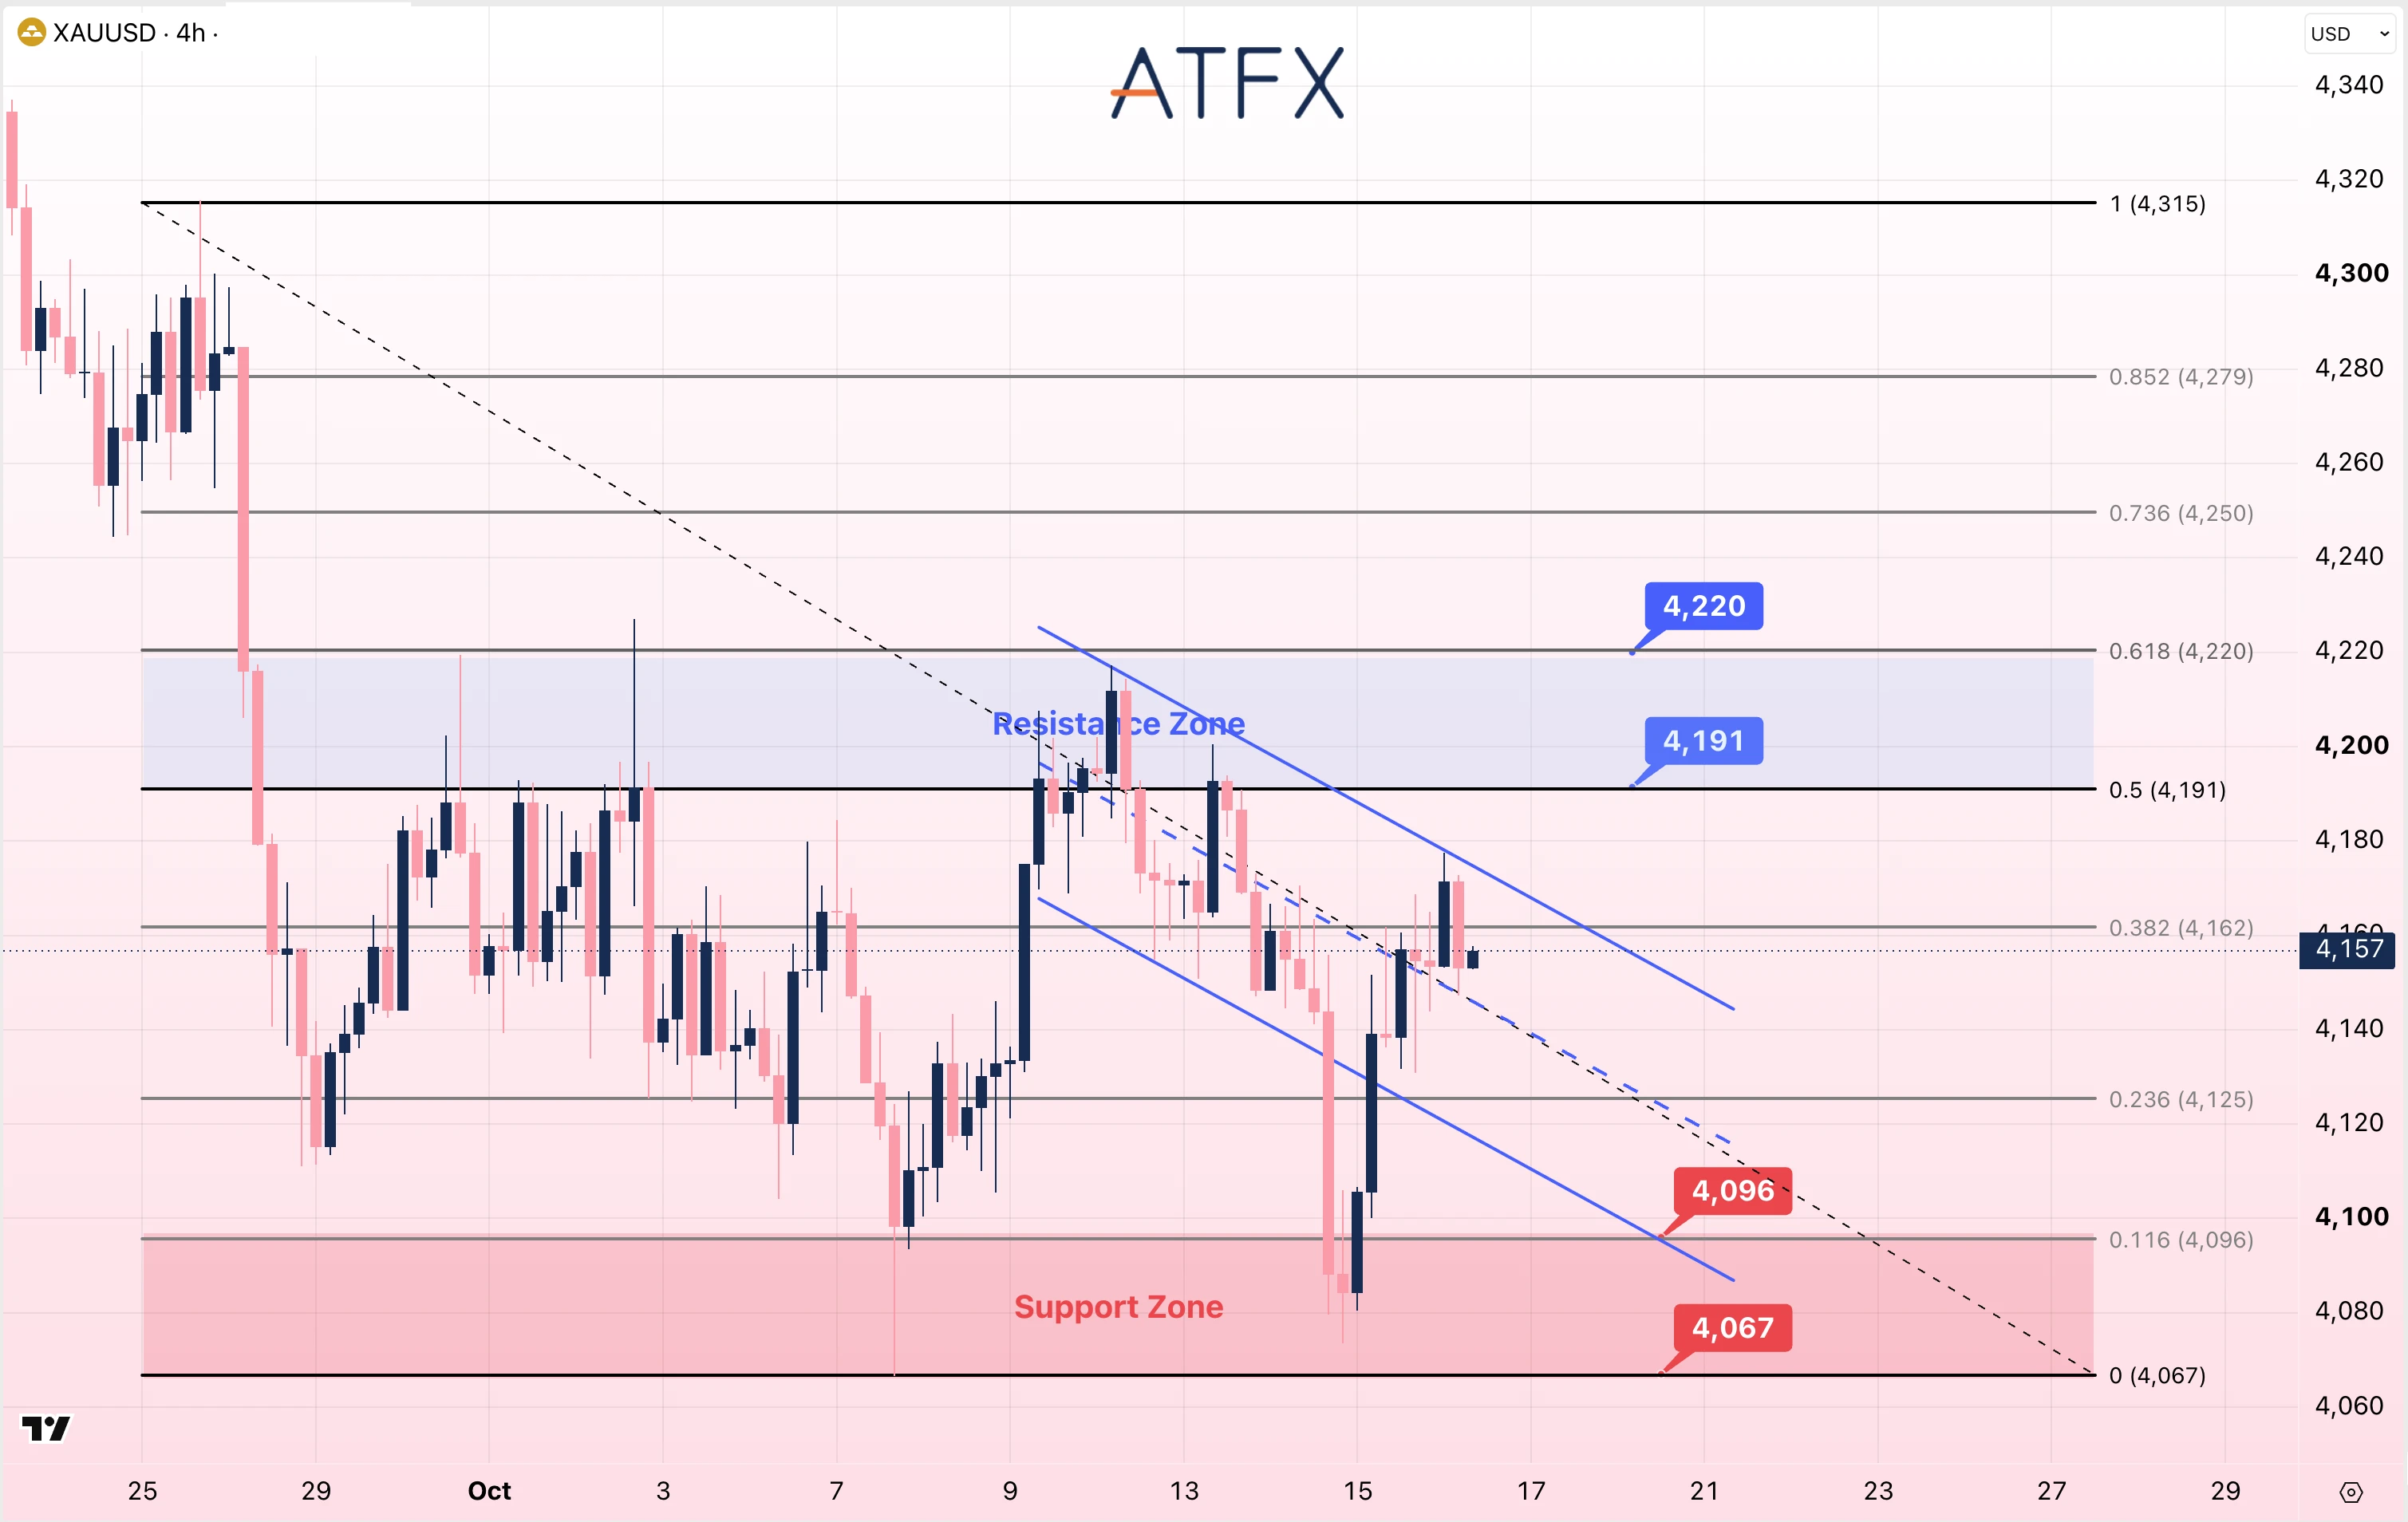
- Resistance: 4191/4220
- Support: 4096/4067
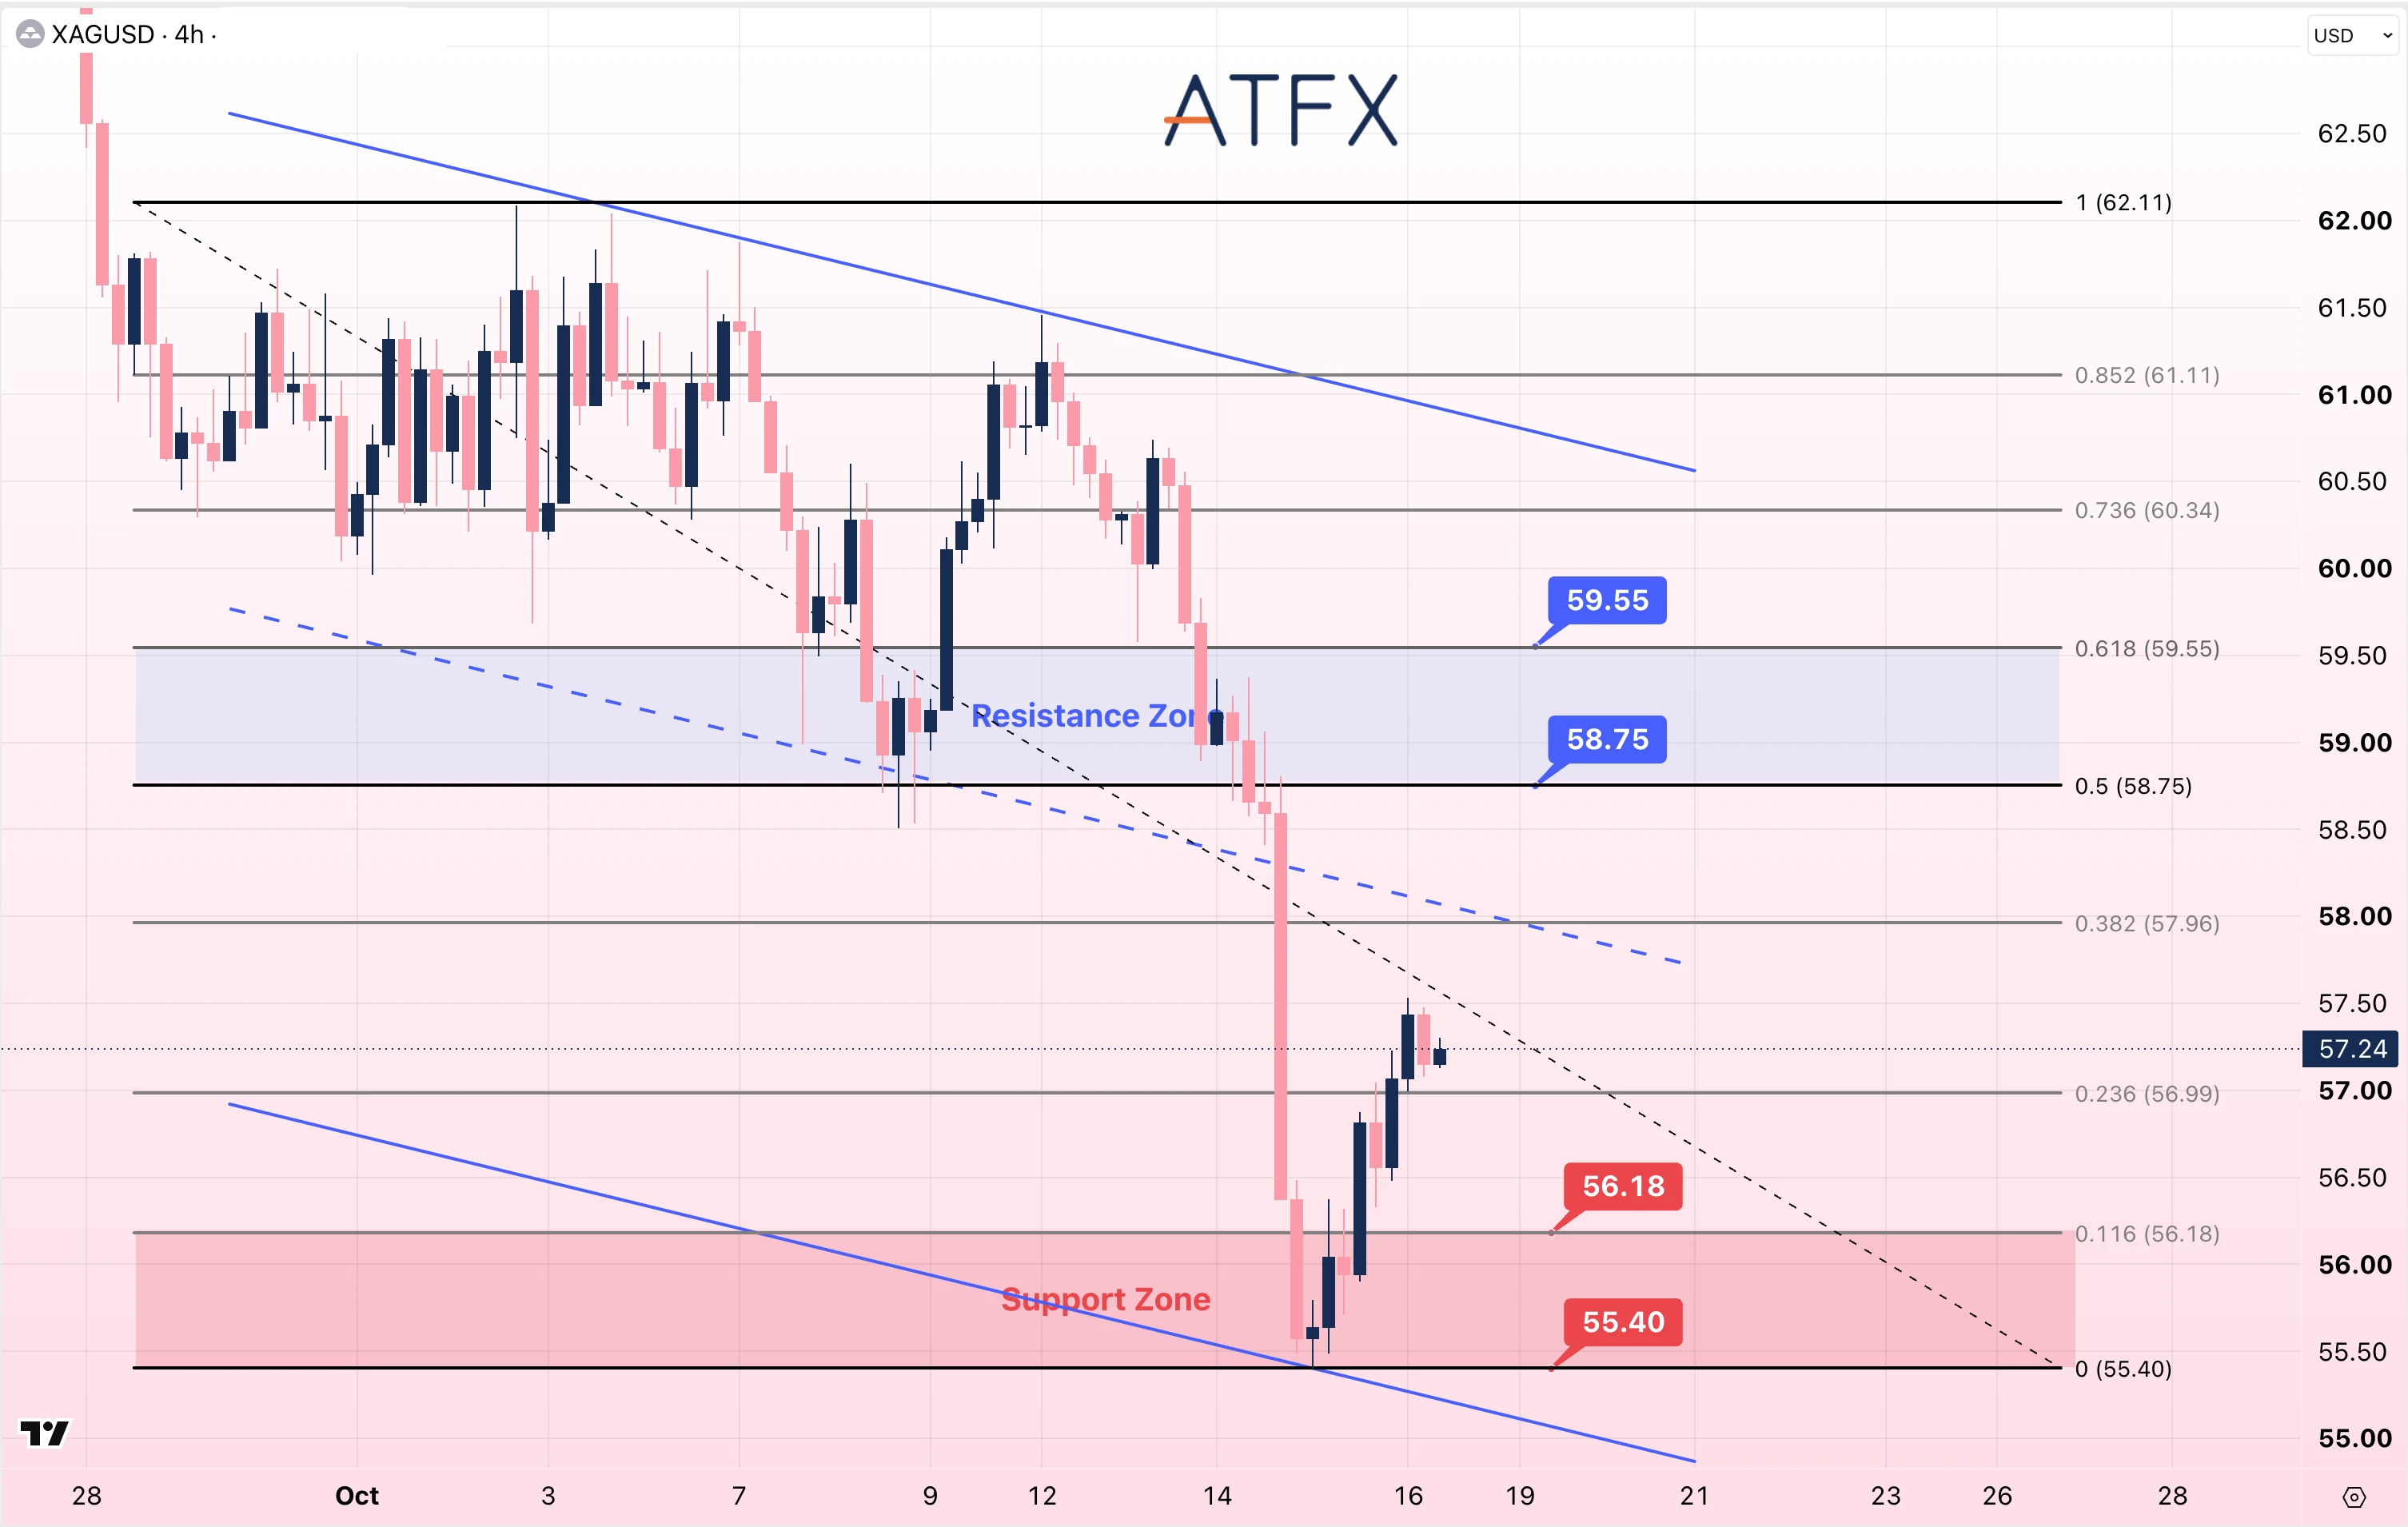
- Resistance: 58.75/59.55
- Support: 56.18/55.40
Technical Overview: Gold is near $4,157 after rebounding from around $4,080 and then pulling back from the $4,170 area. Price is above the descending channel’s midline but below the $4,162 Fibonacci level. Resistance is marked at $4,191/$4,220; $4,125 is an intermediate level before the $4,096/$4,067 support zone.
Silver is near $57.24 after rebounding from $55.40. It remains below the descending channel’s midline and the $57.96 Fibonacci level. Resistance is marked at $58.75/$59.55, with support at $56.18/$55.40.
Bias: Gold Neutral; Silver Cautiously Bearish
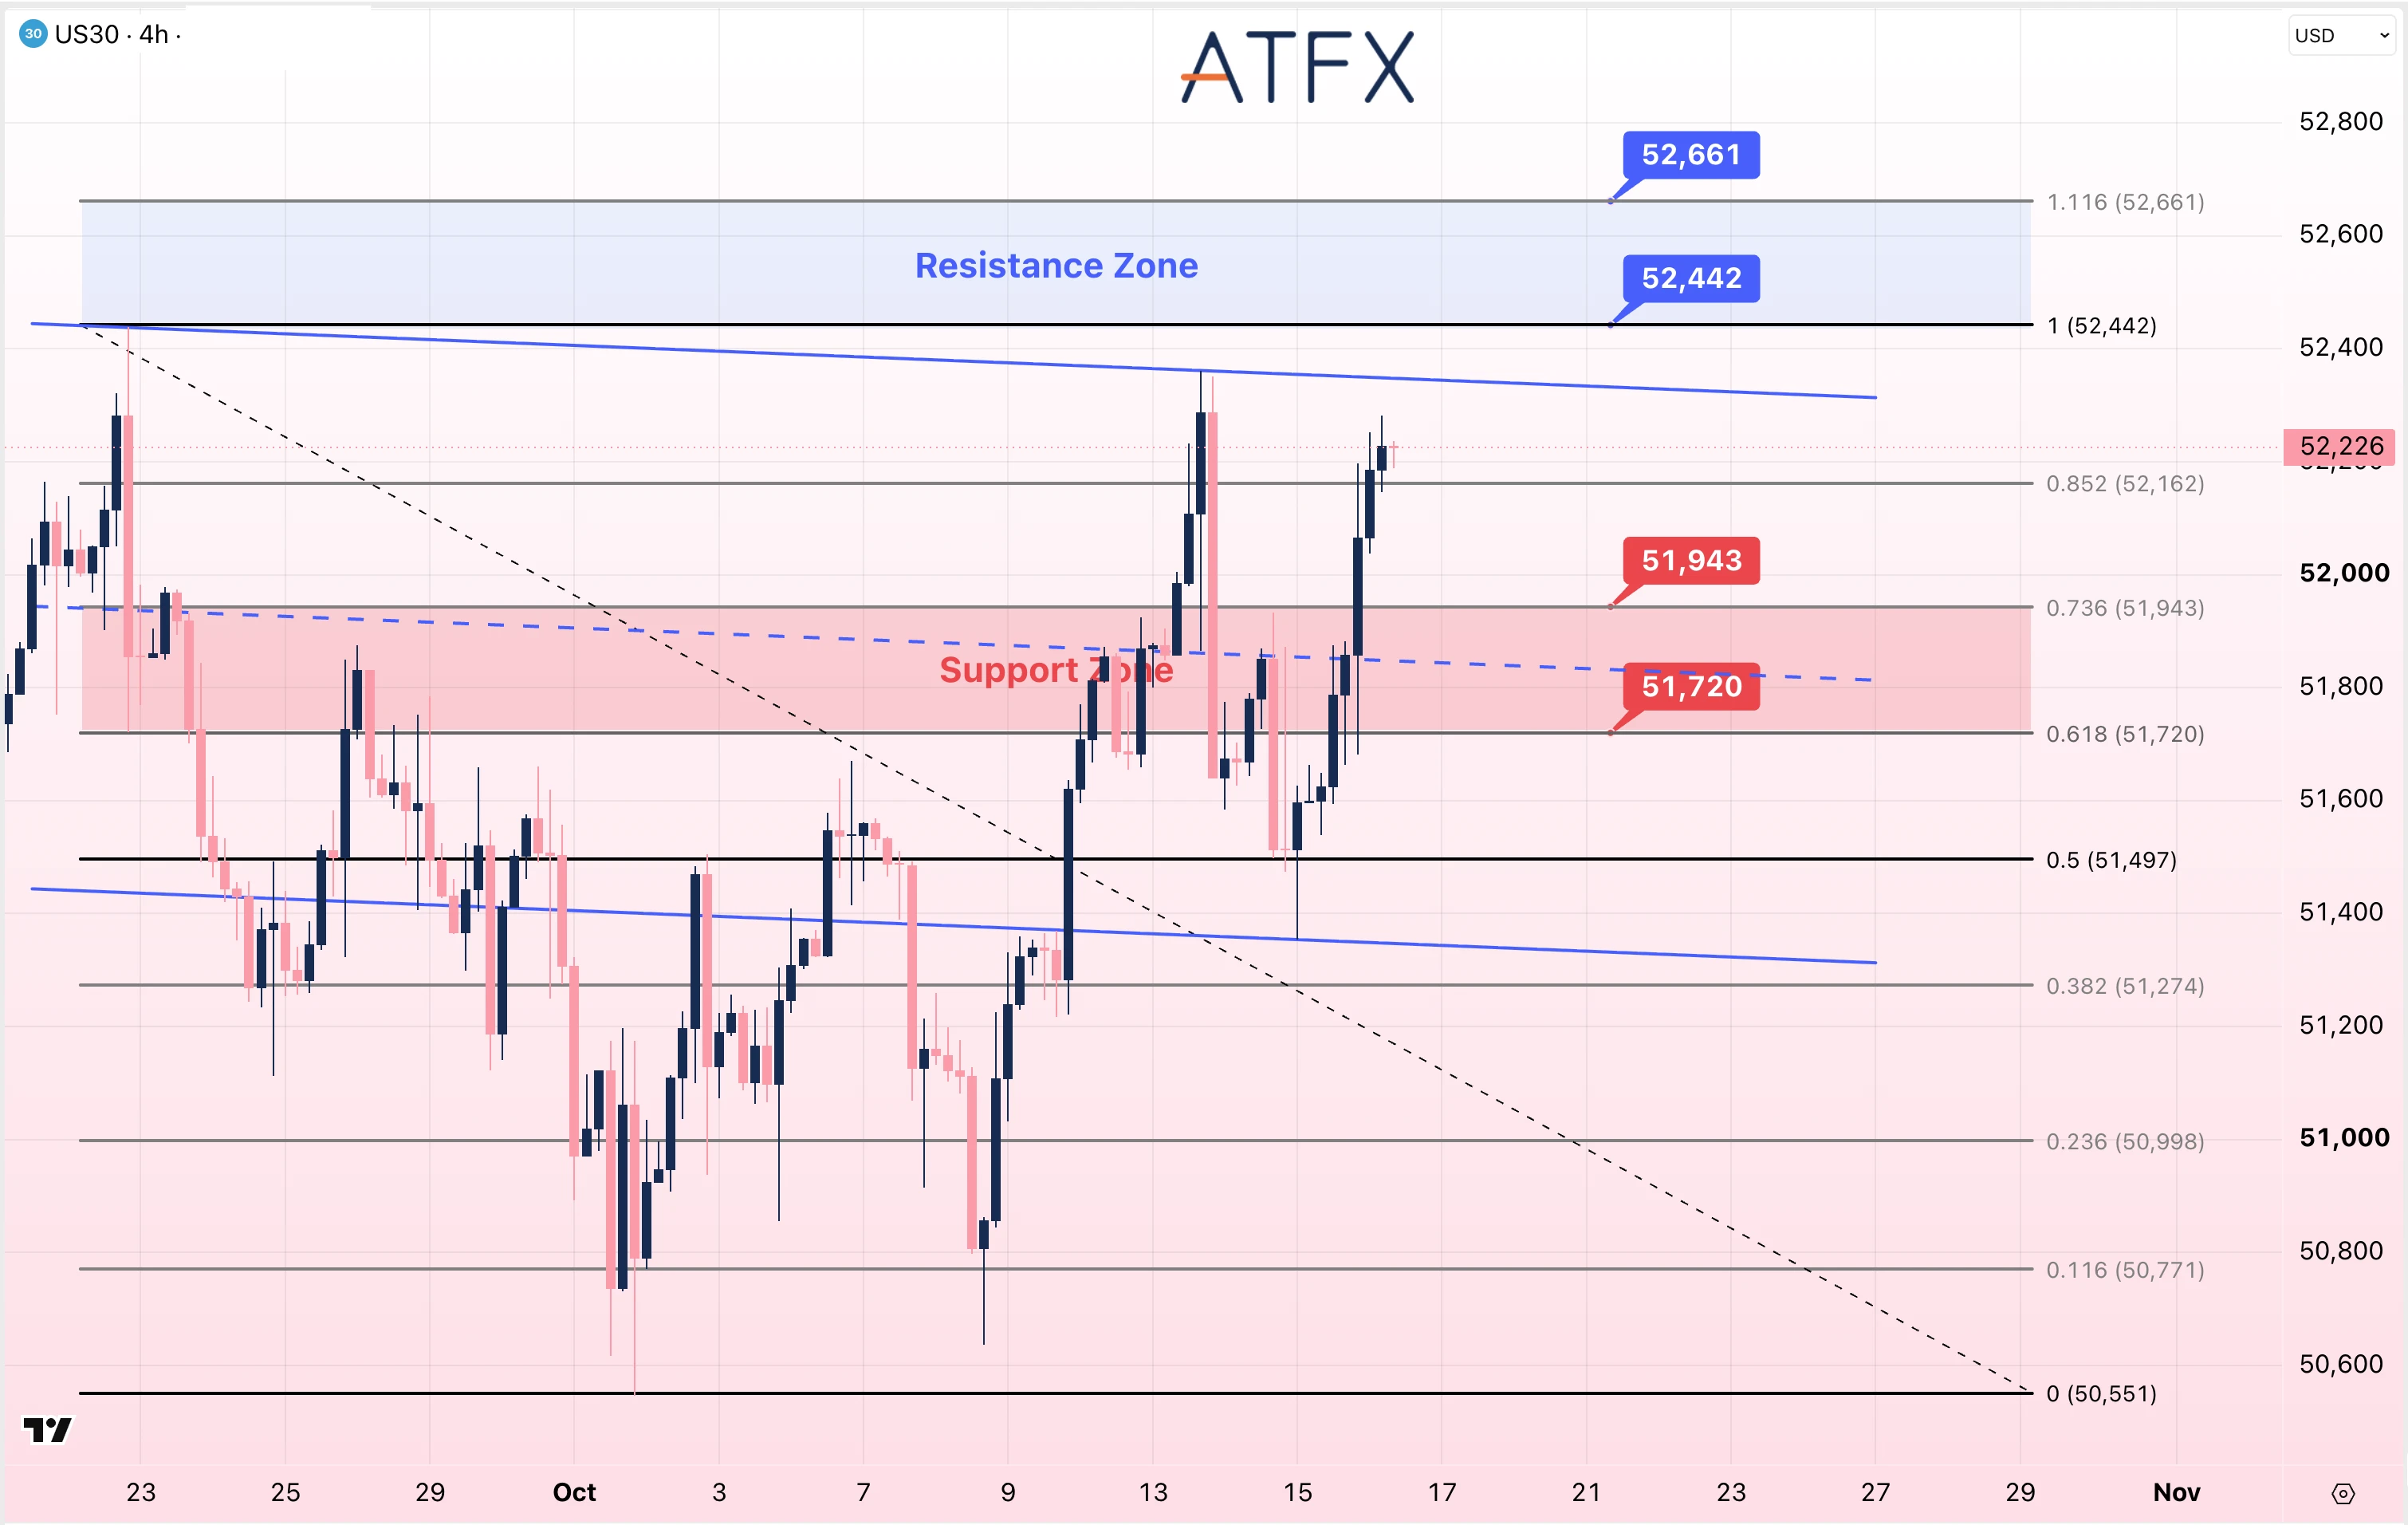
- Resistance: 52442/52661
- Support: 51943/51720
Technical Overview: US30 is near 52,226 after advancing above the 52,162 Fibonacci level. Price is above the midline of the slightly descending channel and approaching its upper boundary. A move above 52,442 would put 52,661 next among the marked resistance levels. Below 51,943, price would return to the marked support zone, which extends to 51,720.
Bias: Neutral to Cautiously Bullish
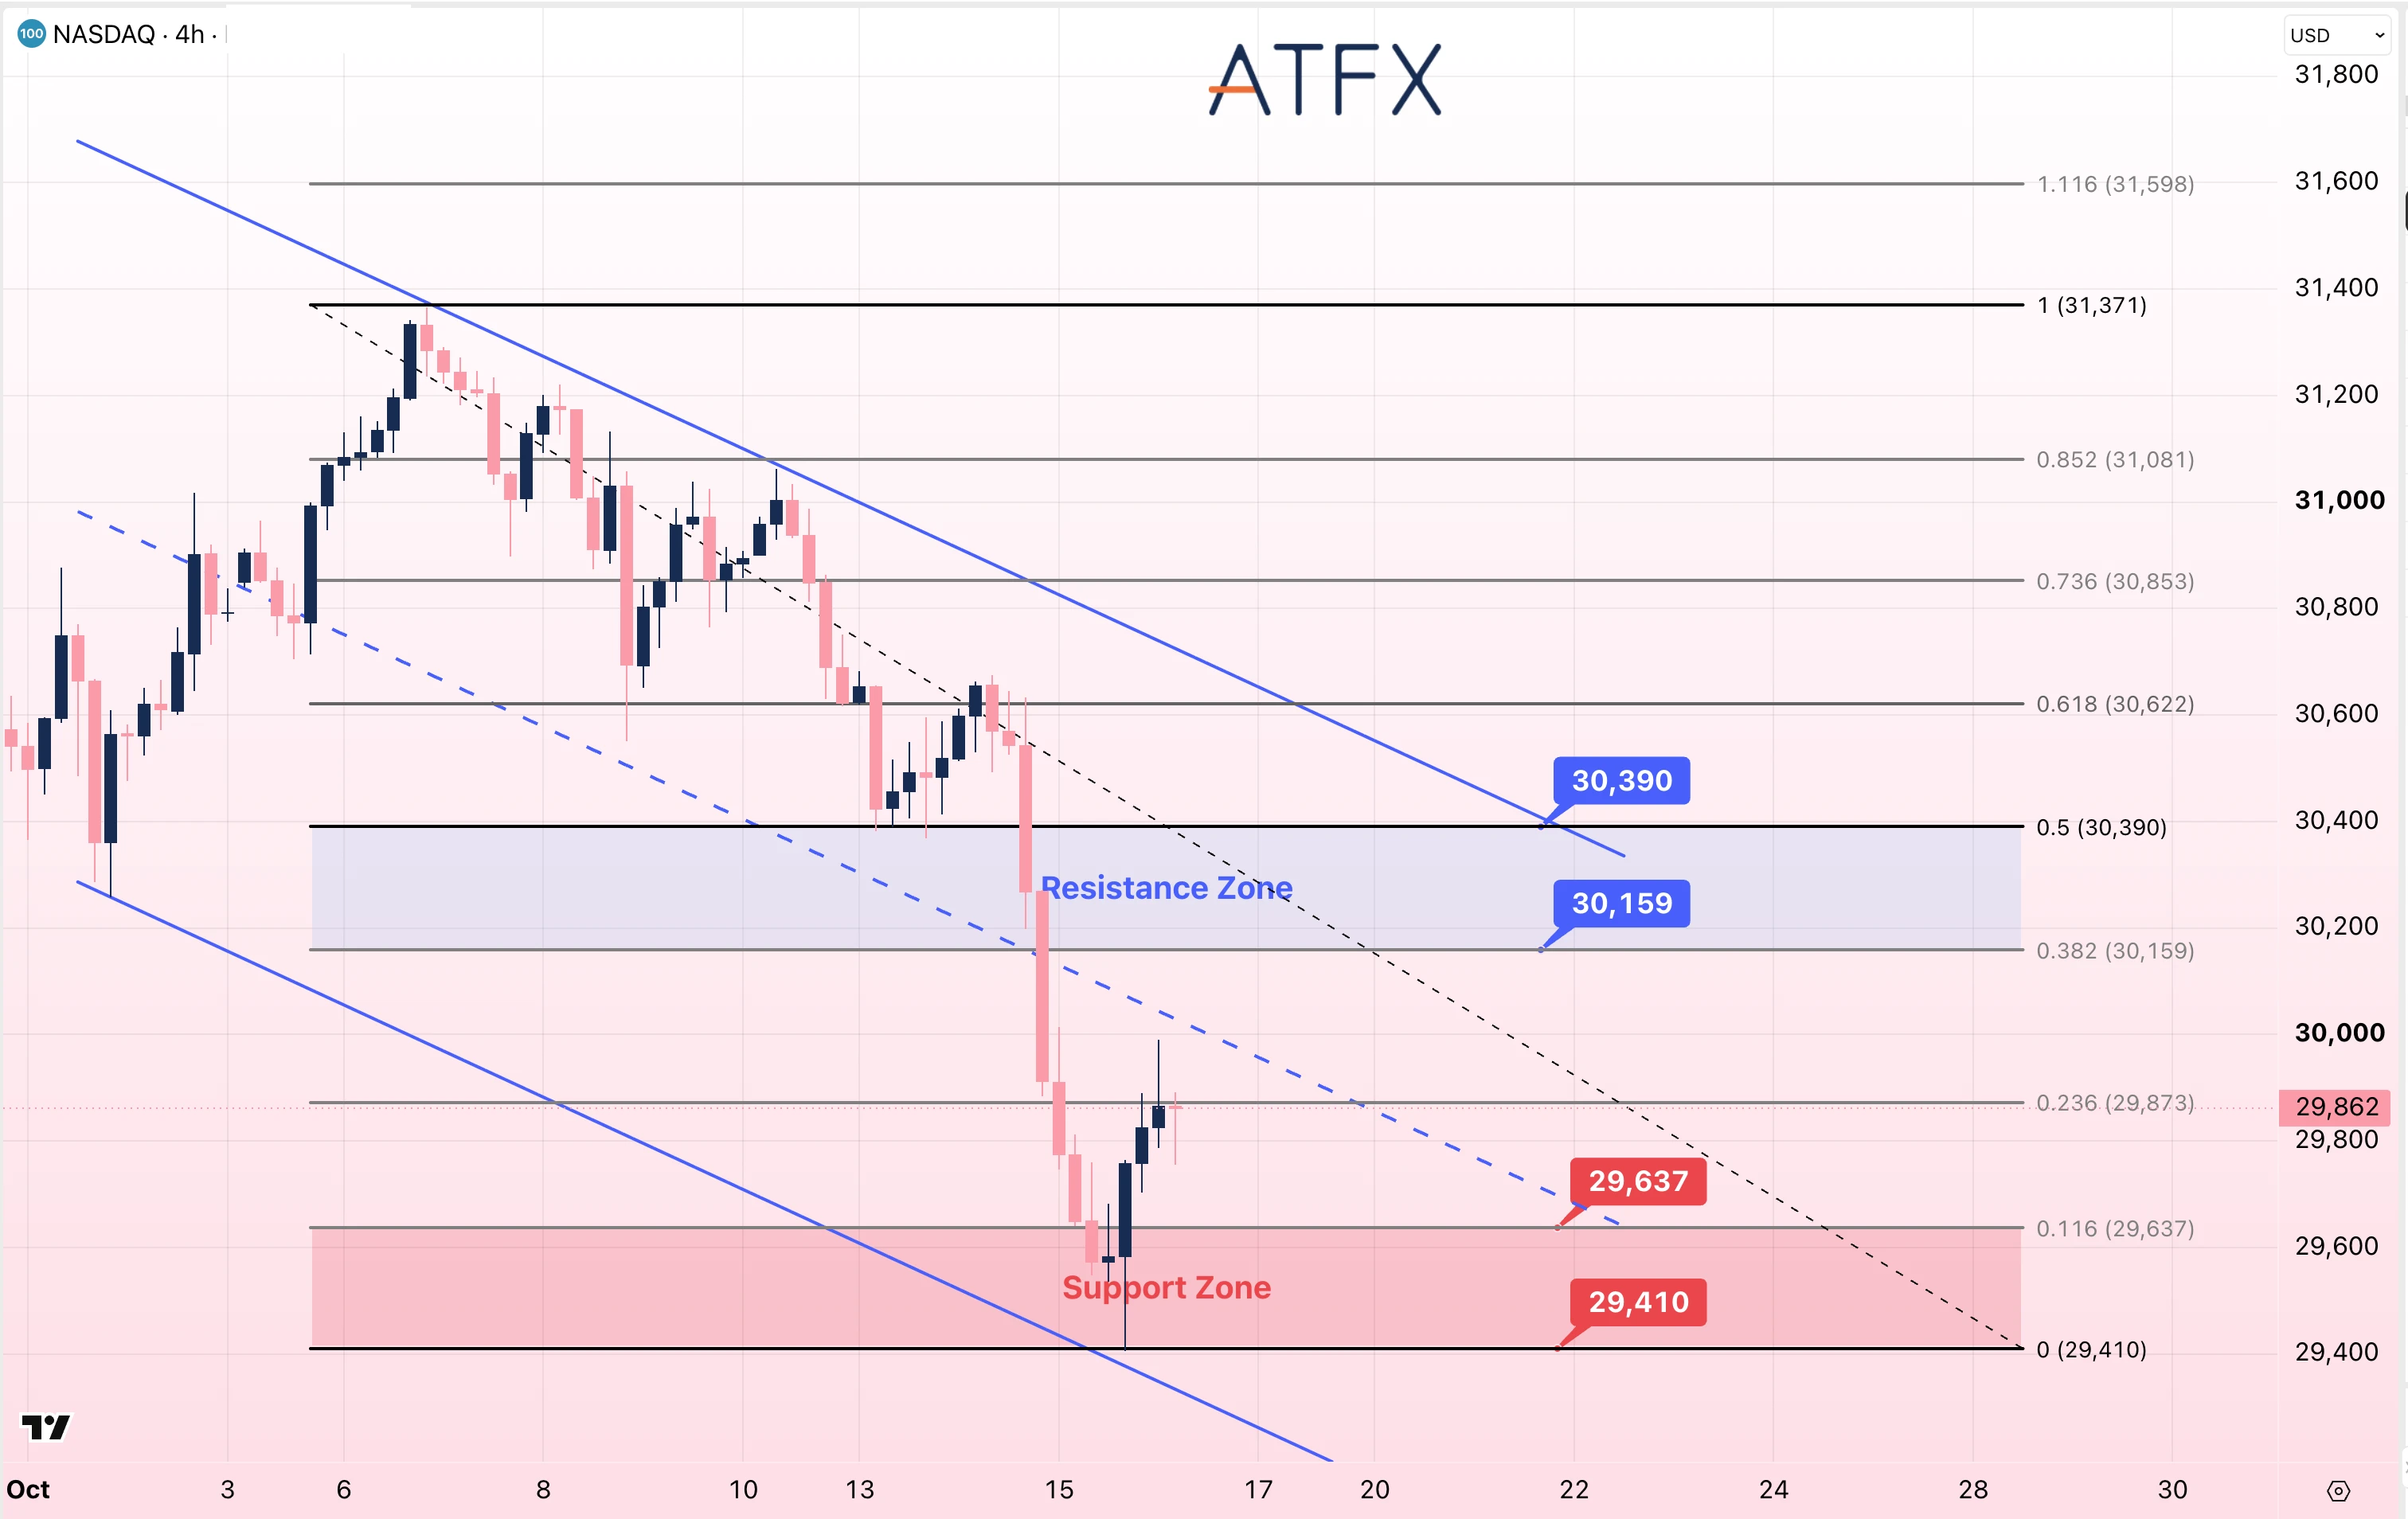
- Resistance: 30159/30390
- Support: 29637/29410
Technical Overview: NAS100 is near 29,862 after rebounding from the 29,410 area. Price remains below the 29,873 Fibonacci level and the midline of the descending channel. The marked resistance zone is 30,159–30,390. A move below 29,637 would return price to the marked support zone, with 29,410 as its lower boundary.
Bias: Cautiously Bearish
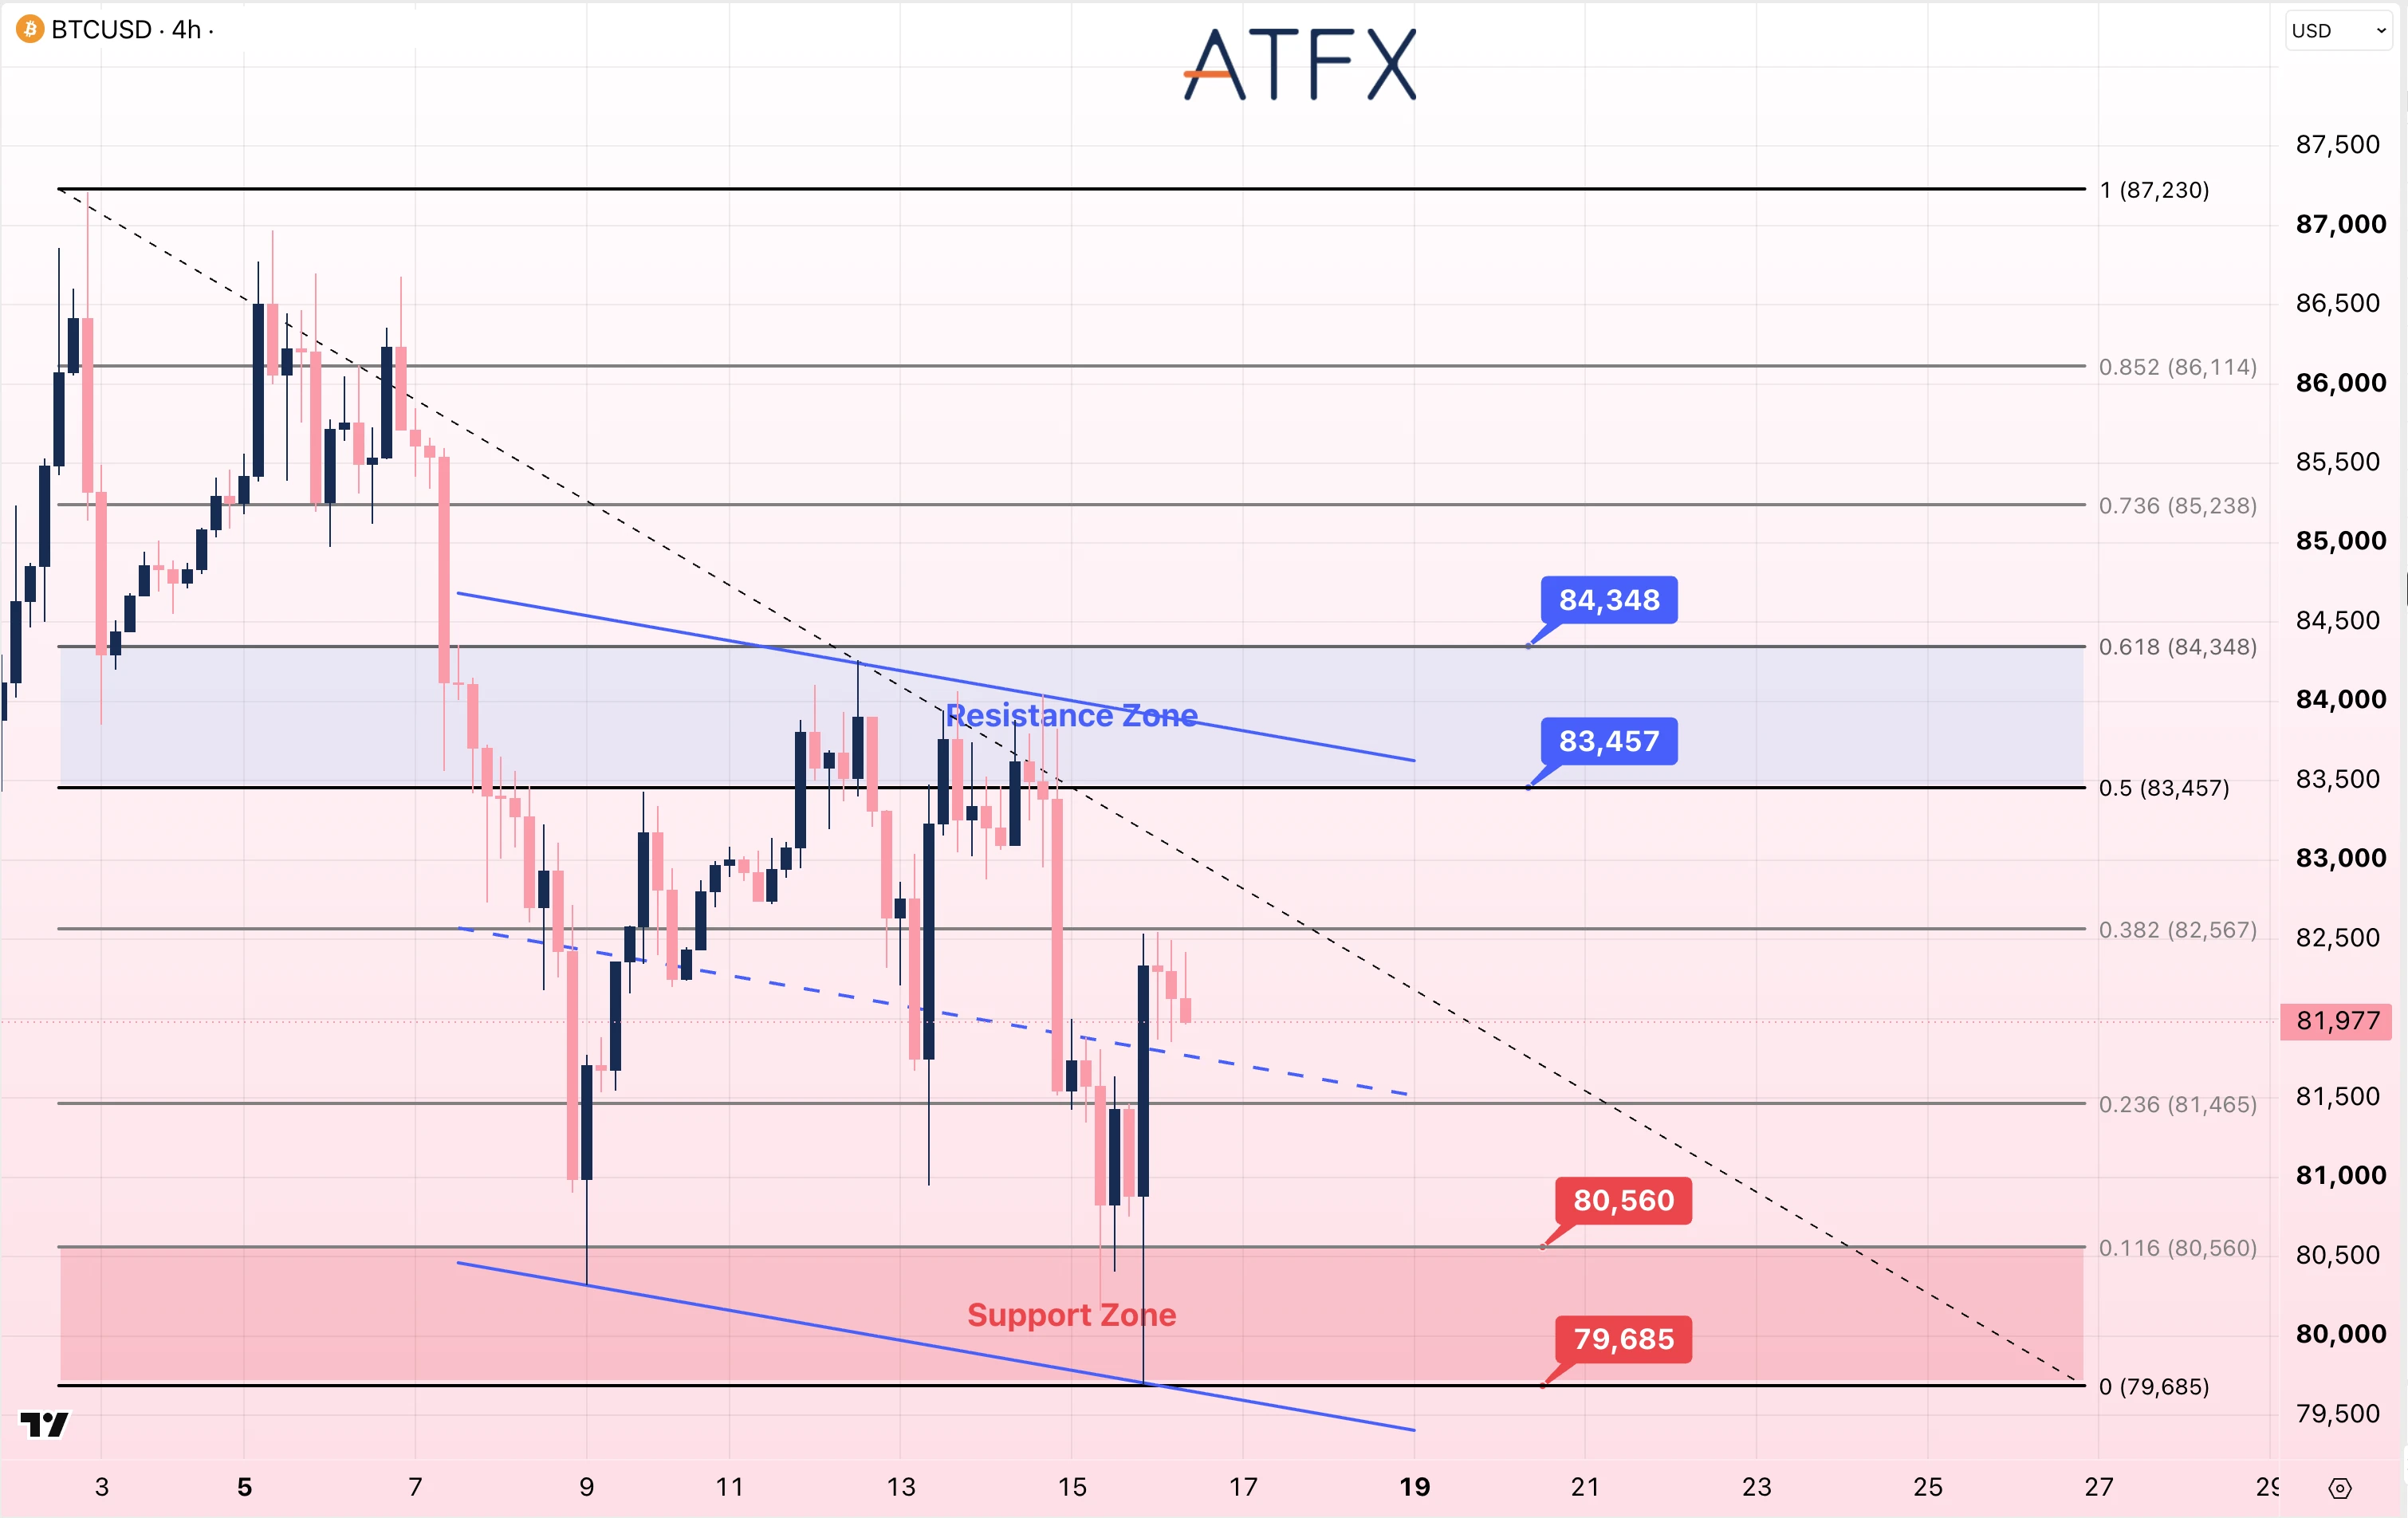
- Resistance: 83457/84348
- Support: 80560/79685
Technical Overview: Bitcoin is near $81,977 after rebounding from $79,685 toward $82,400 and then retracing. Price is just above the descending channel’s midline but below the $82,567 Fibonacci level. Resistance is marked at $83,457/$84,348. A move below $80,560 would put $79,685 next on the support list.
Bias: Neutral to Cautiously Bearish
Disclaimer: This analysis is for reference only and does not constitute investment advice.