

Key Takeaways:
Today’s Focus: U.S. August Personal Consumption Expenditures (PCE) Price Index: This release will serve as the principal input for market expectations regarding the Federal Reserve’s October policy decision. Consensus anticipates a 0.3% monthly increase in core PCE (prior: 0.2%) and a stable year-over-year reading of 3.3%. U.S. ADP Employment Report (Private Sector Payrolls): Forecast to rise by 70,000 (prior: 38,000). These two data points are expected to serve as primary catalysts for a marked increase in market volatility. |
Global Market Review 30/09/2026
- U.S. equity indices registered modest declines, with the Dow Jones Industrial Average down 0.25%, the S&P 500 down 0.16%, and the Nasdaq down 0.09%.
- Spot gold advanced over 1%, recovering from a seven-week low in the previous session.
- Persistent inflationary pressures reinforced expectations for continued Federal Reserve tightening, heightening market sensitivity to the forthcoming PCE price data.
- Meanwhile, indications of recovering Middle Eastern crude oil exports contributed to a decline of over 4% in WTI crude oil prices.
- Reminder: Due to the holiday, ATFX daily commentary will not be updated on October 1; normal updates will resume on October 2.
Important Economic Calendar
| Time (GMT+8) | Event | Importance |
|---|---|---|
| 09:30 | AU CPI YoY AUG | ** |
| 09:30 | CN NBS Manufacturing PMI SEP | ** |
| 09:30 | CN NBS Non-Manufacturing PMI SEP | ** |
| 14:00 | UK GDP QoQ Final Q2 | ** |
| 15:55 | EU GERMANY Unemployment Rate SEP | ** |
| 20:00 | EU GERMANY CPI YoY Prel SEP | *** |
| 20:15 | US ADP Employment Change SEP | *** |
| 20:30 | US GDP Growth Rate QoQ Final Q2 | *** |
| 20:30 | US Core PCE Price Index YoY AUG | *** |
| 22:30 | EIA Crude Oil Stocks Change | ** |
Key Events on October 1 (GMT+8)
| Time (GMT+8) | Event | Importance |
|---|---|---|
| China, Hong Kong Holiday | ||
| 08:30 | JP Manufacturing PMI Final SEP | ** |
| 15:55 | EU GERMANY Manufacturing PMI Final SEP | ** |
| 16:00 | BoE Gov Bailey Speaks | *** |
| 16:00 | EU Manufacturing PMI Final SEP | ** |
| 16:30 | GB Manufacturing PMI Final SEP | ** |
| 17:00 | EU Unemployment Rate AUG | ** |
| 20:30 | US Initial Jobless Claims | *** |
| 21:45 | US Manufacturing PMI Final SEP | ** |
| 22:00 | US ISM Manufacturing PMI SEP | *** |
| 22:00 | US Construction Spending AUG | ** |
Markets Analysis 30/09/2026
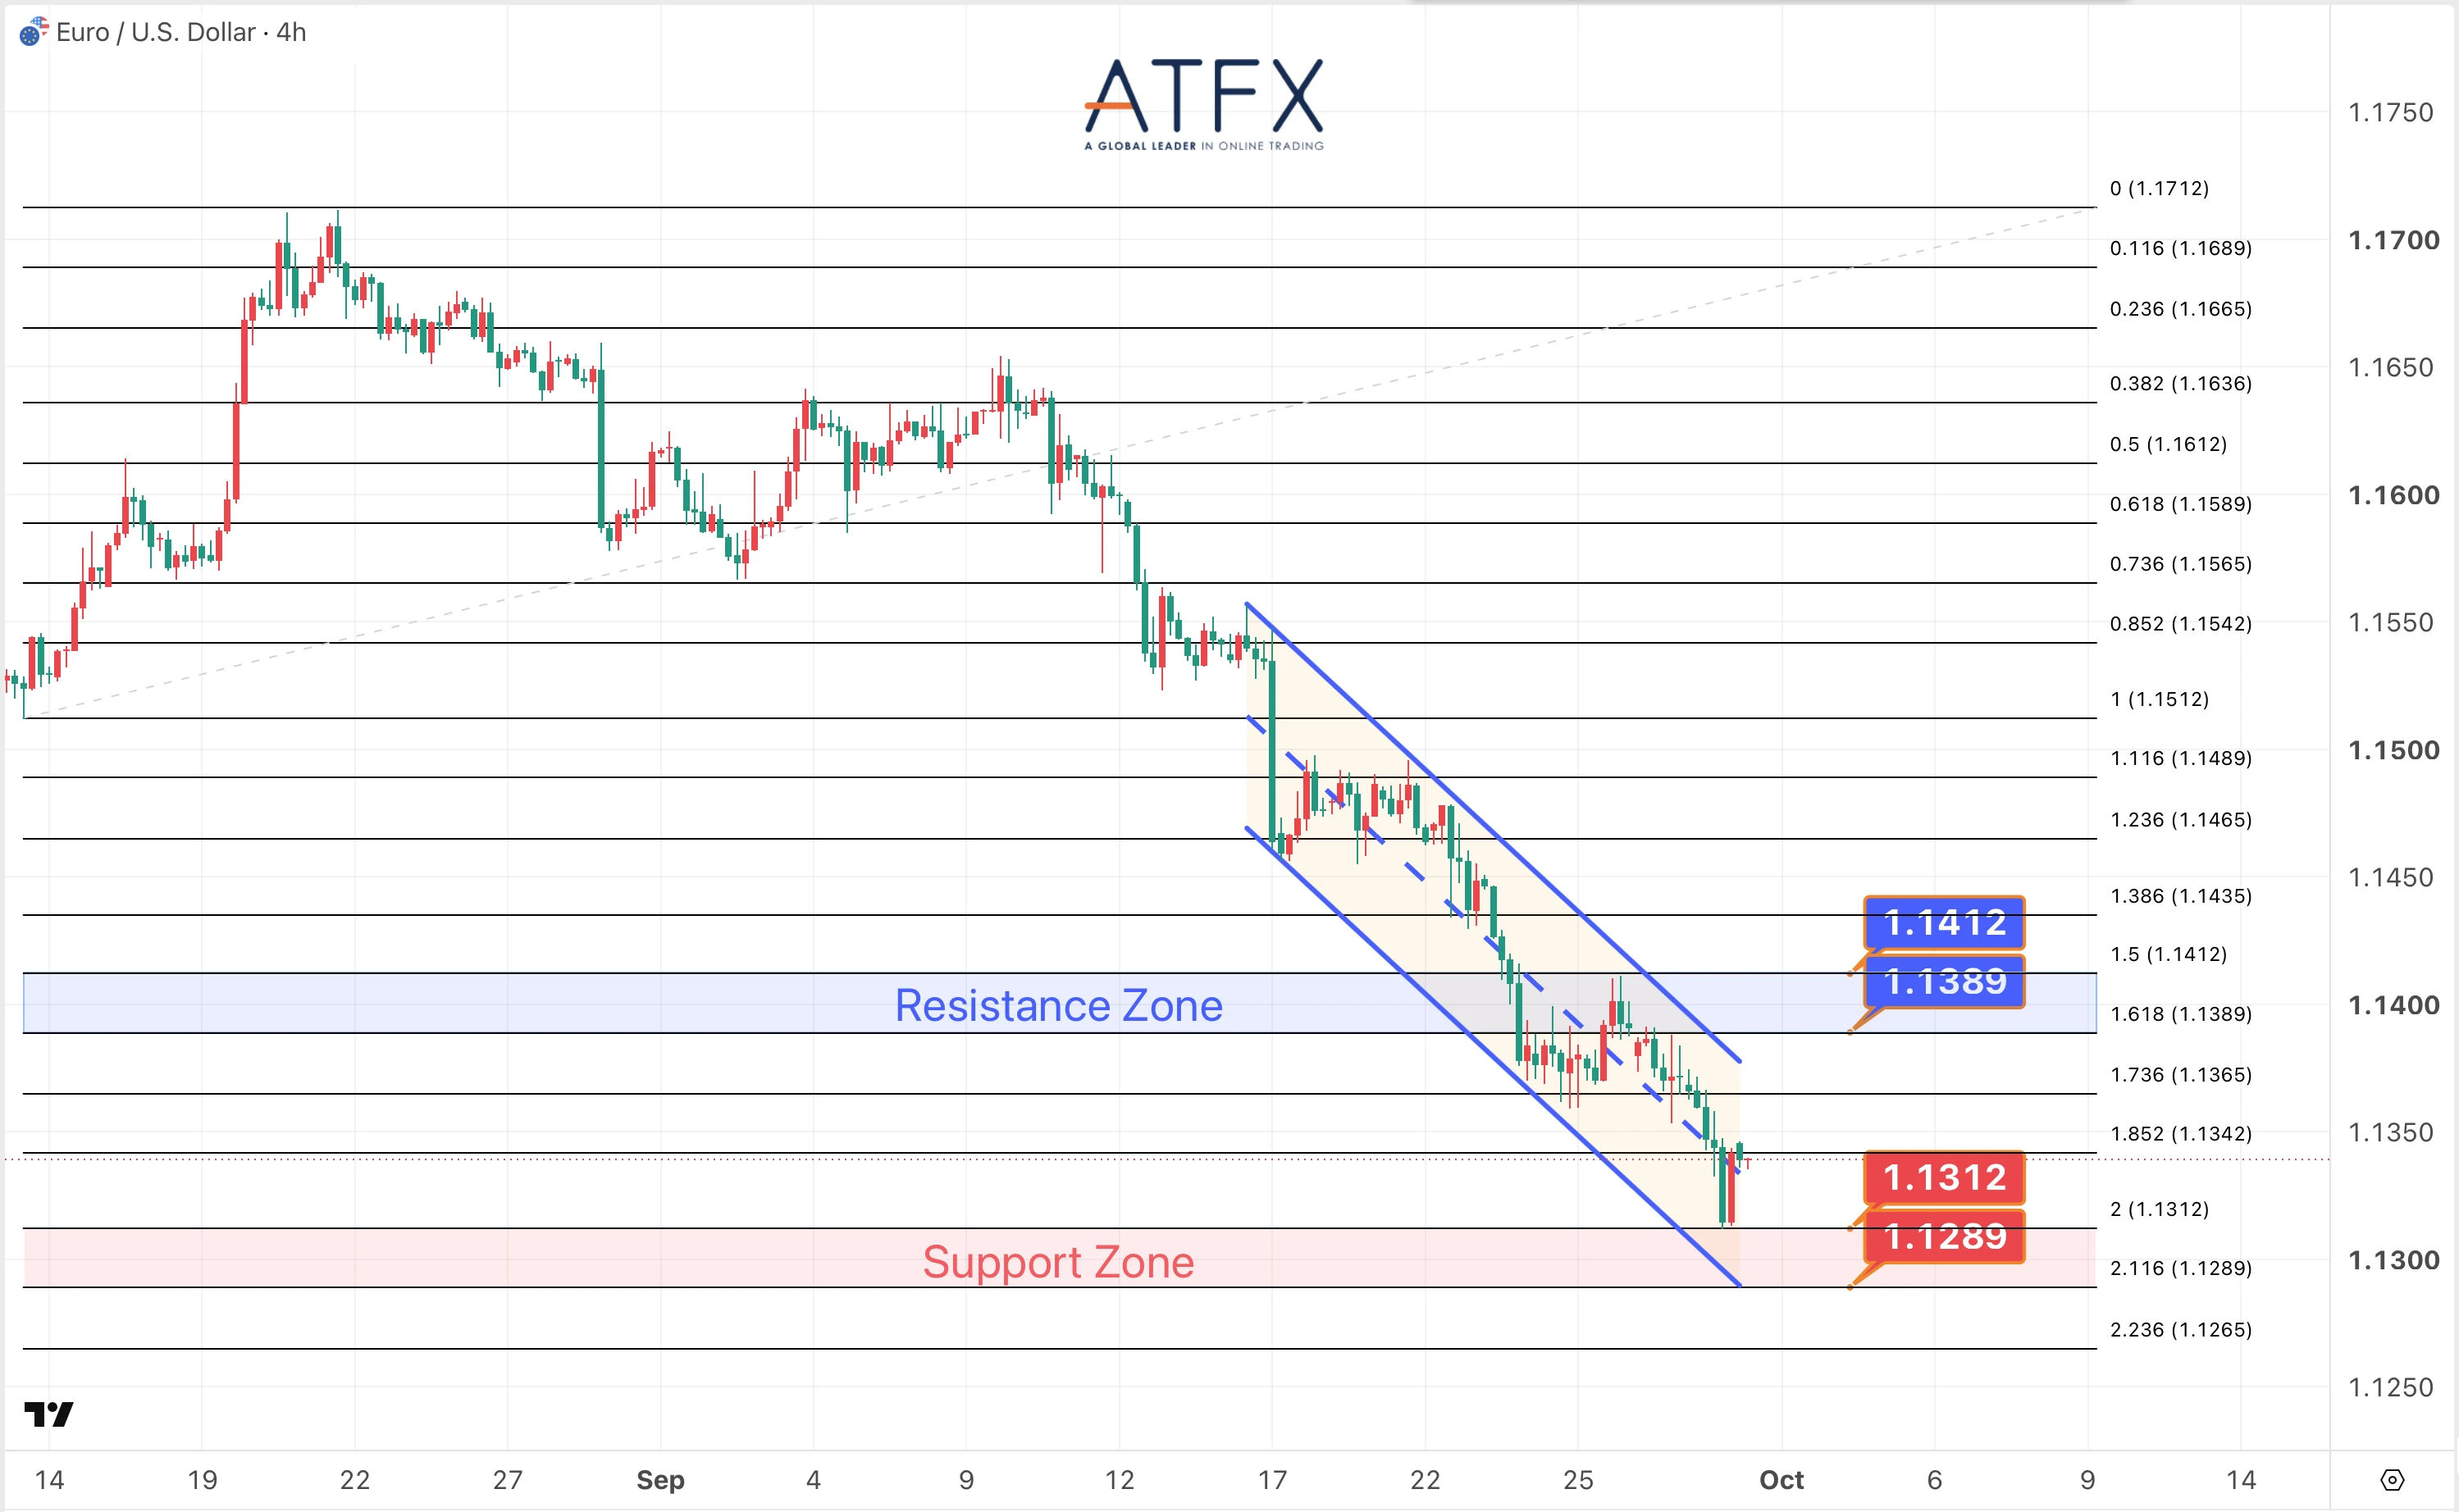
- Resistance: 1.1389/1.1412
- Support: 1.1312/1.1289
Energy market disruptions and heightened political risk in Europe have driven EUR/USD to its lowest level since May 2025. Market participants now await key U.S. data and the release of German CPI.
Analyst’s View: The downward channel continues to widen as the 1.1300 level comes under renewed pressure. Today’s macroeconomic releases will be pivotal in determining whether the recent decline can be arrested.
Bias: Under Pressure
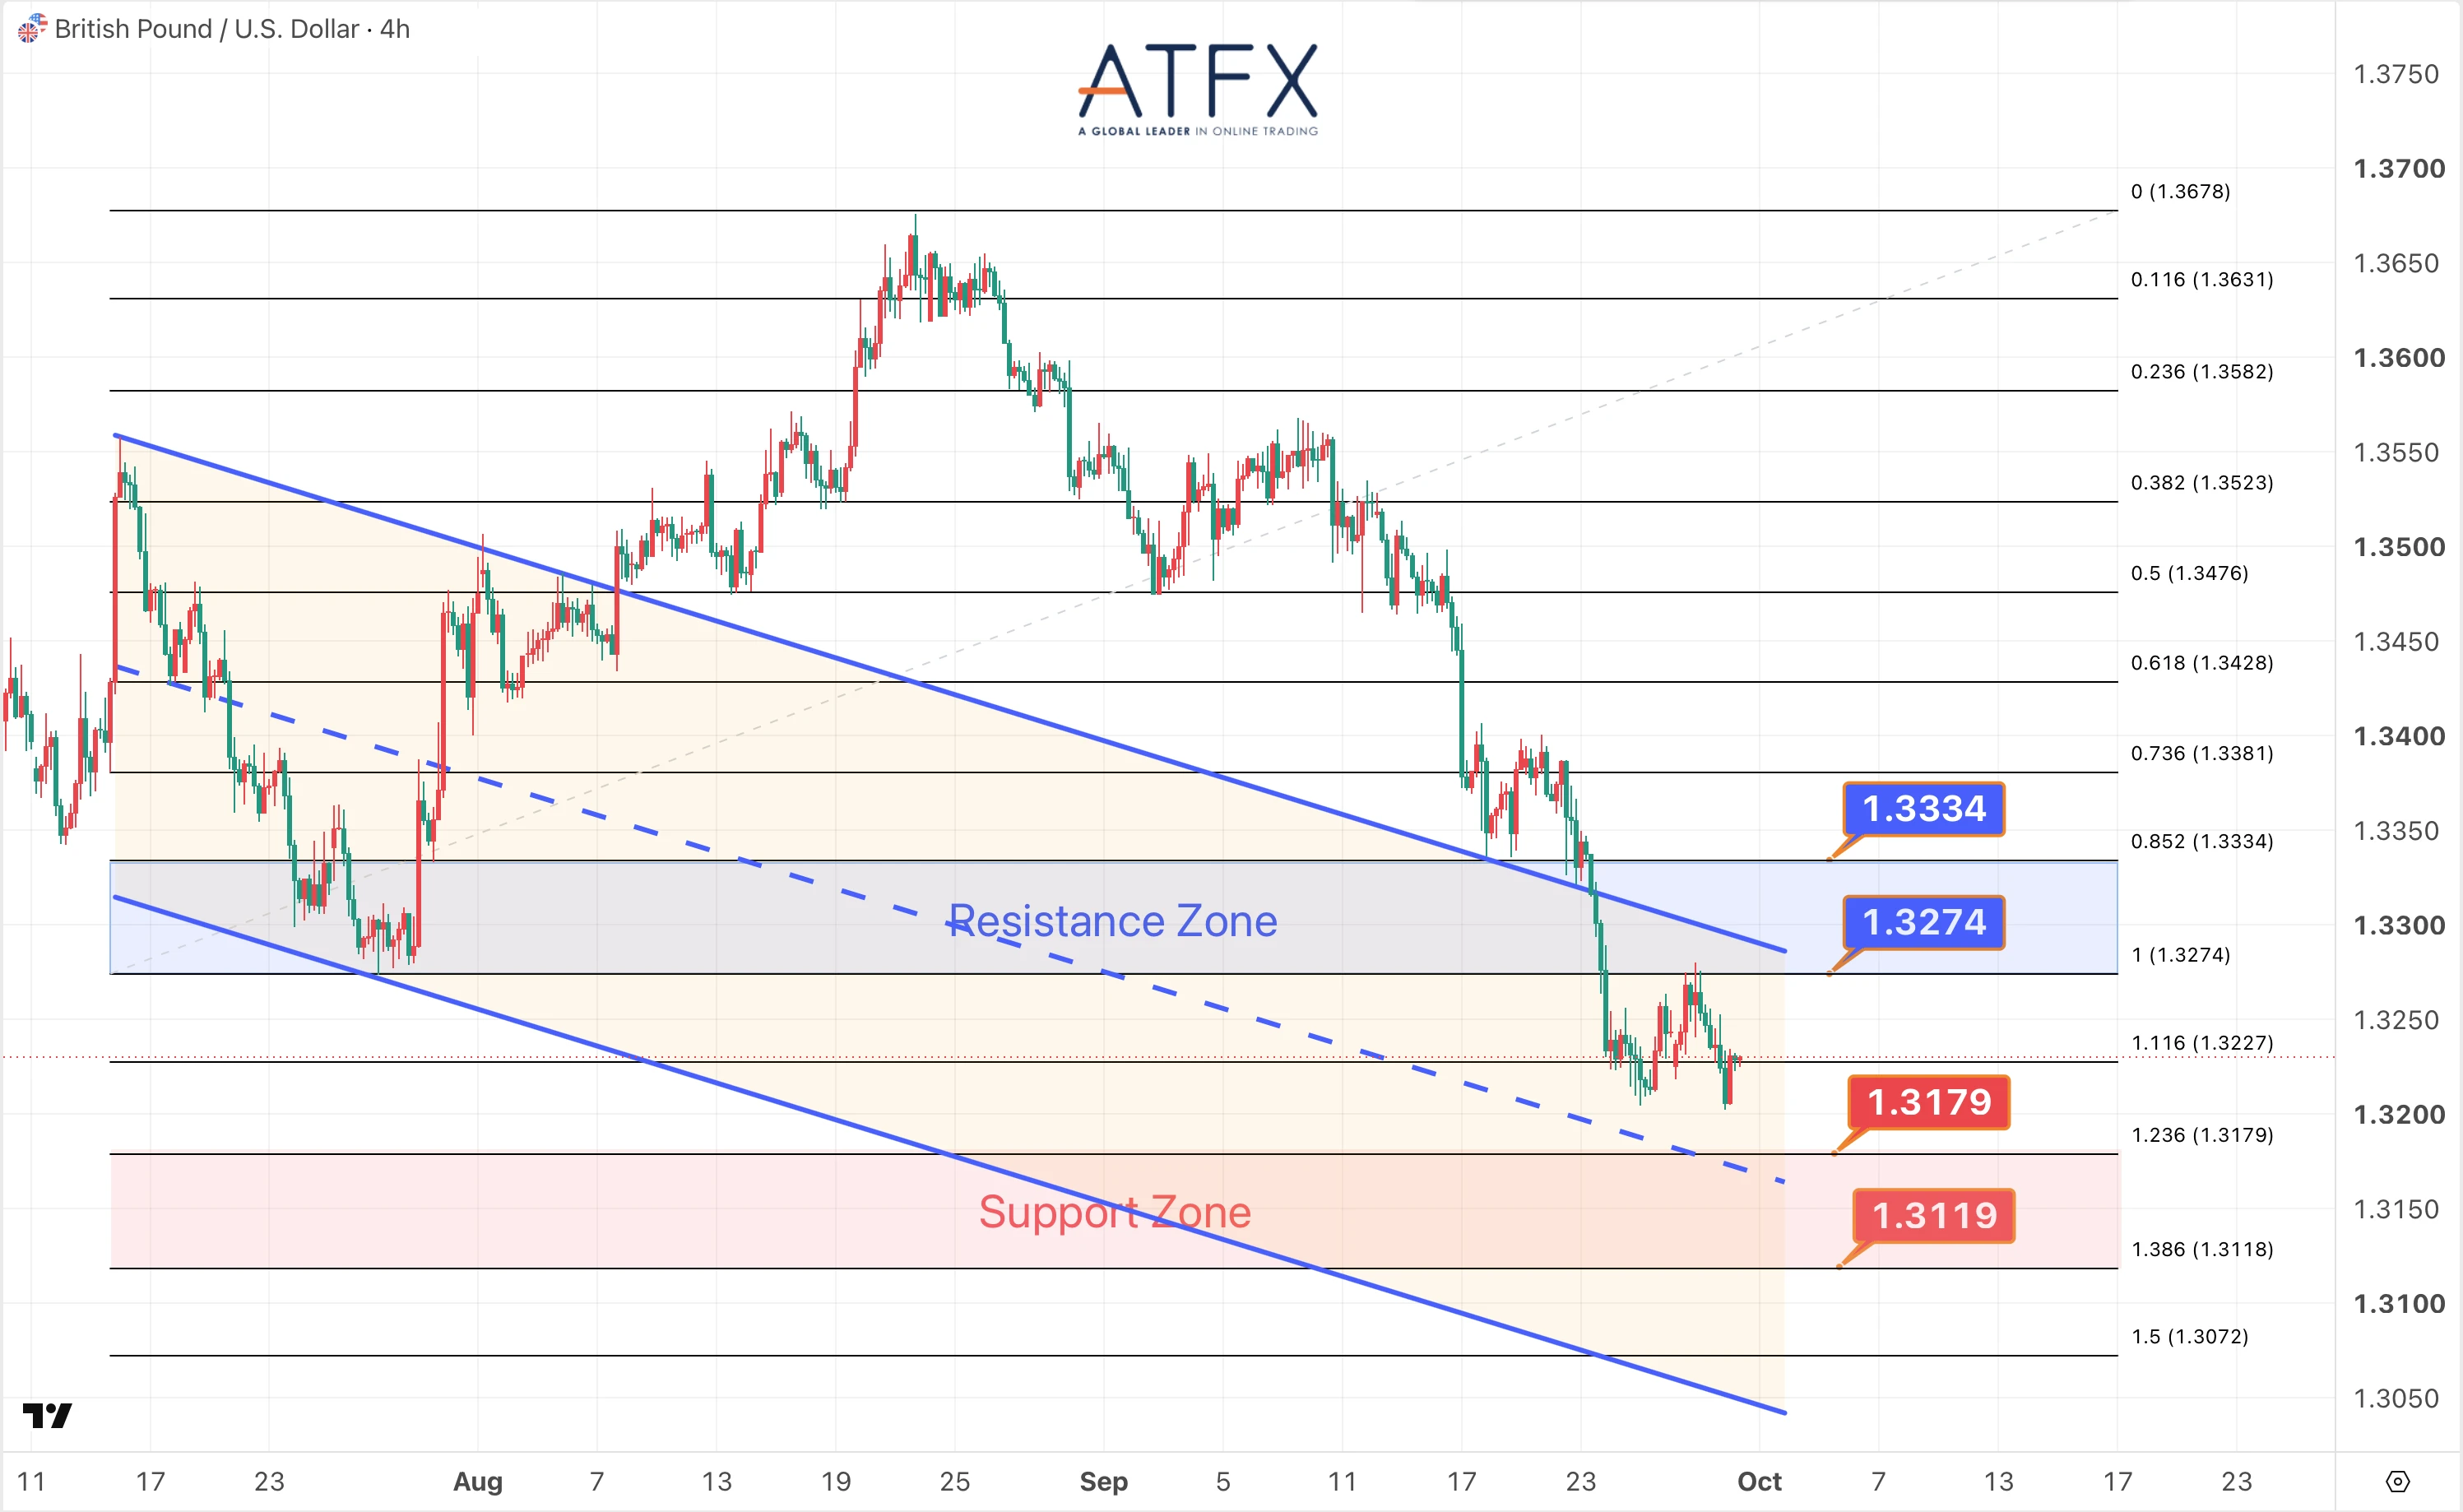
- Resistance: 1.3274/1.3334
- Support: 1.3179/1.3119
GBP/USD reached late-June lows, approaching the 1.3200 level before a modest recovery. The currency pair now awaits directional cues from imminent U.S. economic data releases.
Analyst’s View: The 1.3200 level provided interim support. Downward momentum may moderate ahead of upcoming data, but a decisive break of the established range warrants close monitoring.
Bias: Under Pressure
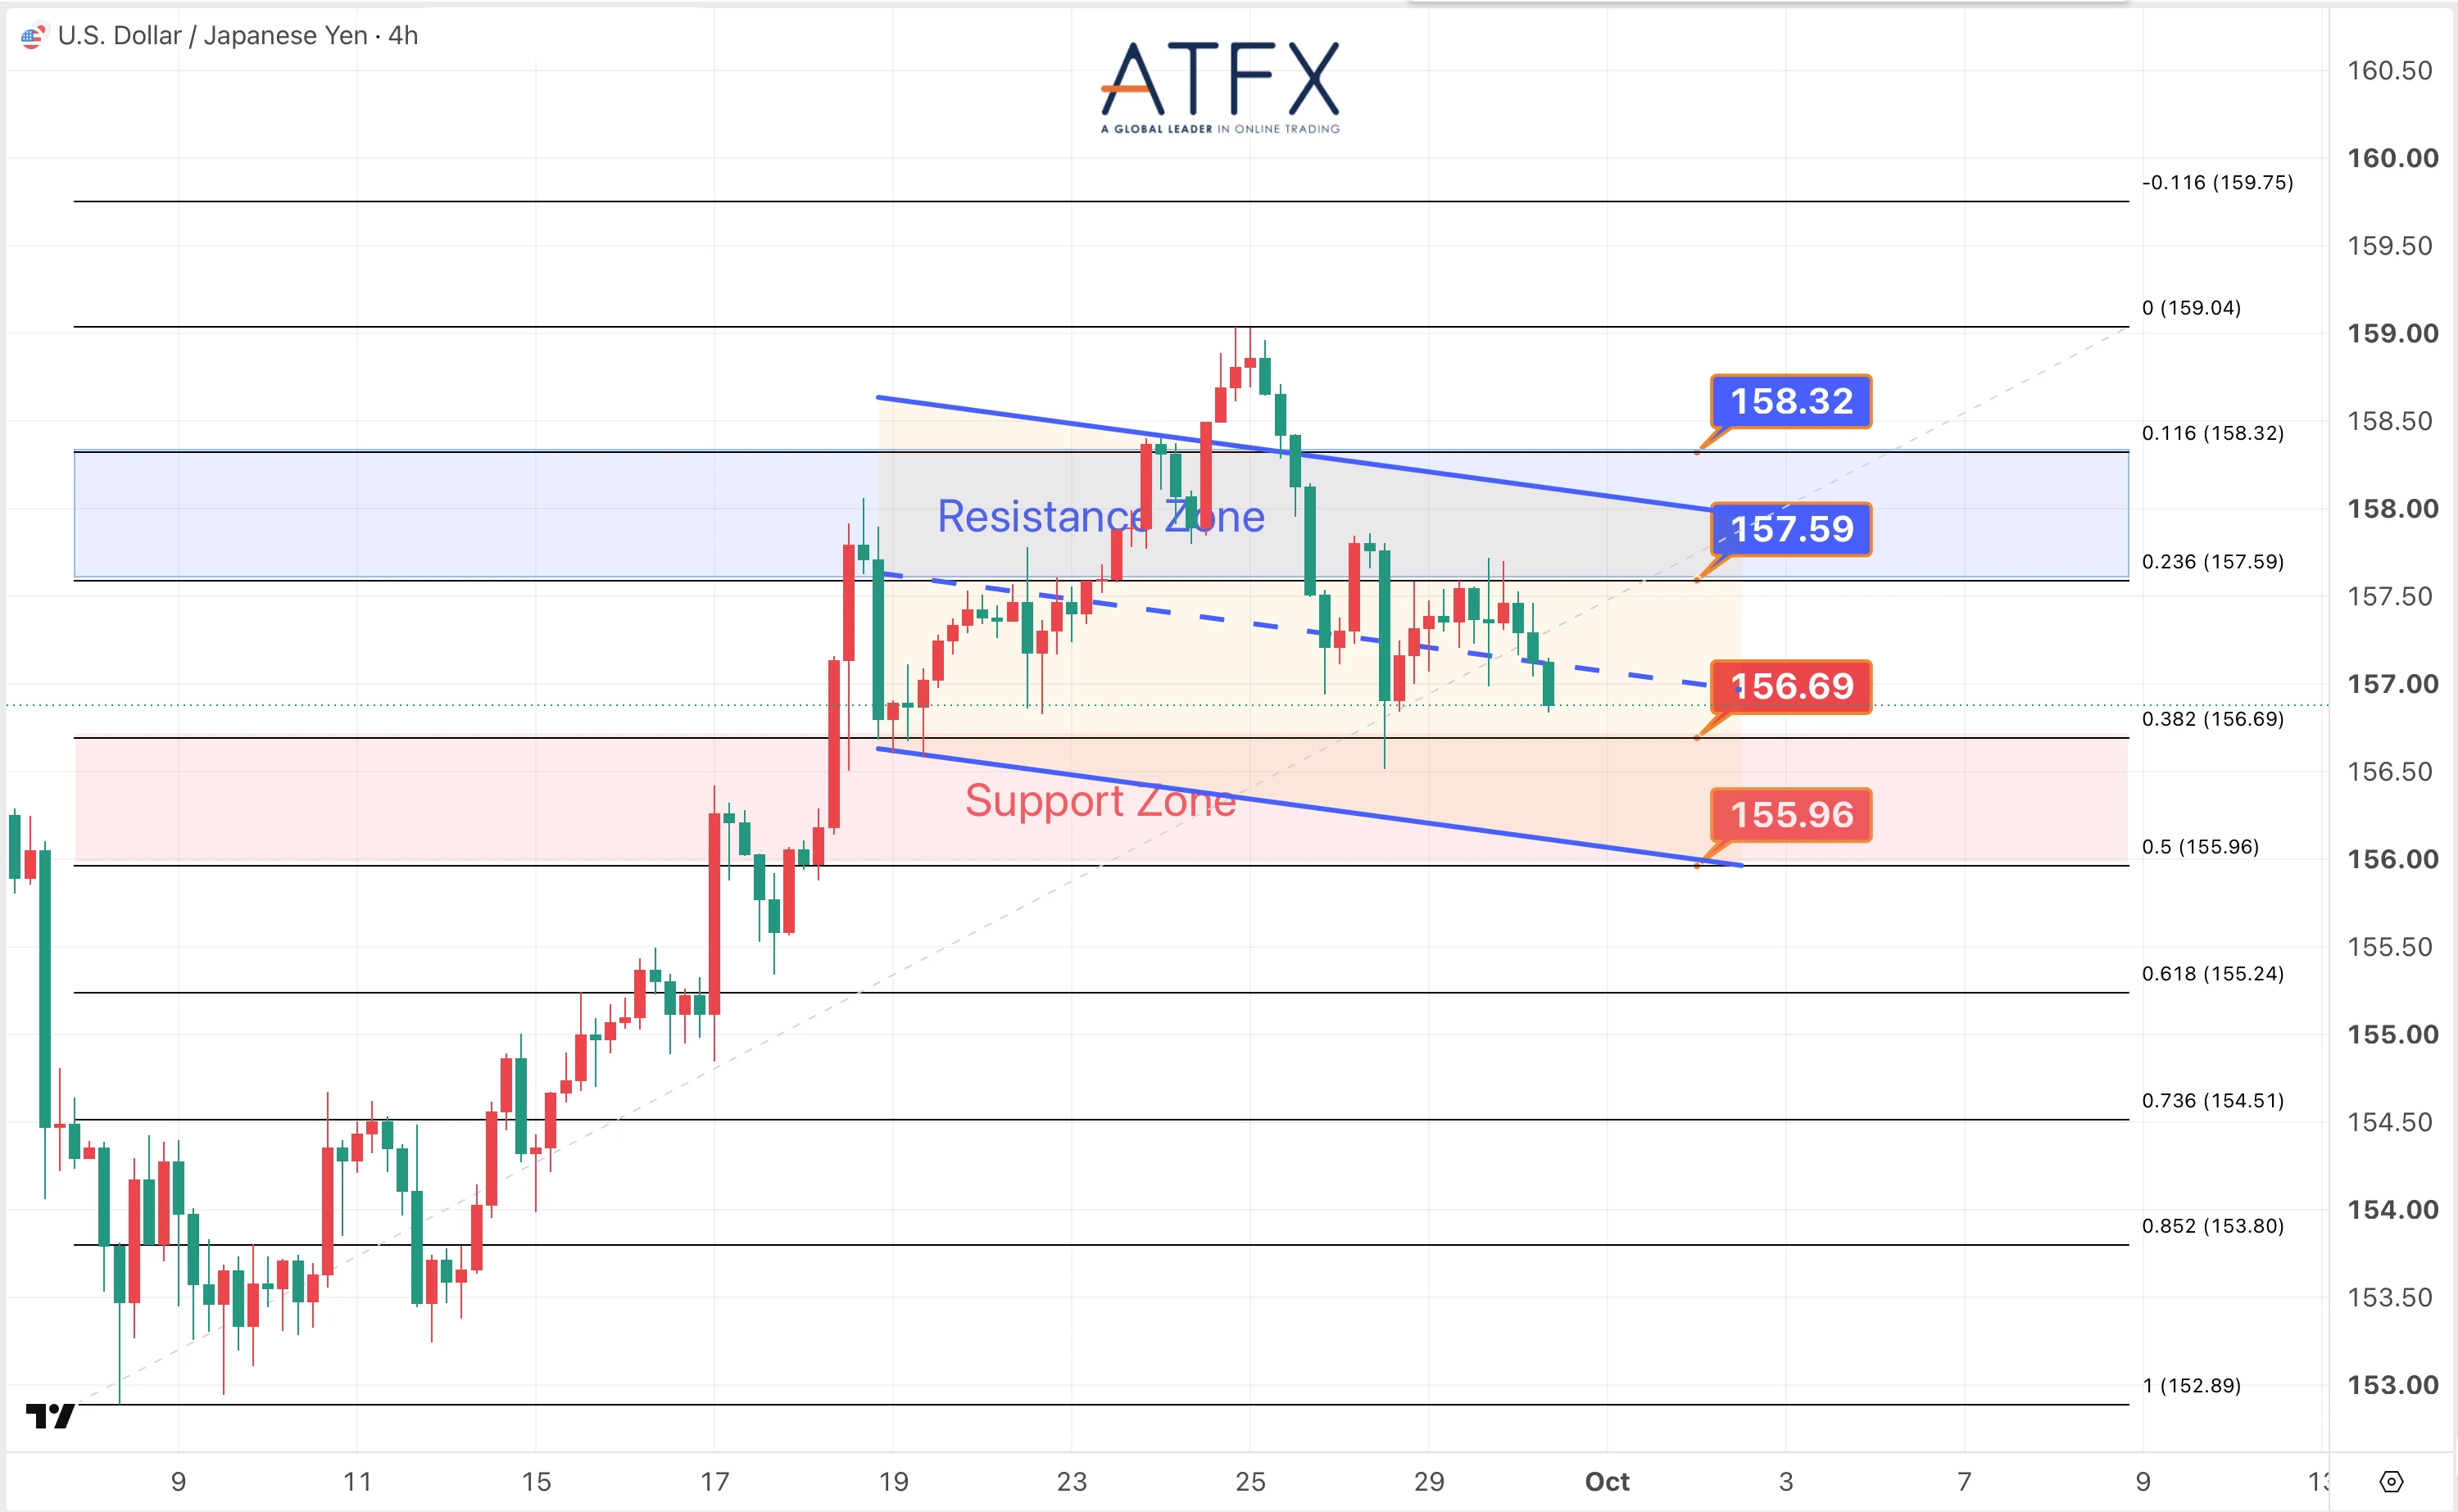
- Resistance: 157.59/158.32
- Support: 156.69/155.96
USD/JPY stabilized as Japanese authorities, including the finance minister, reiterated strong concerns regarding the yen’s ongoing depreciation.
Analyst’s View: The pair broke below its 10-day moving average. Bullish momentum faces resistance, with a potential test of the 156.00 area near the 20-day moving average.
Bias: Short-term Bearish
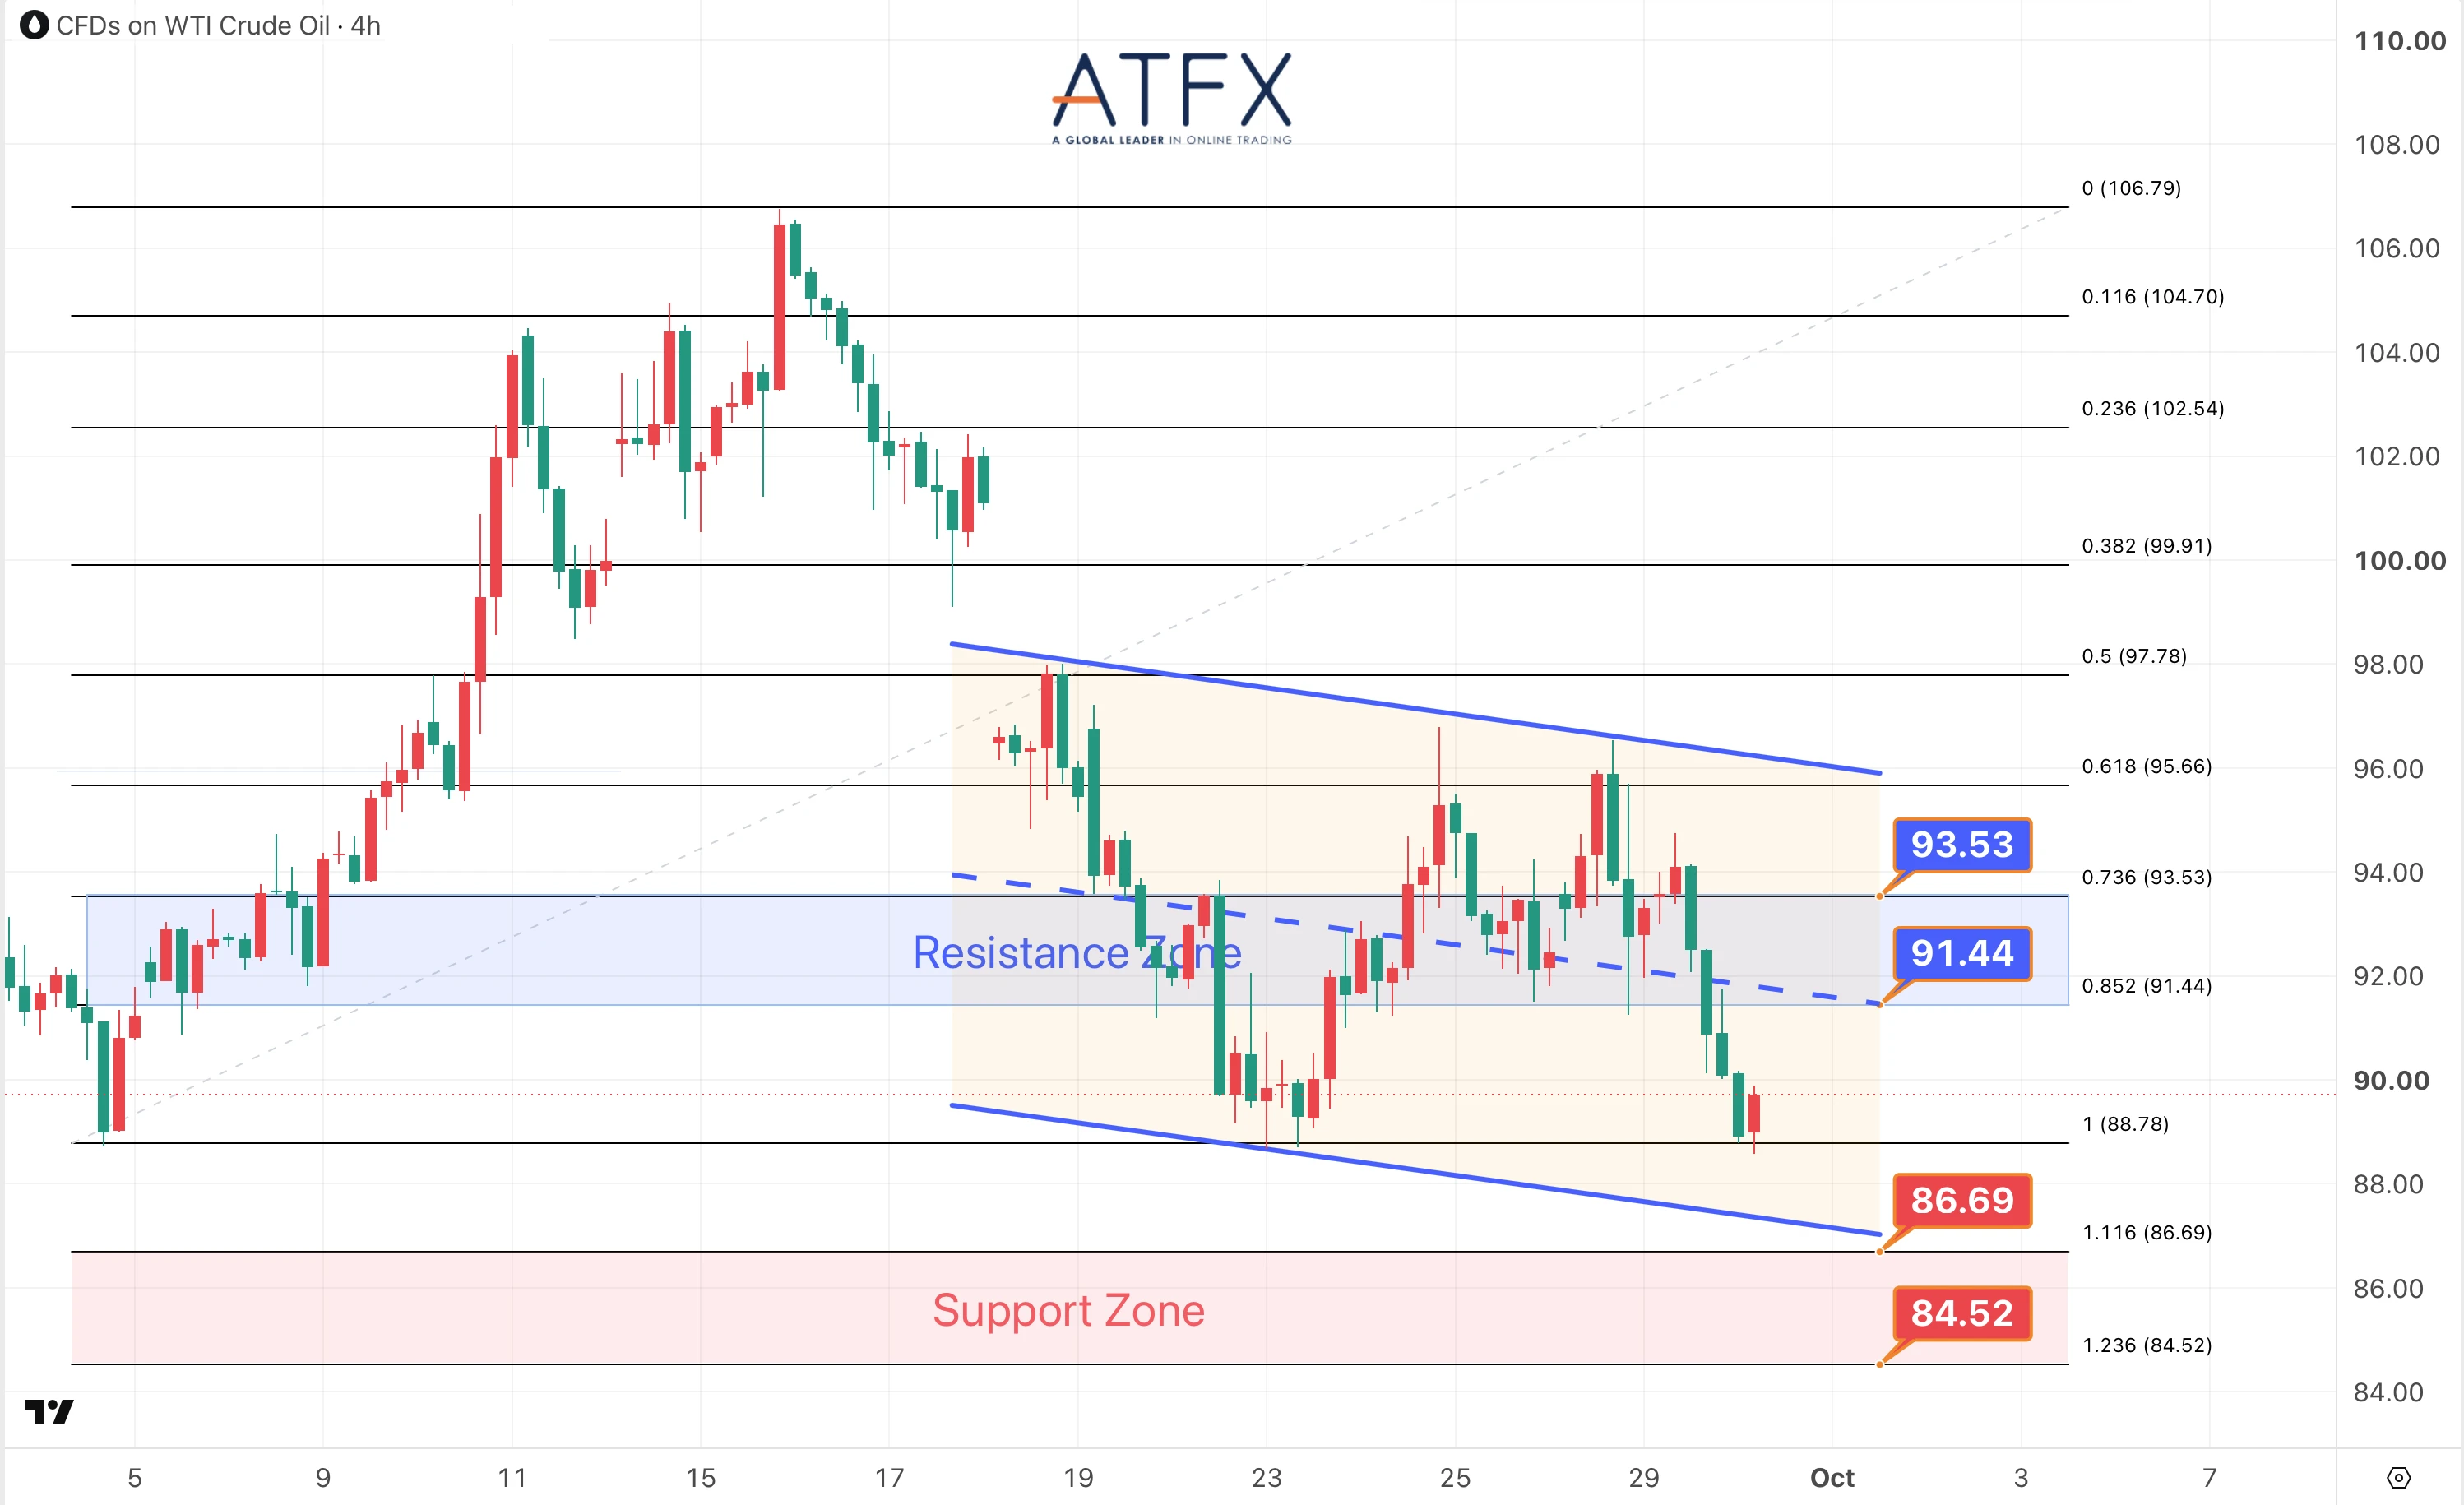
- Resistance: 91.44/93.53
- Support: 86.69/84.52
Saudi pipeline restorations have enhanced Middle Eastern crude supply, exerting downward pressure on prices. Nonetheless, stalled U.S.–Iran negotiations continue to underpin crude oil markets.
Analyst’s View: Key daily moving averages continue to cap upward momentum, suggesting scope for further correction. Last week’s lows may offer interim support.
Bias: Decline May Ease
Spot Gold & Spot Silver
Spot Gold Resistance: 4228/4255
Spot Gold Support: 4140/4113
Spot Silver Resistance: 62.29/63.06
Spot Silver Support: 60.26/59.65
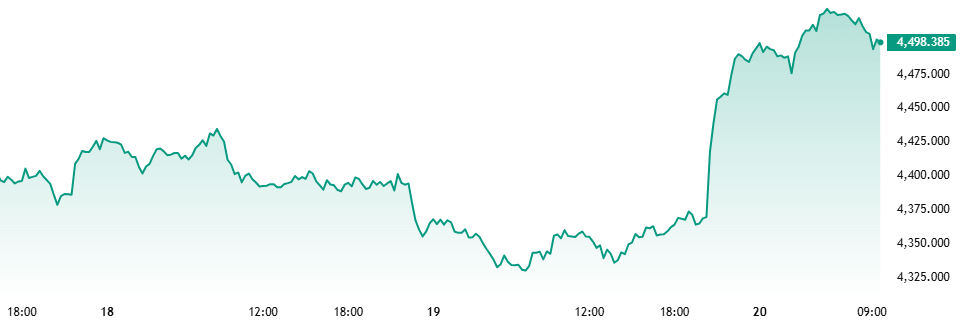
Gold rebounded from a seven-week low as declining oil prices alleviated inflation concerns. Market participants are closely monitoring today’s U.S. PCE and ADP data for further direction.
Analyst’s View: Gold remains range-bound ahead of key data releases but may extend its recovery should U.S. figures prove supportive. Immediate resistance is identified at $4,228 to $4,255.
Bias: Mild Rebound
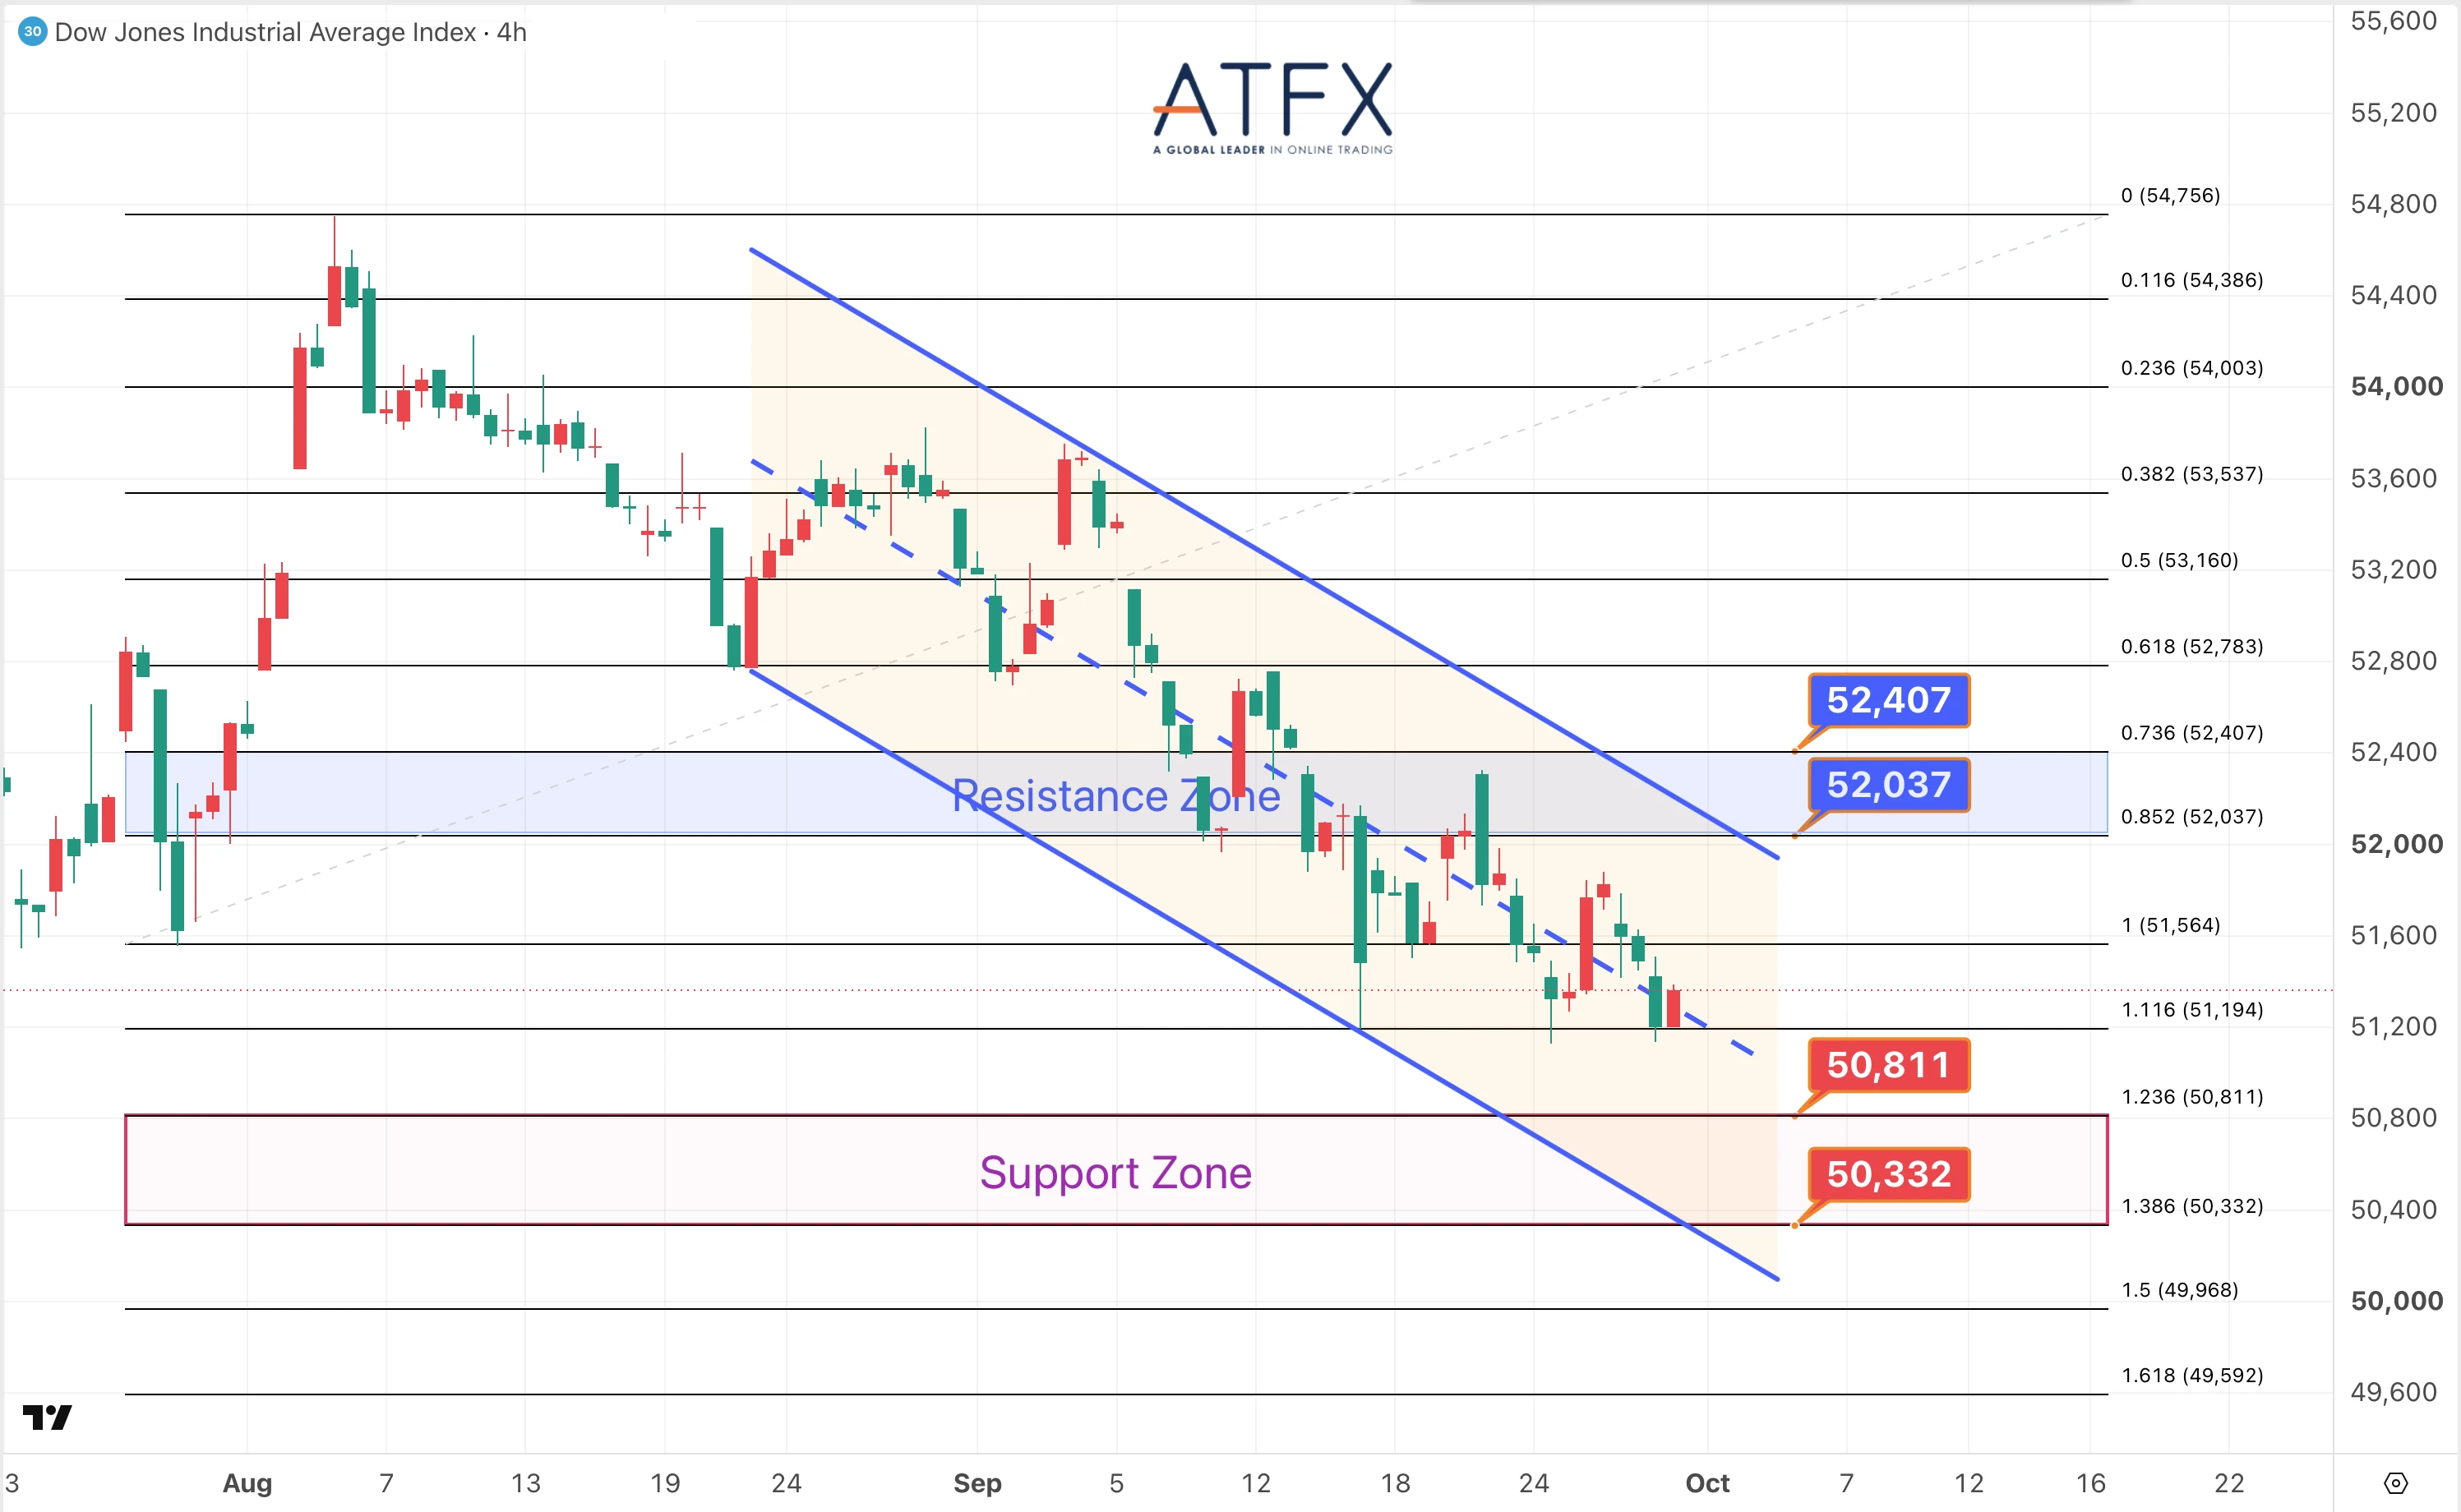
- Resistance: 52037/52407
- Support: 50811/50332
U.S. equities declined in response to hawkish Federal Reserve communications and ahead of key inflation data, though a pullback in oil prices offered some support.
Analyst’s View: Dow found support near last week’s lows. Expect consolidation below the 10-day moving average pending direction from the PCE data release.
Bias: Low-Level Consolidation
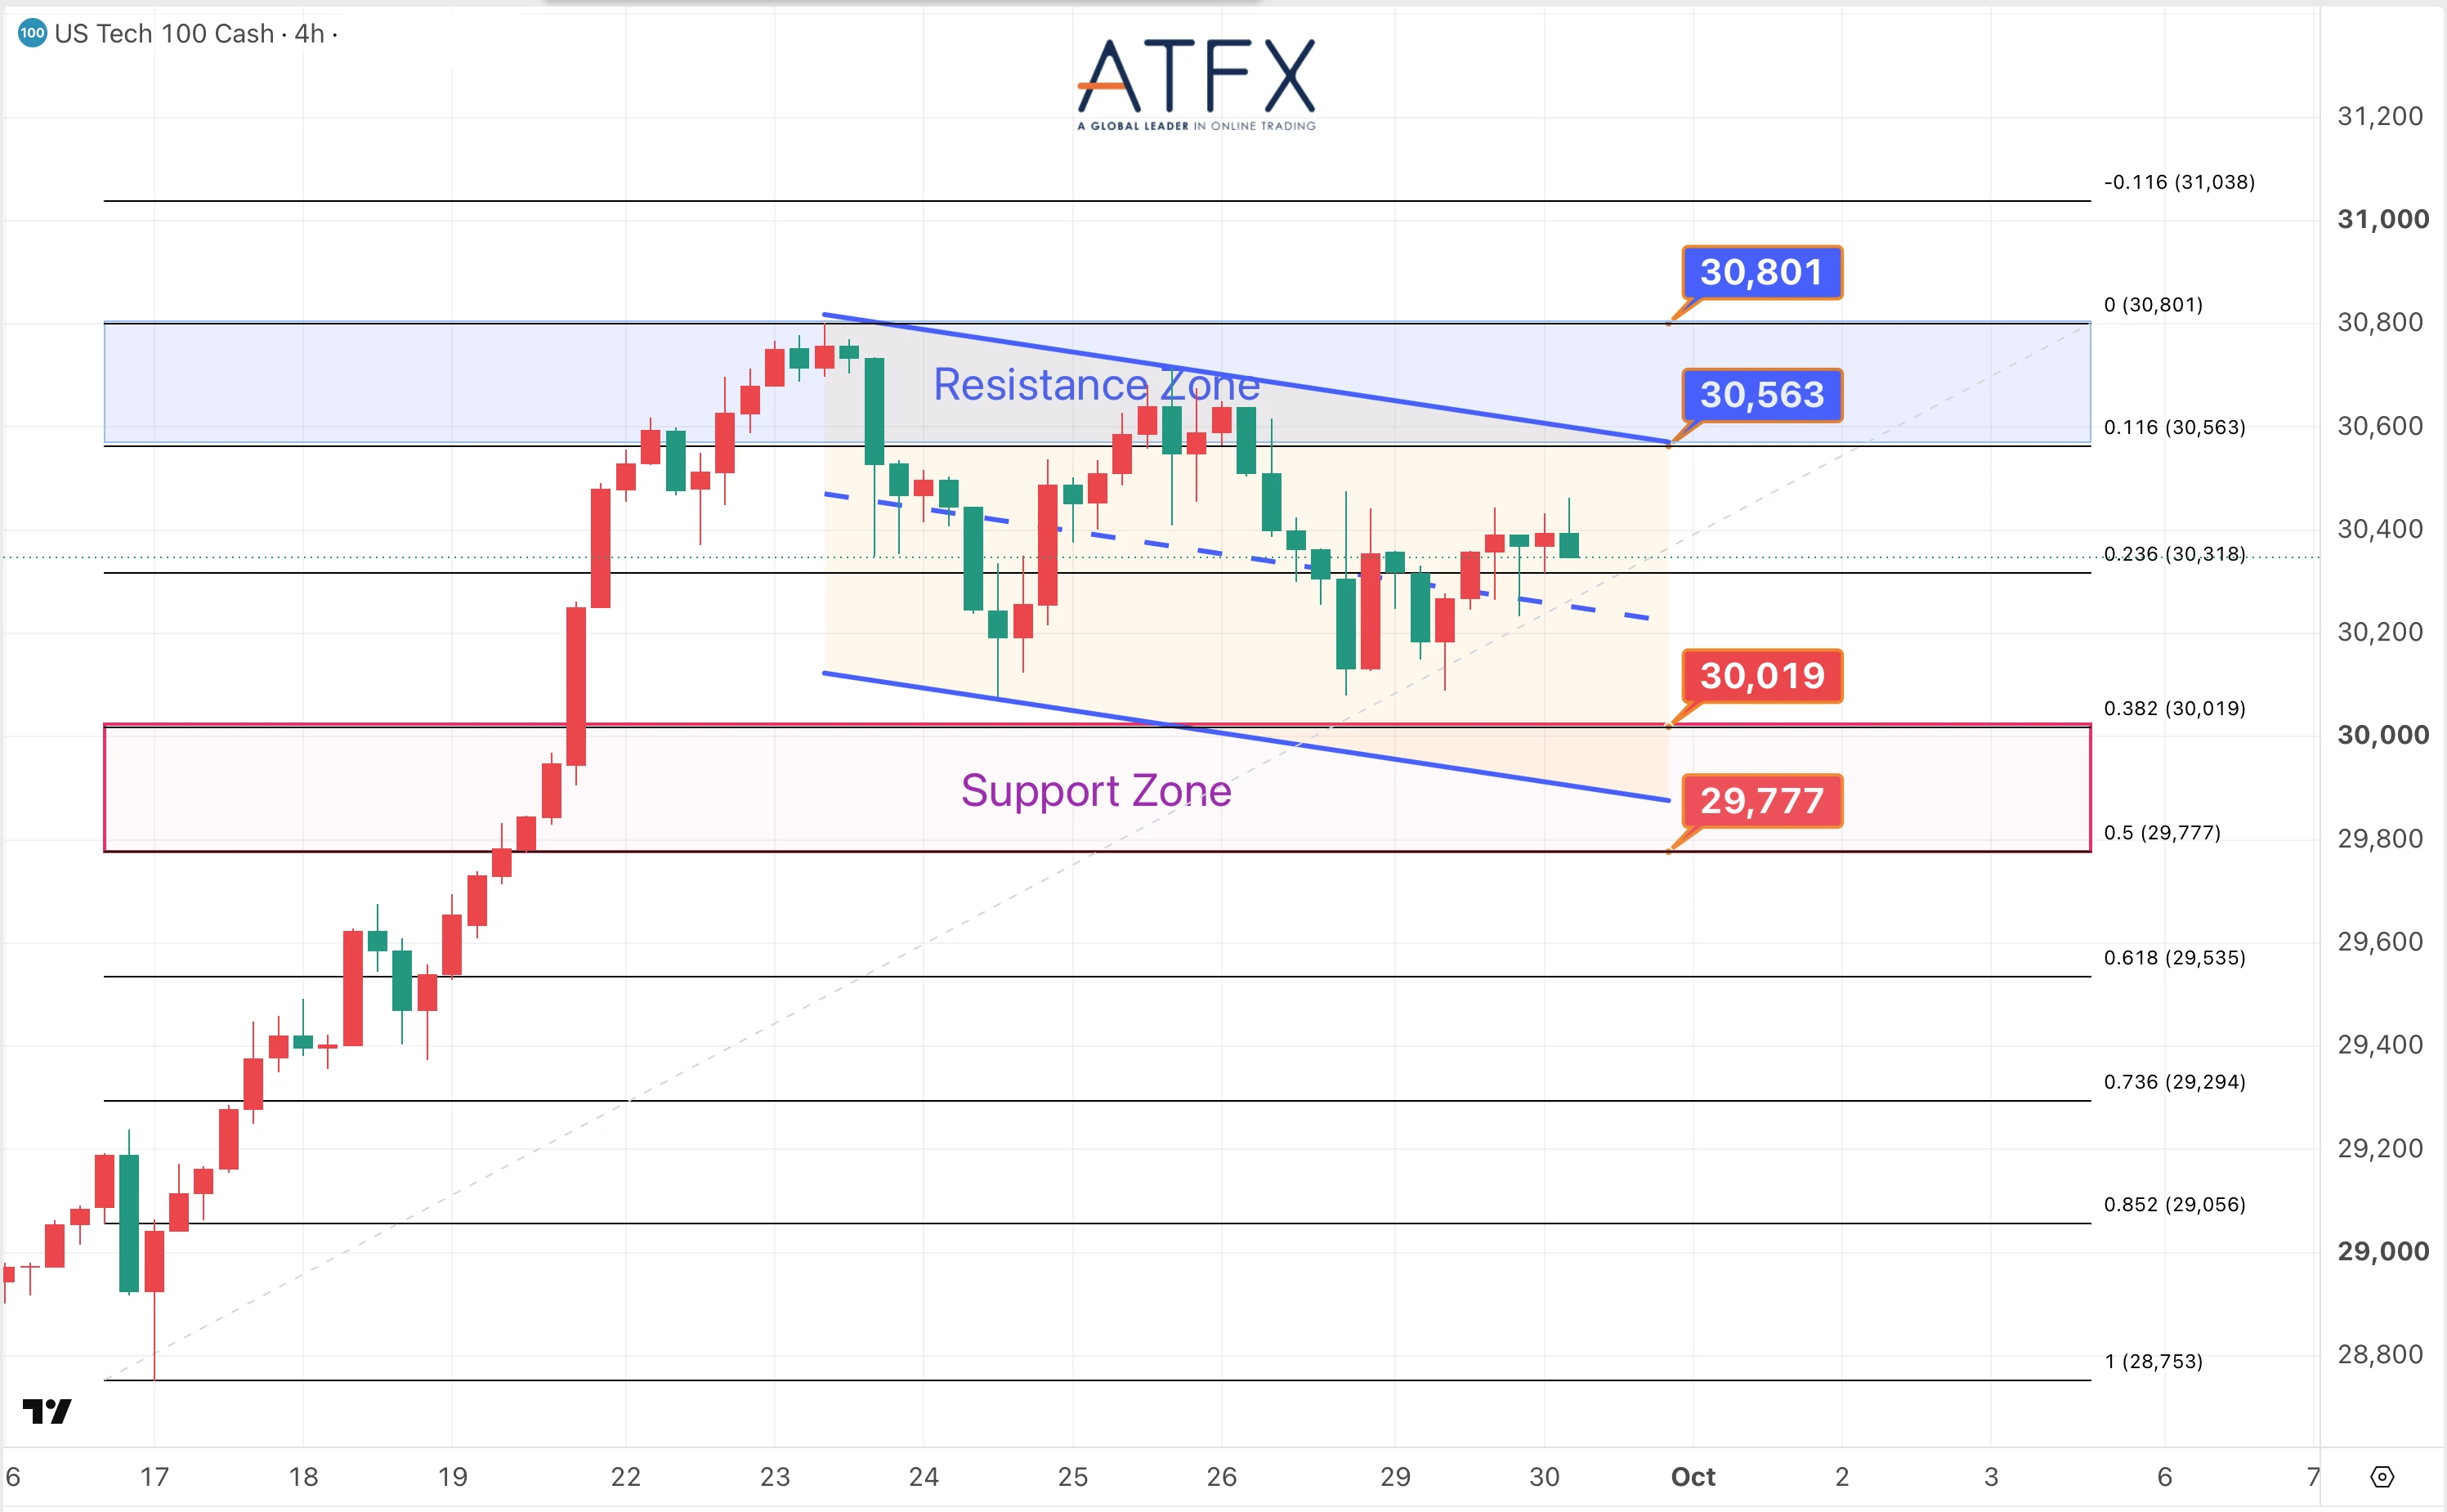
- Resistance: 30563/30801
- Support: 30019/29777
Persistent inflationary pressures and heightened concerns about rate hikes intensified the sell-off in U.S. Treasuries. Elevated yields and cautious positioning ahead of today’s U.S. data exerted downward pressure on technology equities.
Analyst’s View: Nasdaq found interim support at the lower boundary of its weekly trading range. The forthcoming PCE price data will be instrumental in determining the potential for a rebound.
Bias: Wait-and-See
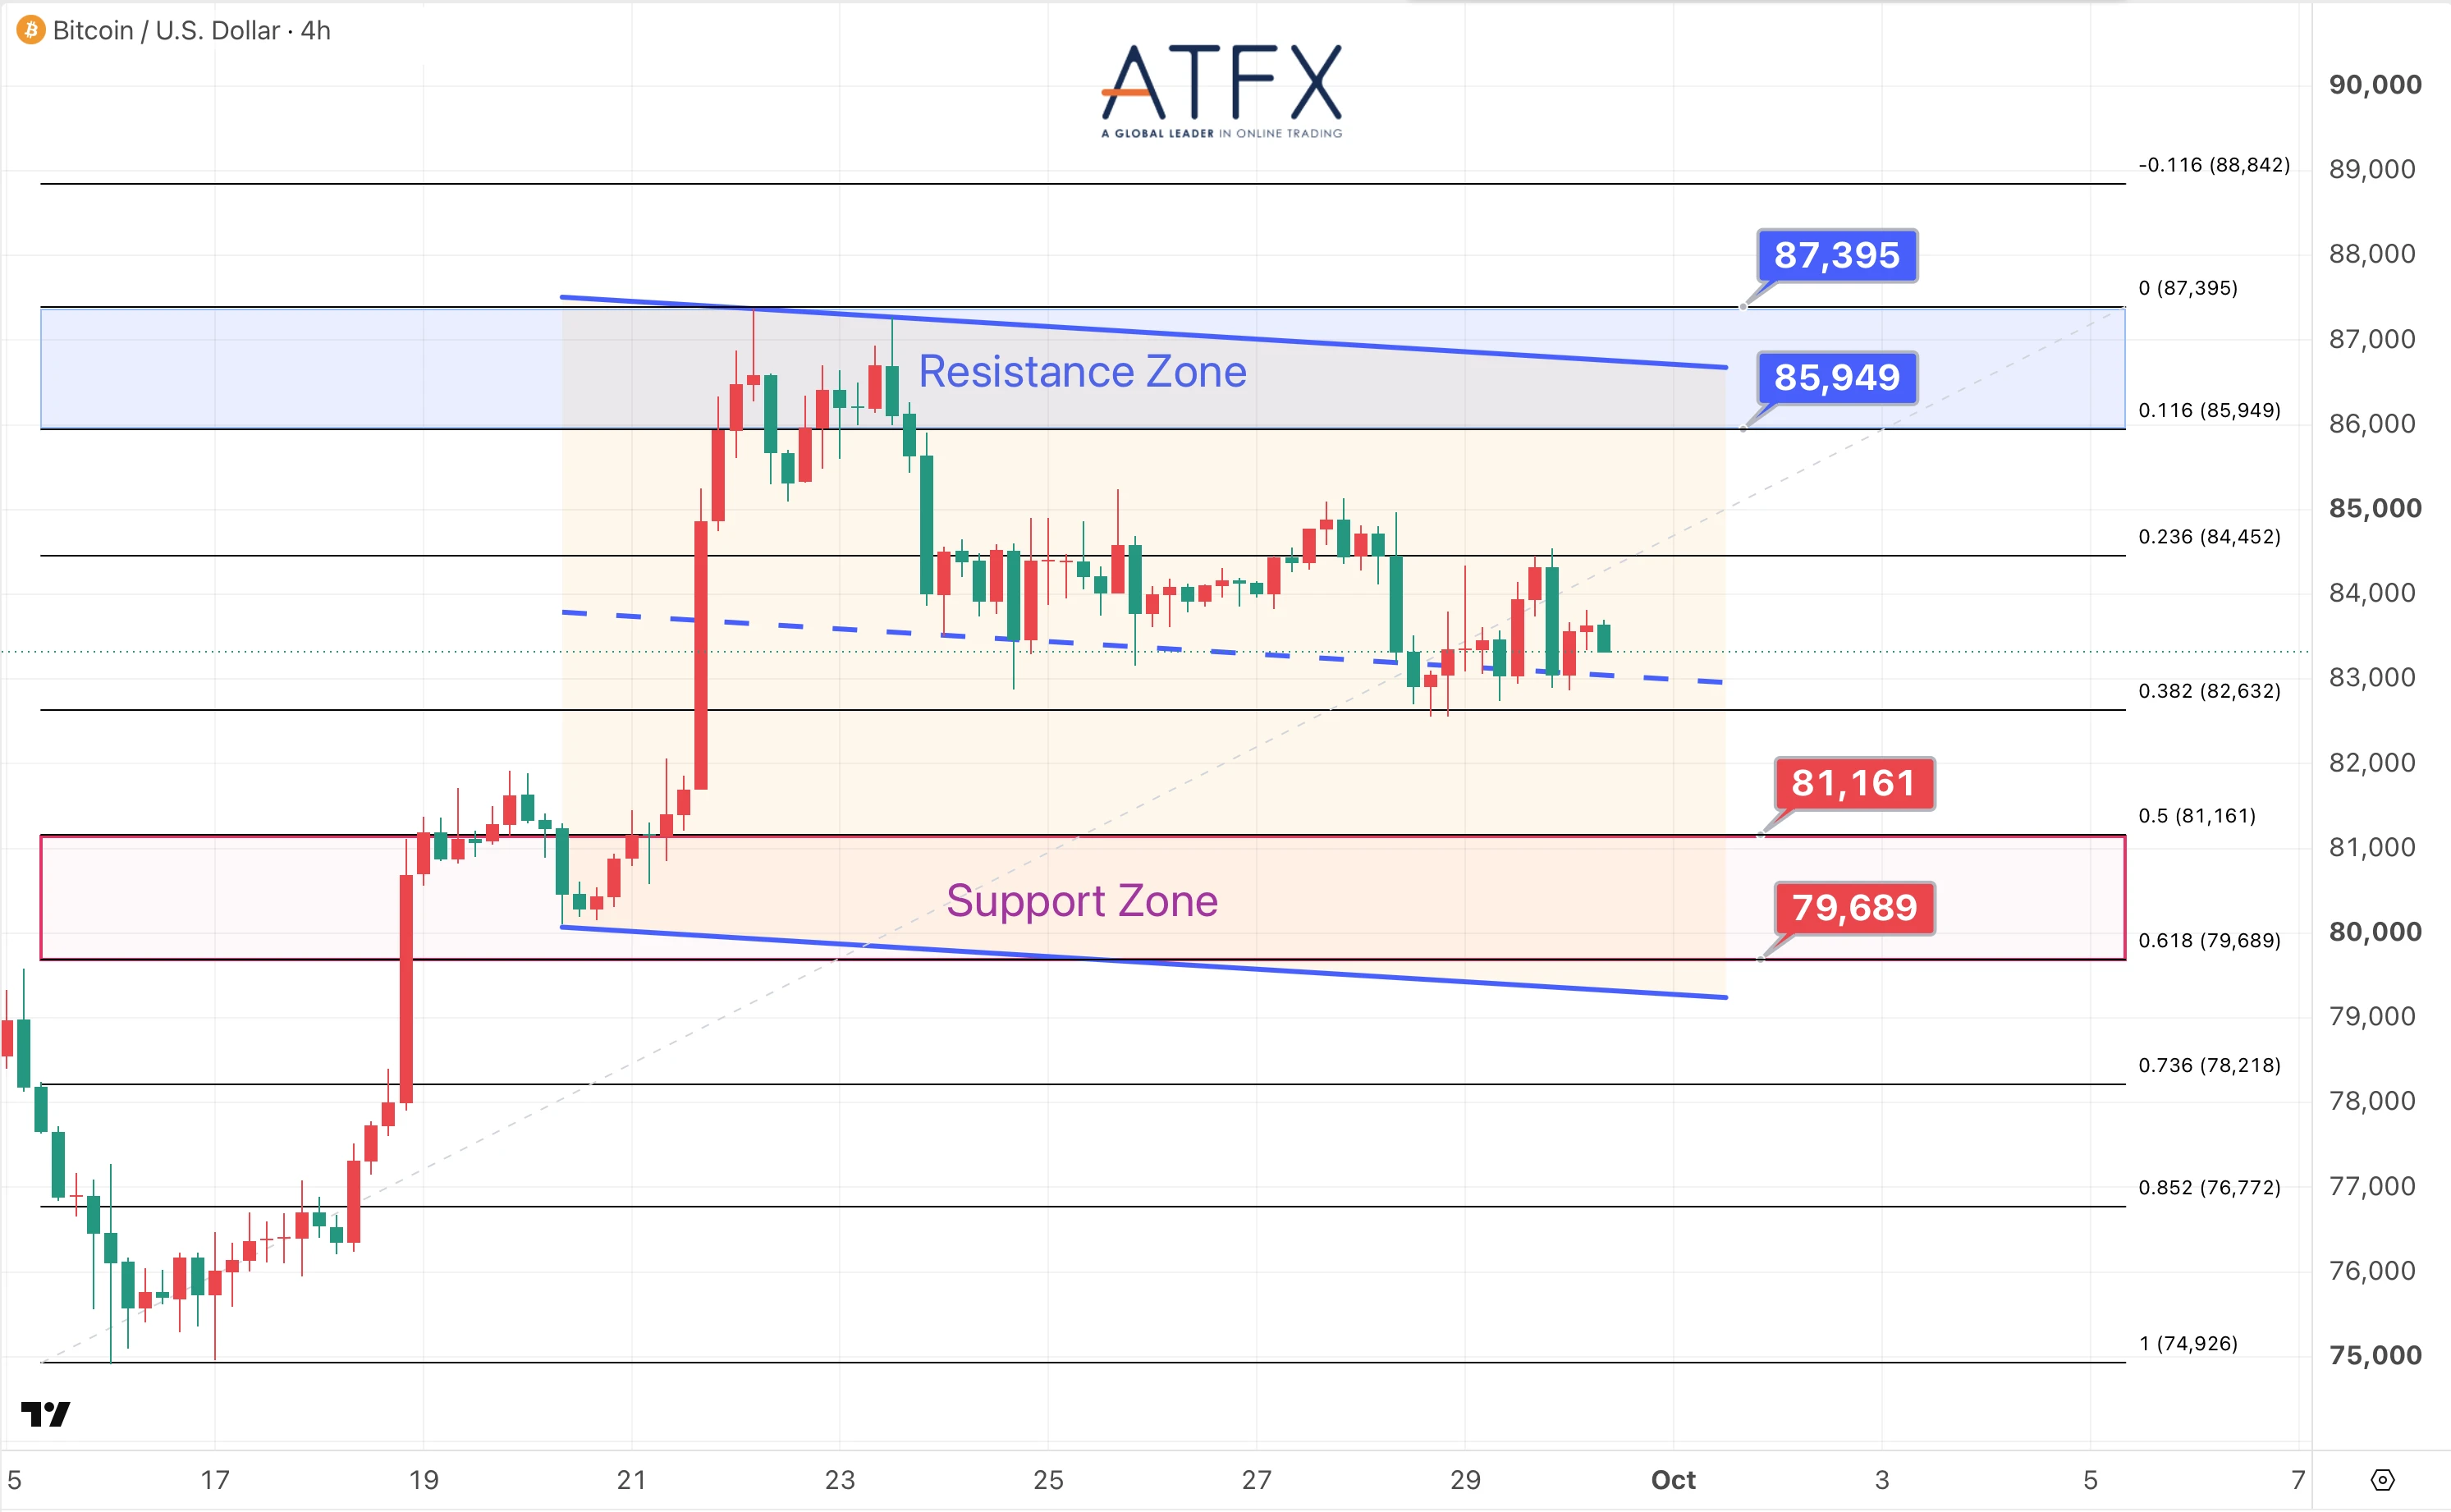
- Resistance: 85949/87395
- Support: 81161/79689
Bitcoin remains near $83,400 as surging U.S. Treasury yields and ongoing U.S.–Iran geopolitical tensions suppress risk appetite.
Analyst’s View: Continued ETF inflows provide support despite prevailing macroeconomic headwinds. Monitor whether upcoming U.S. data results in a breach of current support levels.
Bias: Under Pressure
Disclaimer: This analysis is for reference only. Happy trading!
Reminder: Due to the holiday, ATFX daily commentary will not be updated on October 1; normal updates will resume on October 2.