

Key Takeaways
Today’s Focus: The RBA is expected to raise rates by 25 bps to 4.60% due to strong inflation. Watch the statement and Governor Bullock for clues on whether further hikes are coming in November or if rates will pause for the rest of the year. Later, US JOLTS job openings for August (forecast 7.24M) will set the tone ahead of Friday’s non-farm payrolls. |
Global Markets 29/09/2026
- Dow -0.67%, S&P 500 -0.77%, Nasdaq -0.92% at Monday’s close.
- Yields edged higher; the dollar was steady.
- Gold slid nearly 4% to a 7+ week low.
- Oil posted modest gains after Qatar signaled that separate US-Iran talks would continue.
- Bitcoin also fell over 1% to about $83,000 on higher yields and stalled Iran negotiations.
Economic Calendar
| Time (GMT+8) | Event | Importance |
|---|---|---|
| 12:30 | Australia RBA Interest Rate Decision | *** |
| 13:30 | Australia RBA Governor Bullock Press Conference | *** |
| 17:00 | Eurozone September Economic Sentiment Indicator | ** |
| 20:30 | Canada July GDP | ** |
| 22:00 | US August JOLTS Job Openings | *** |
| 22:00 | US September Conference Board Consumer Confidence Index | ** |
Key Events on September 30 (GMT+8)
| Time (GMT+8) | Event | Importance |
|---|---|---|
| 04:30 | API Crude Oil Stock Change | ** |
| 09:30 | Australia August CPI YoY | ** |
| 09:30 | China September NBS Manufacturing & Non-Manufacturing PMI | ** |
| 14:00 | UK Q2 GDP QoQ (Final) | ** |
| 15:55 | Germany September Unemployment Rate | ** |
| 20:00 | Germany September CPI YoY (Preliminary) | *** |
| 20:15 | US September ADP Employment Change | ** |
| 20:30 | US Q2 GDP Annualized QoQ (Final) | ** |
| 20:30 | US August Core PCE Price Index YoY | *** |
| 22:30 | EIA Crude Oil Stock Change | ** |
Markets Analysis 29/09/2026
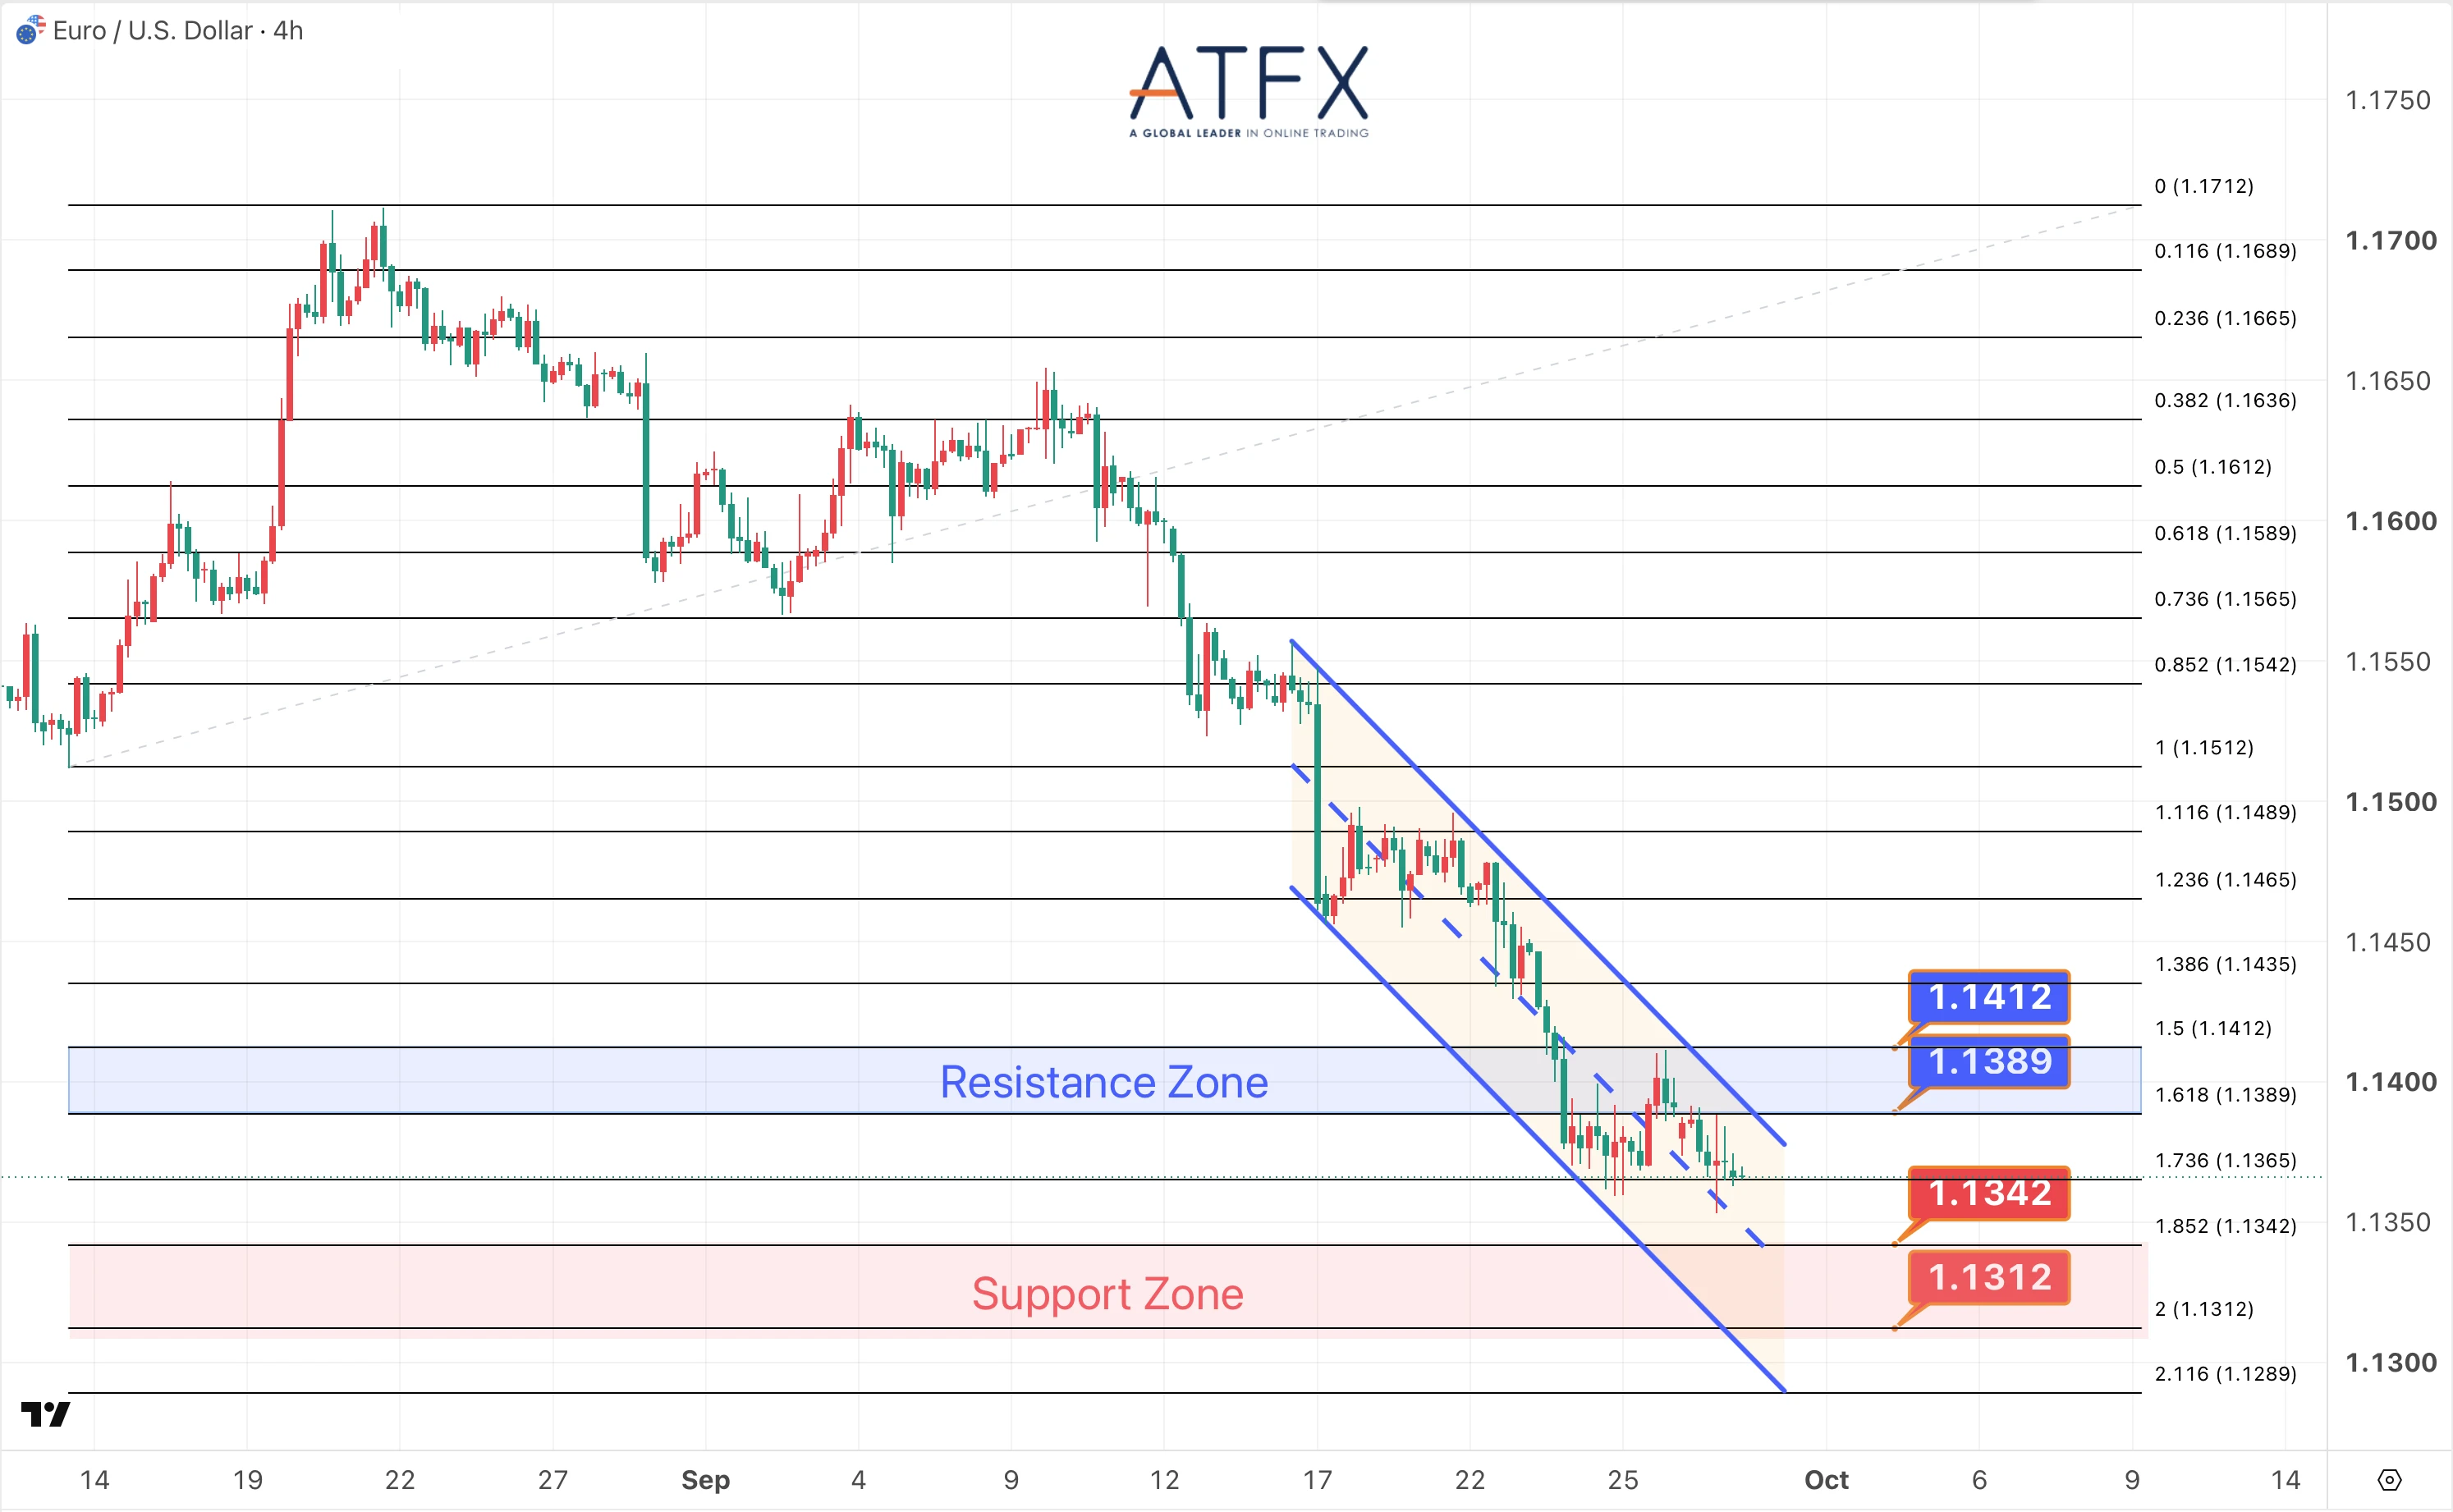
- Resistance: 1.1389/1.1412
- Support: 1.1342/1.1312
EUR/USD stays weak as the US dollar holds near a two-month high, boosted by rising US Treasury yields and stronger expectations for Fed rate hikes.
Analyst View: The pair remains capped below 1.1400. With Germany’s inflation data due Wednesday and US payrolls Friday, EUR/USD is likely to remain defensive unless the dollar rally cools.
Bias: Pressured, range-bound
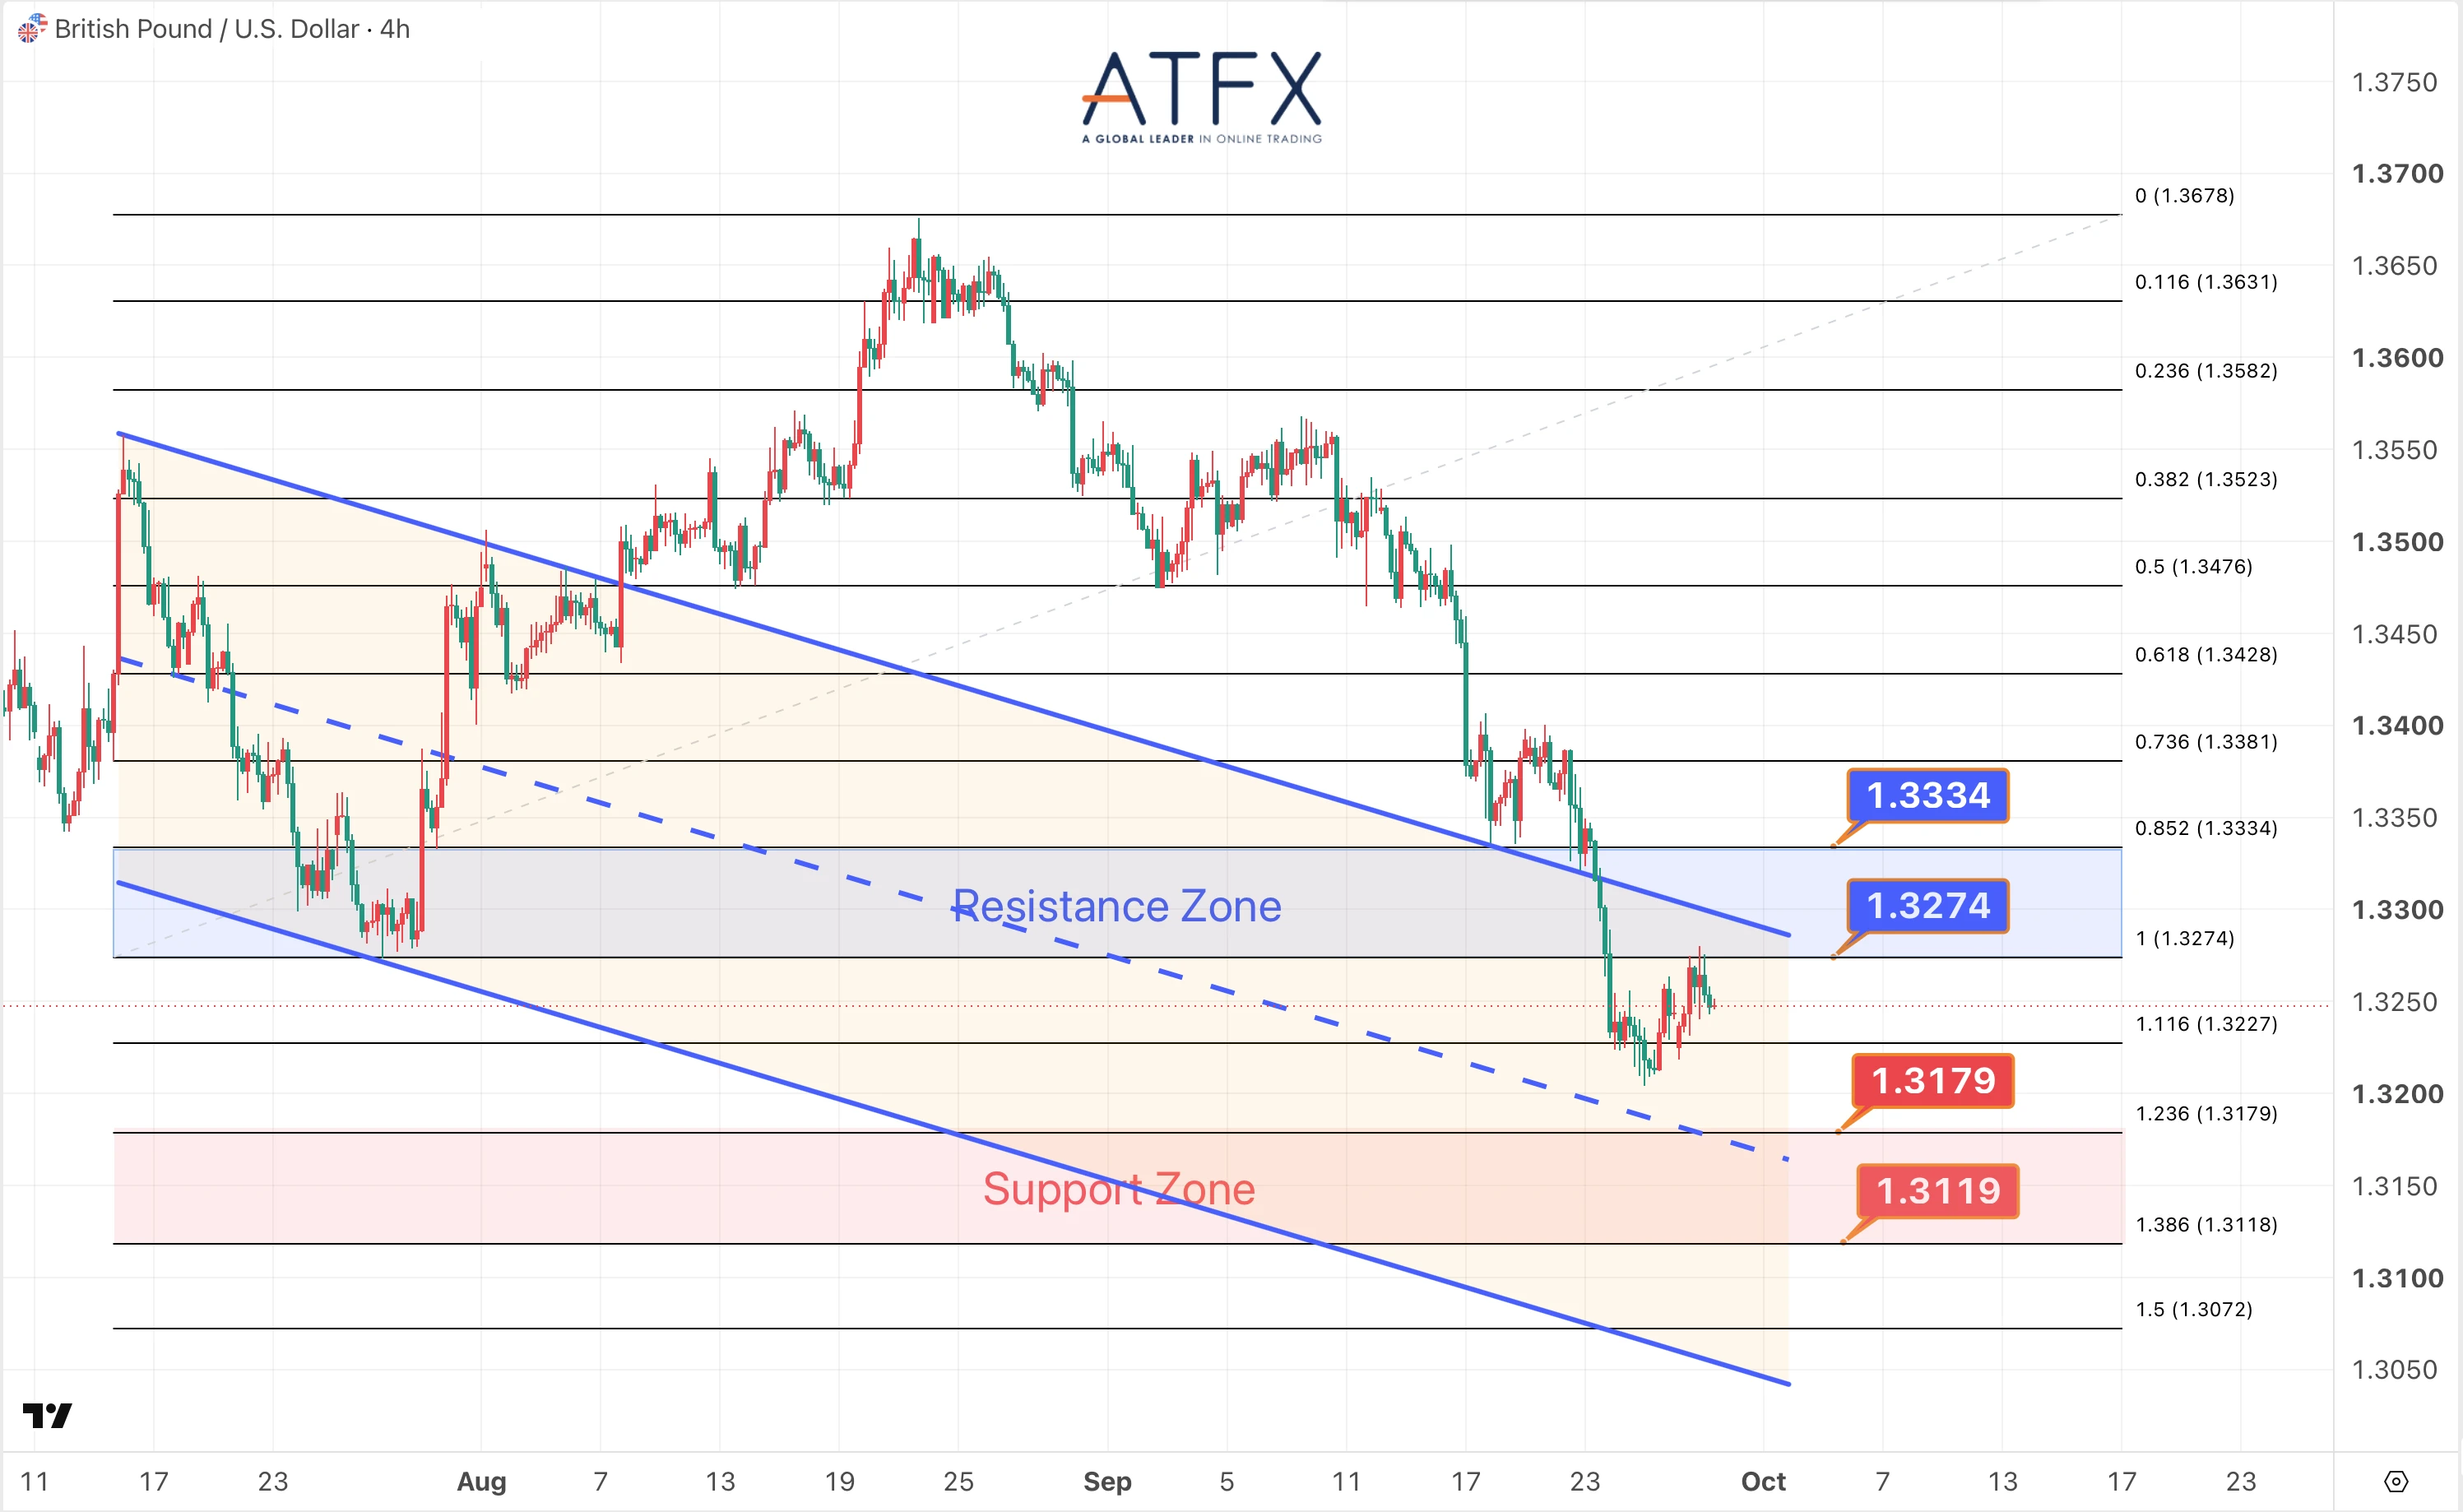
- Resistance: 1.3274/1.3334
- Support: 1.3179/1.3119
Sterling remains under pressure as US yields hit levels not seen since 2007 and markets are betting on a Fed hike in October.
Analyst View: GBP/USD is trading in a tight recent range, with limited UK catalysts until Wednesday’s final Q2 GDP. A drop below 1.3179 may test 1.3119; only a rebound above 1.3274 would reduce near-term bearish pressure.
Bias: Pressured, range-bound
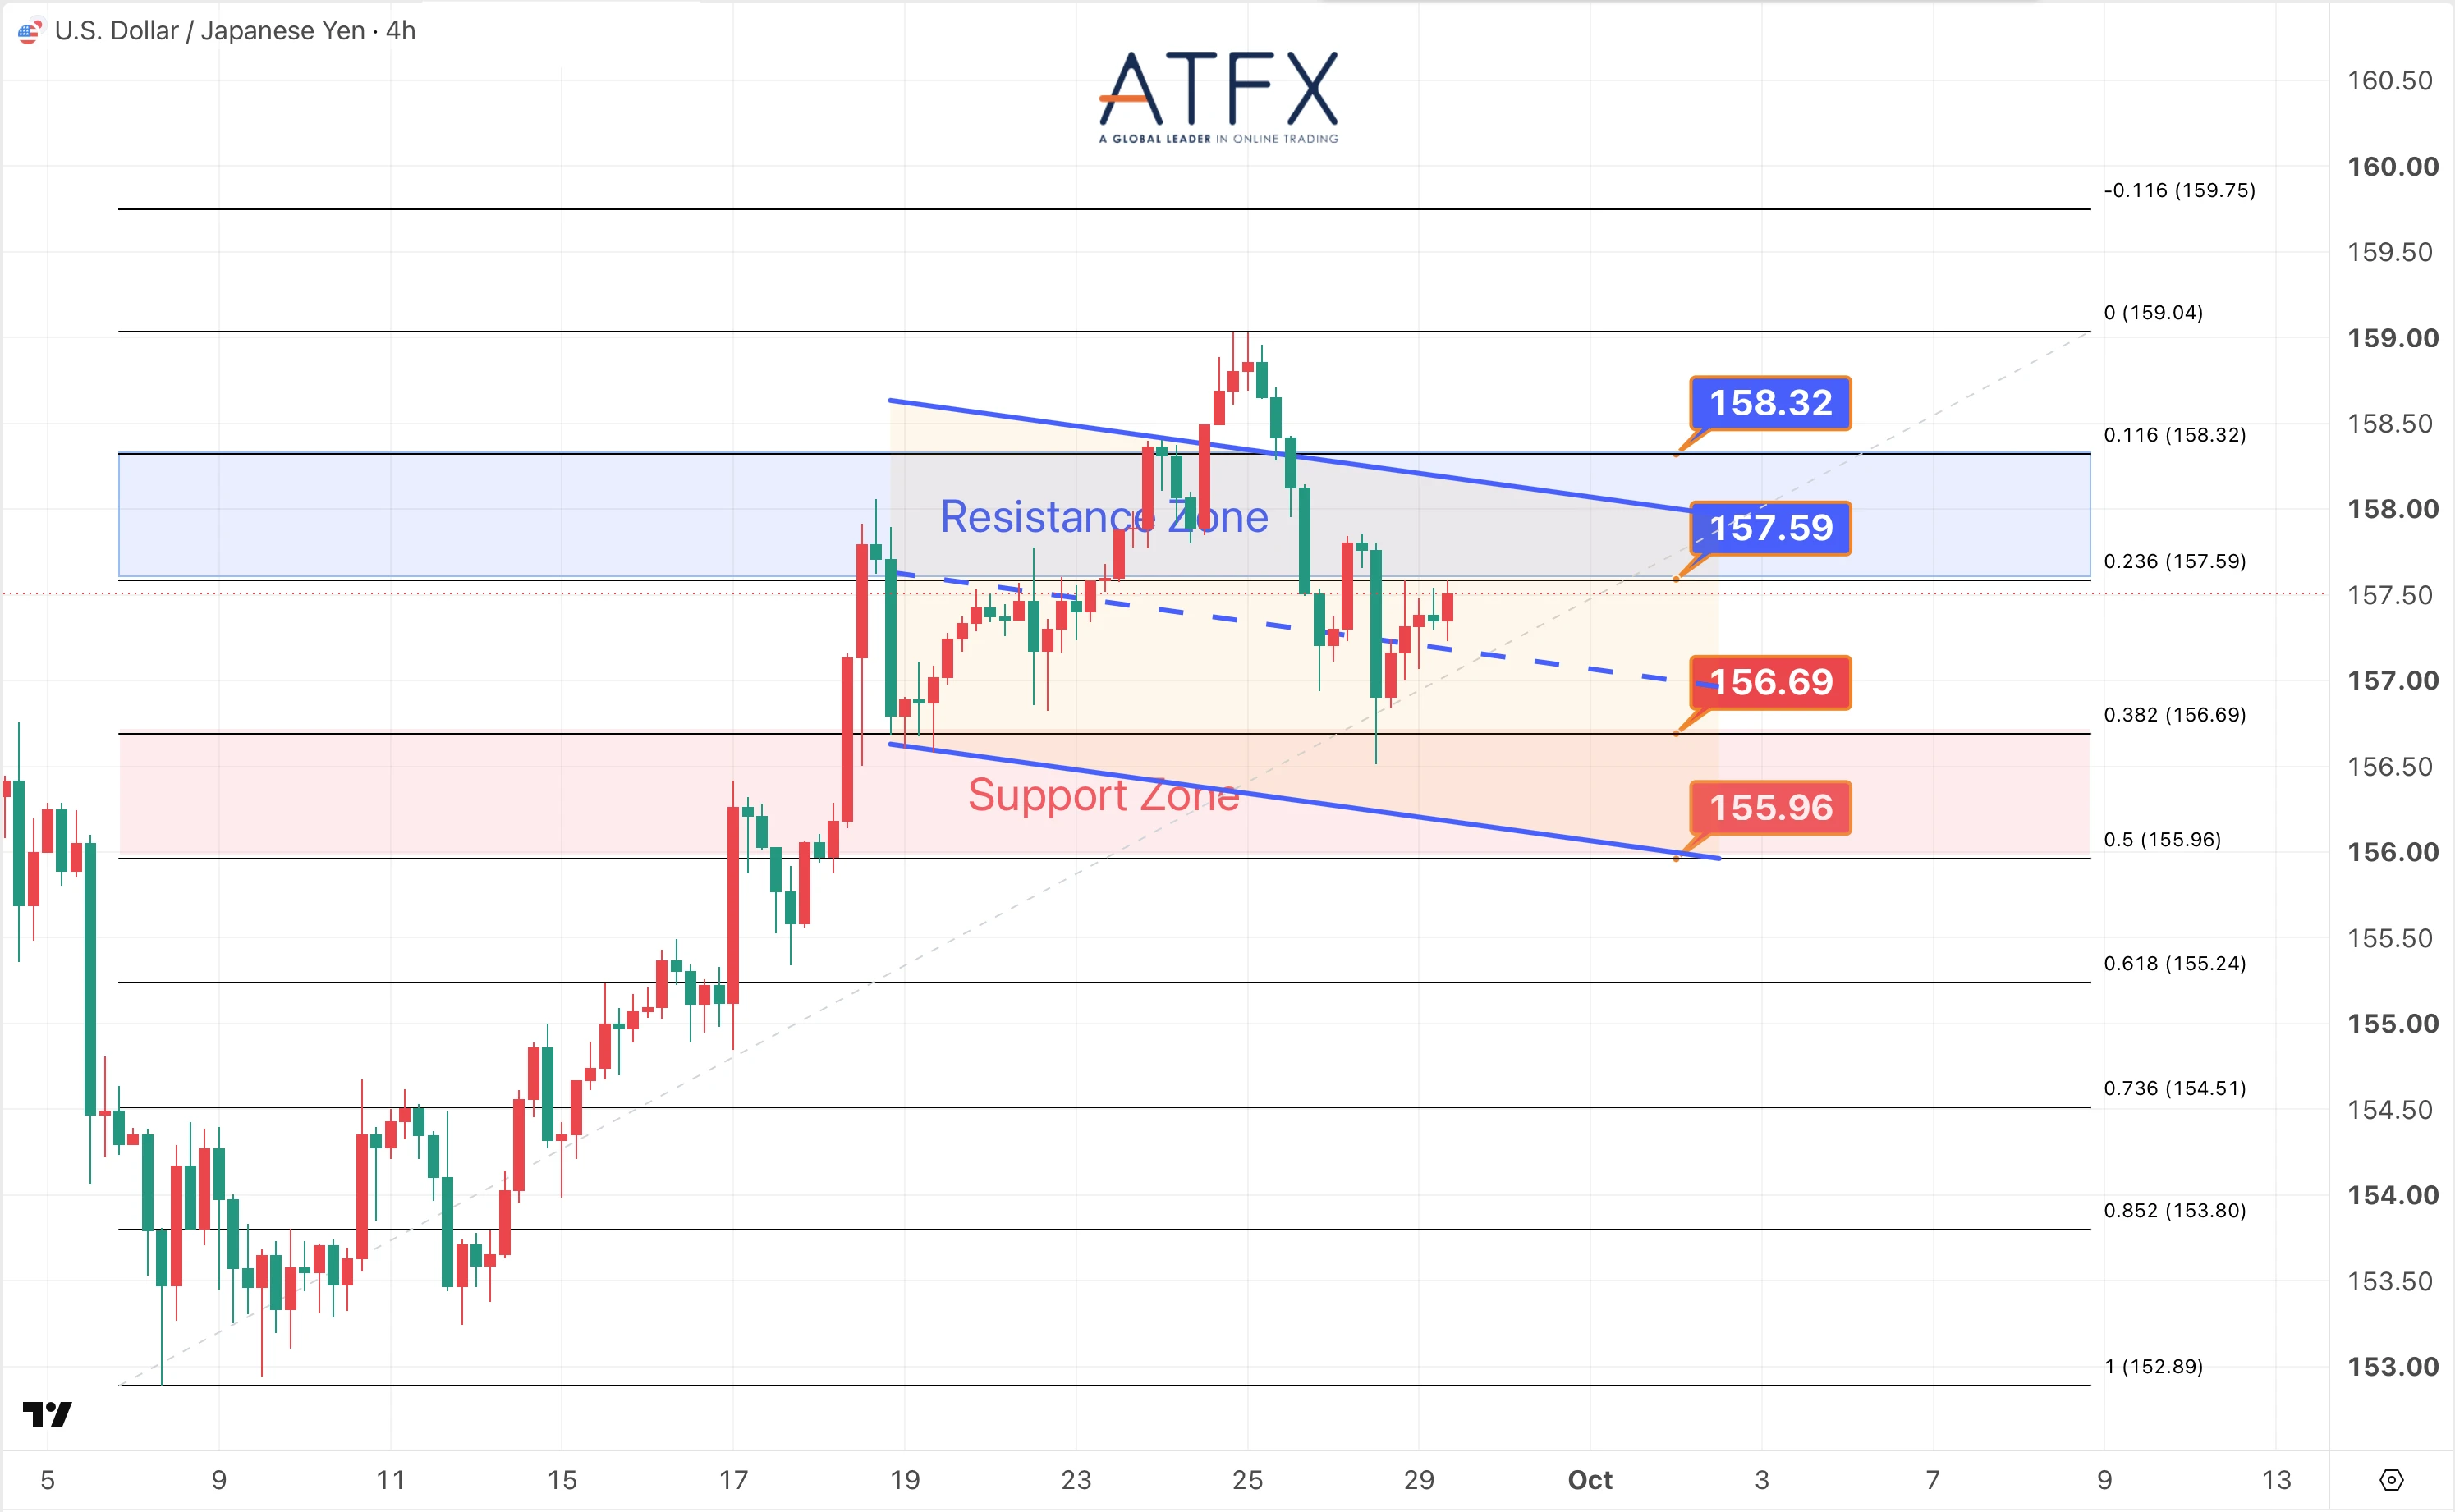
- Resistance: 157.59/158.32
- Support: 156.69/155.96
USD/JPY was flat as Japan’s currency diplomat, Atsushi Mimura, warned against excessive yen weakness, offsetting support from the US–Japan yield gap and stronger Fed hike bets.
Analyst View: Intervention risk keeps the pair capped near 159.00. A daily close below 156.50 would turn bias bearish. For now, it’s consolidating between these forces, with CME FedWatch showing roughly a 70% chance of another Fed hike in October.
Bias: Consolidating, two-way risk
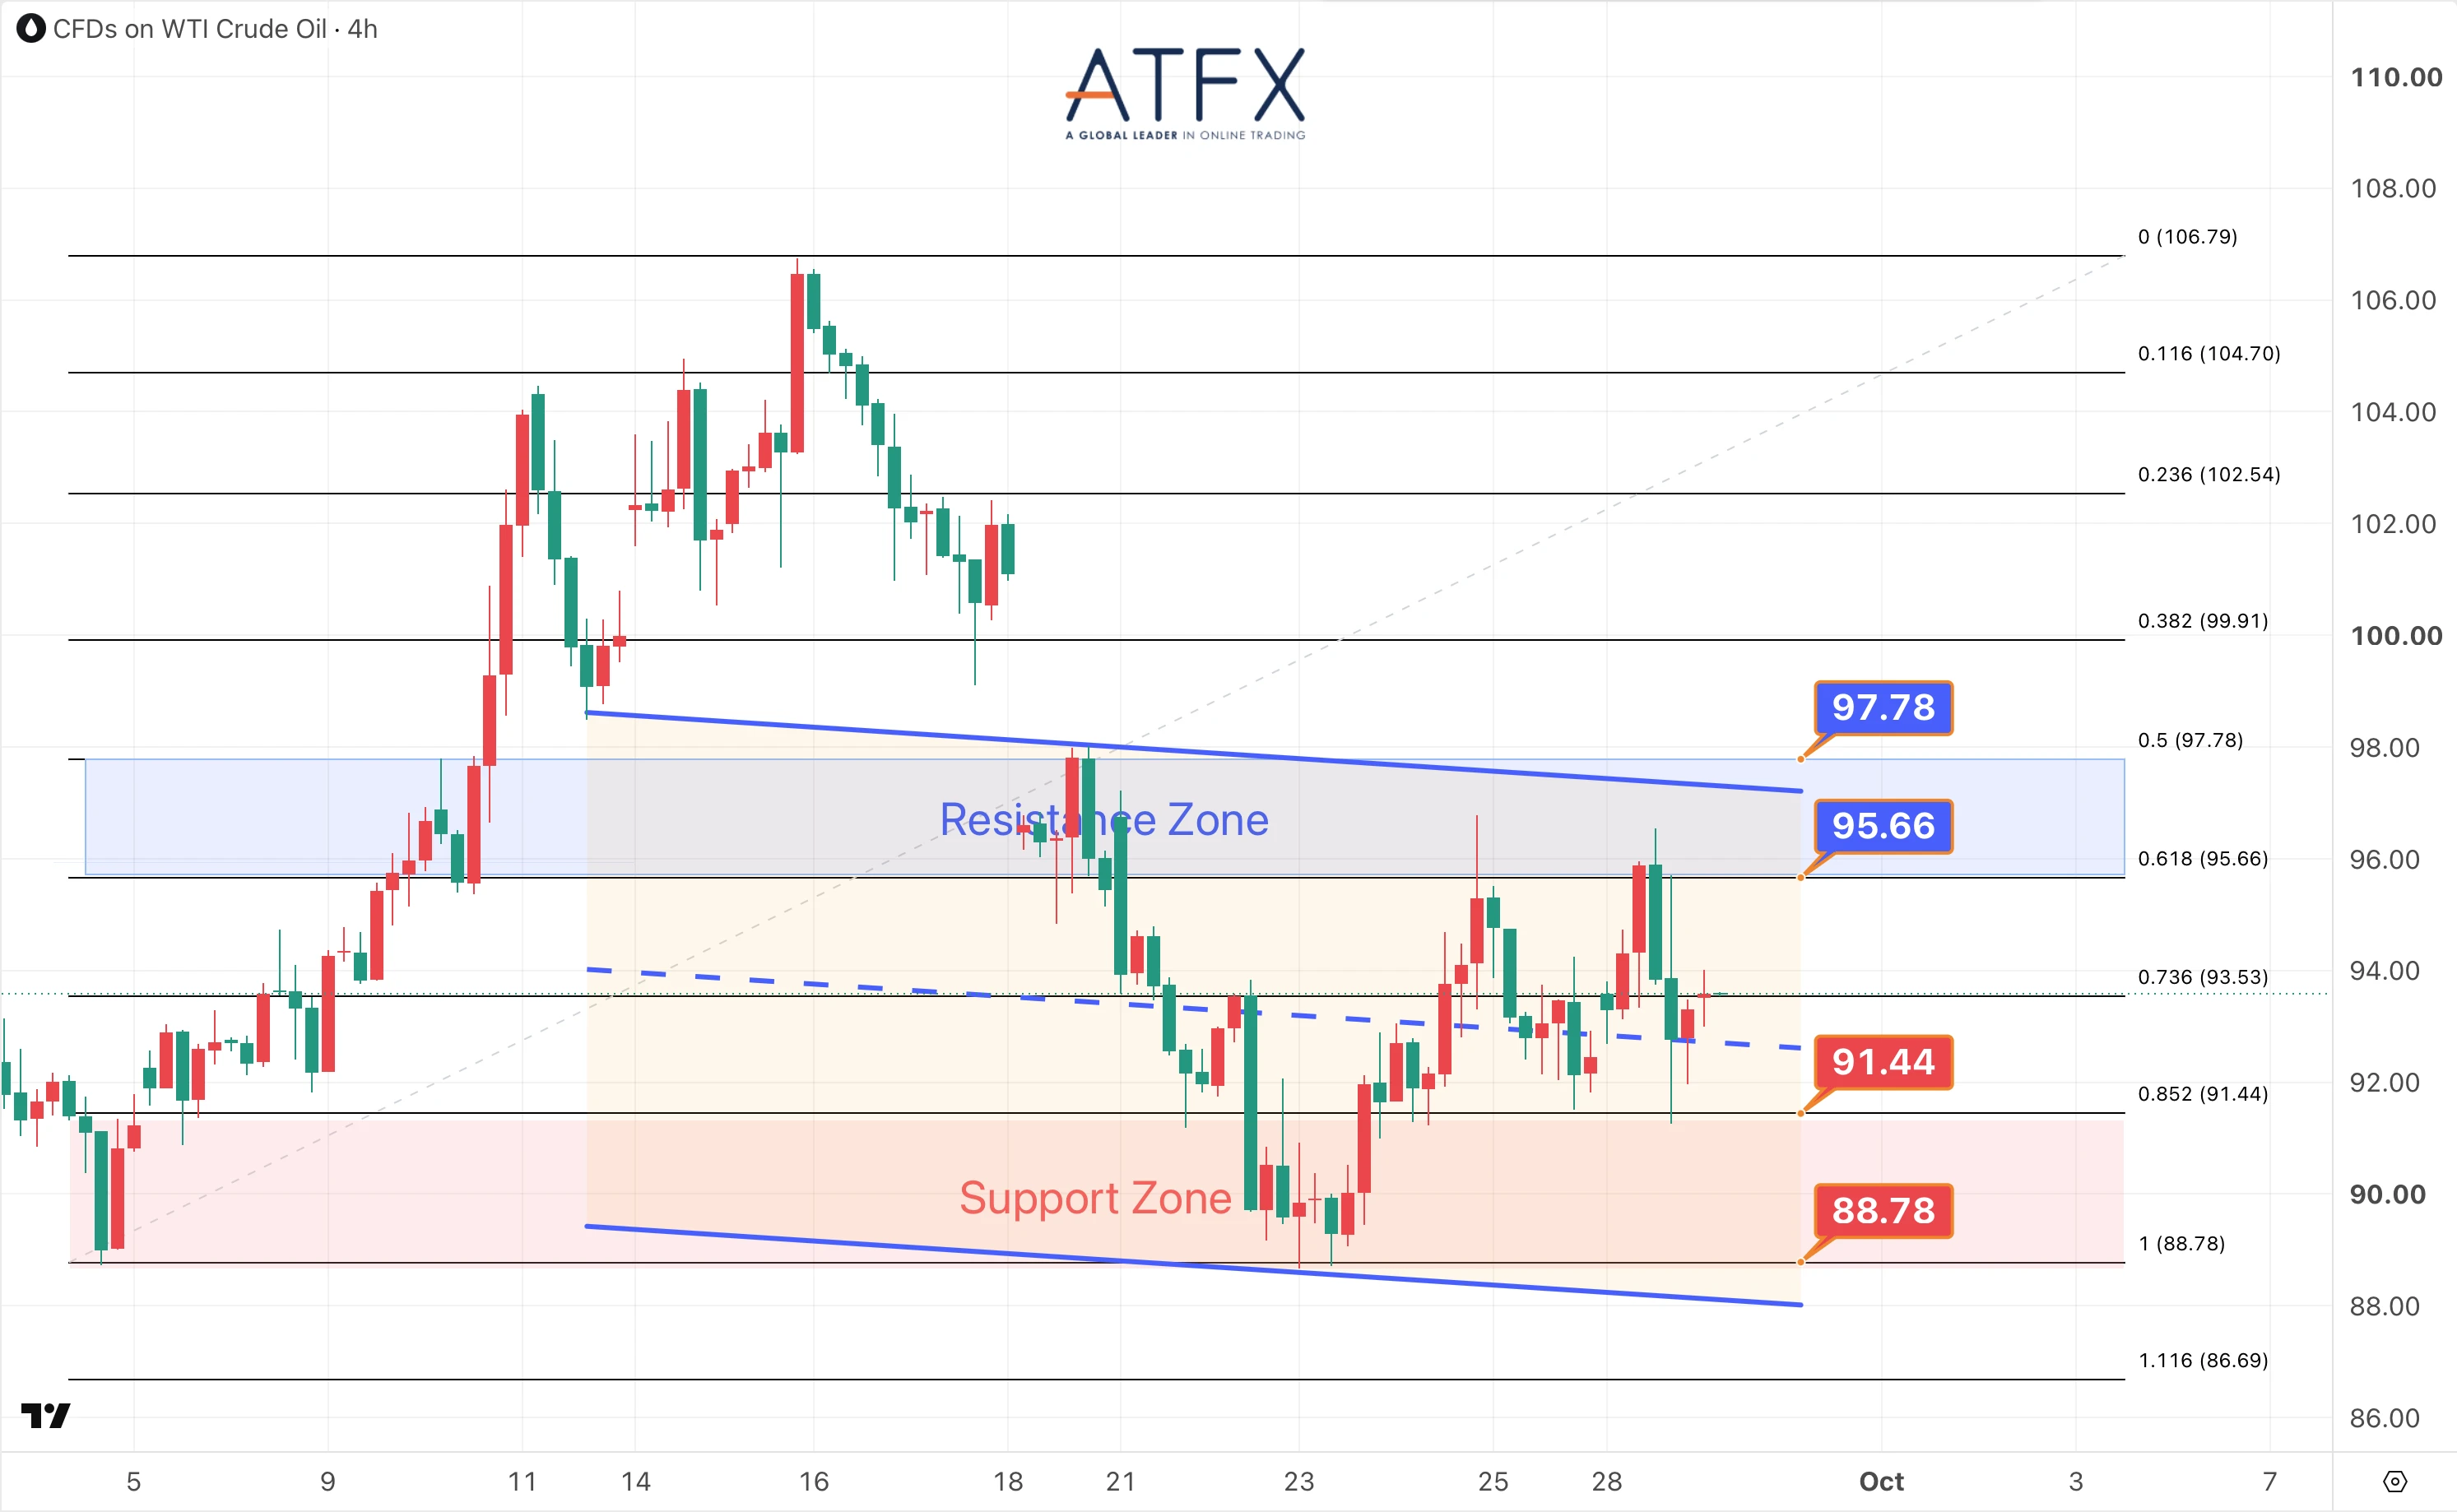
- Resistance: 95.66/97.78
- Support: 91.44/88.78
Oil rose over 1% on Monday, with WTI near $95/bbl, after Iran said it won’t relax terms for reopening the Strait of Hormuz following Trump’s rejection of its proposal. Gains eased after reports said Trump could ease sanctions for progress on Iran’s nuclear program.
Analyst View: Crude ended below session highs as markets balance ongoing Hormuz risks against renewed diplomacy. Expect choppy, headline-driven volatility around the resumption of US-Iran talks this week.
Bias: Volatile, headline-driven
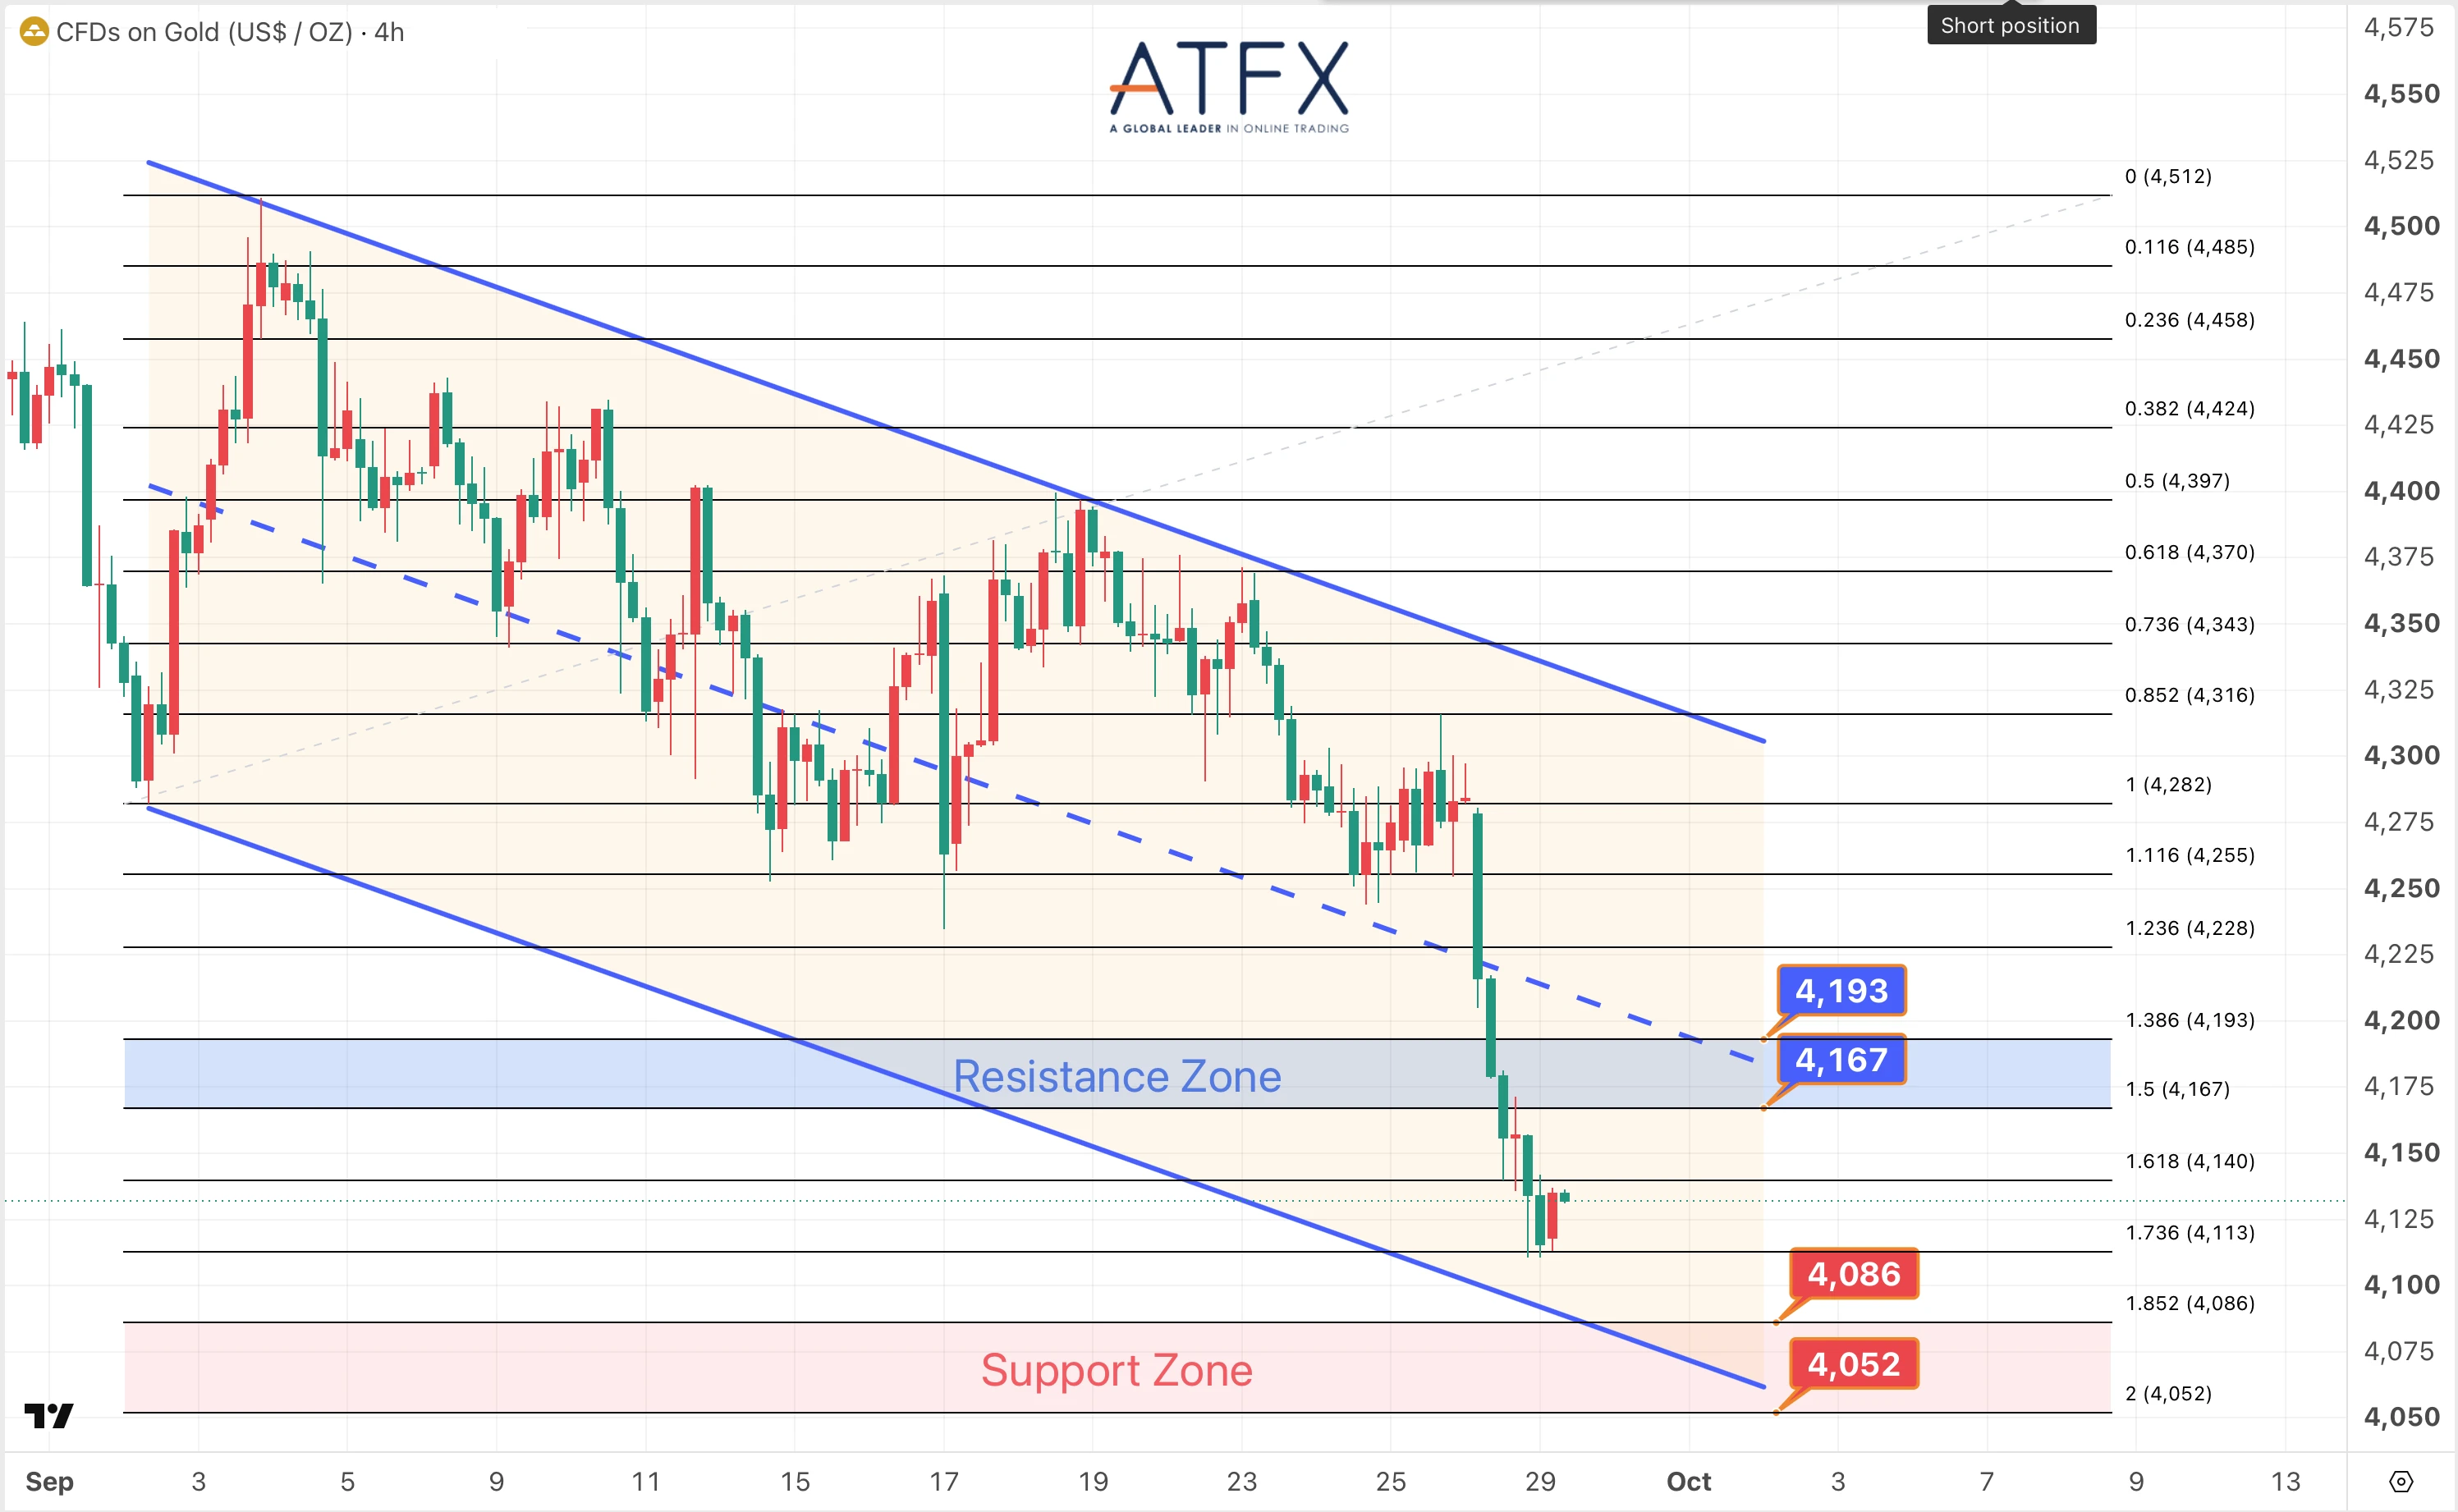
- Resistance: 4167/4193
- Support: 4086/4052
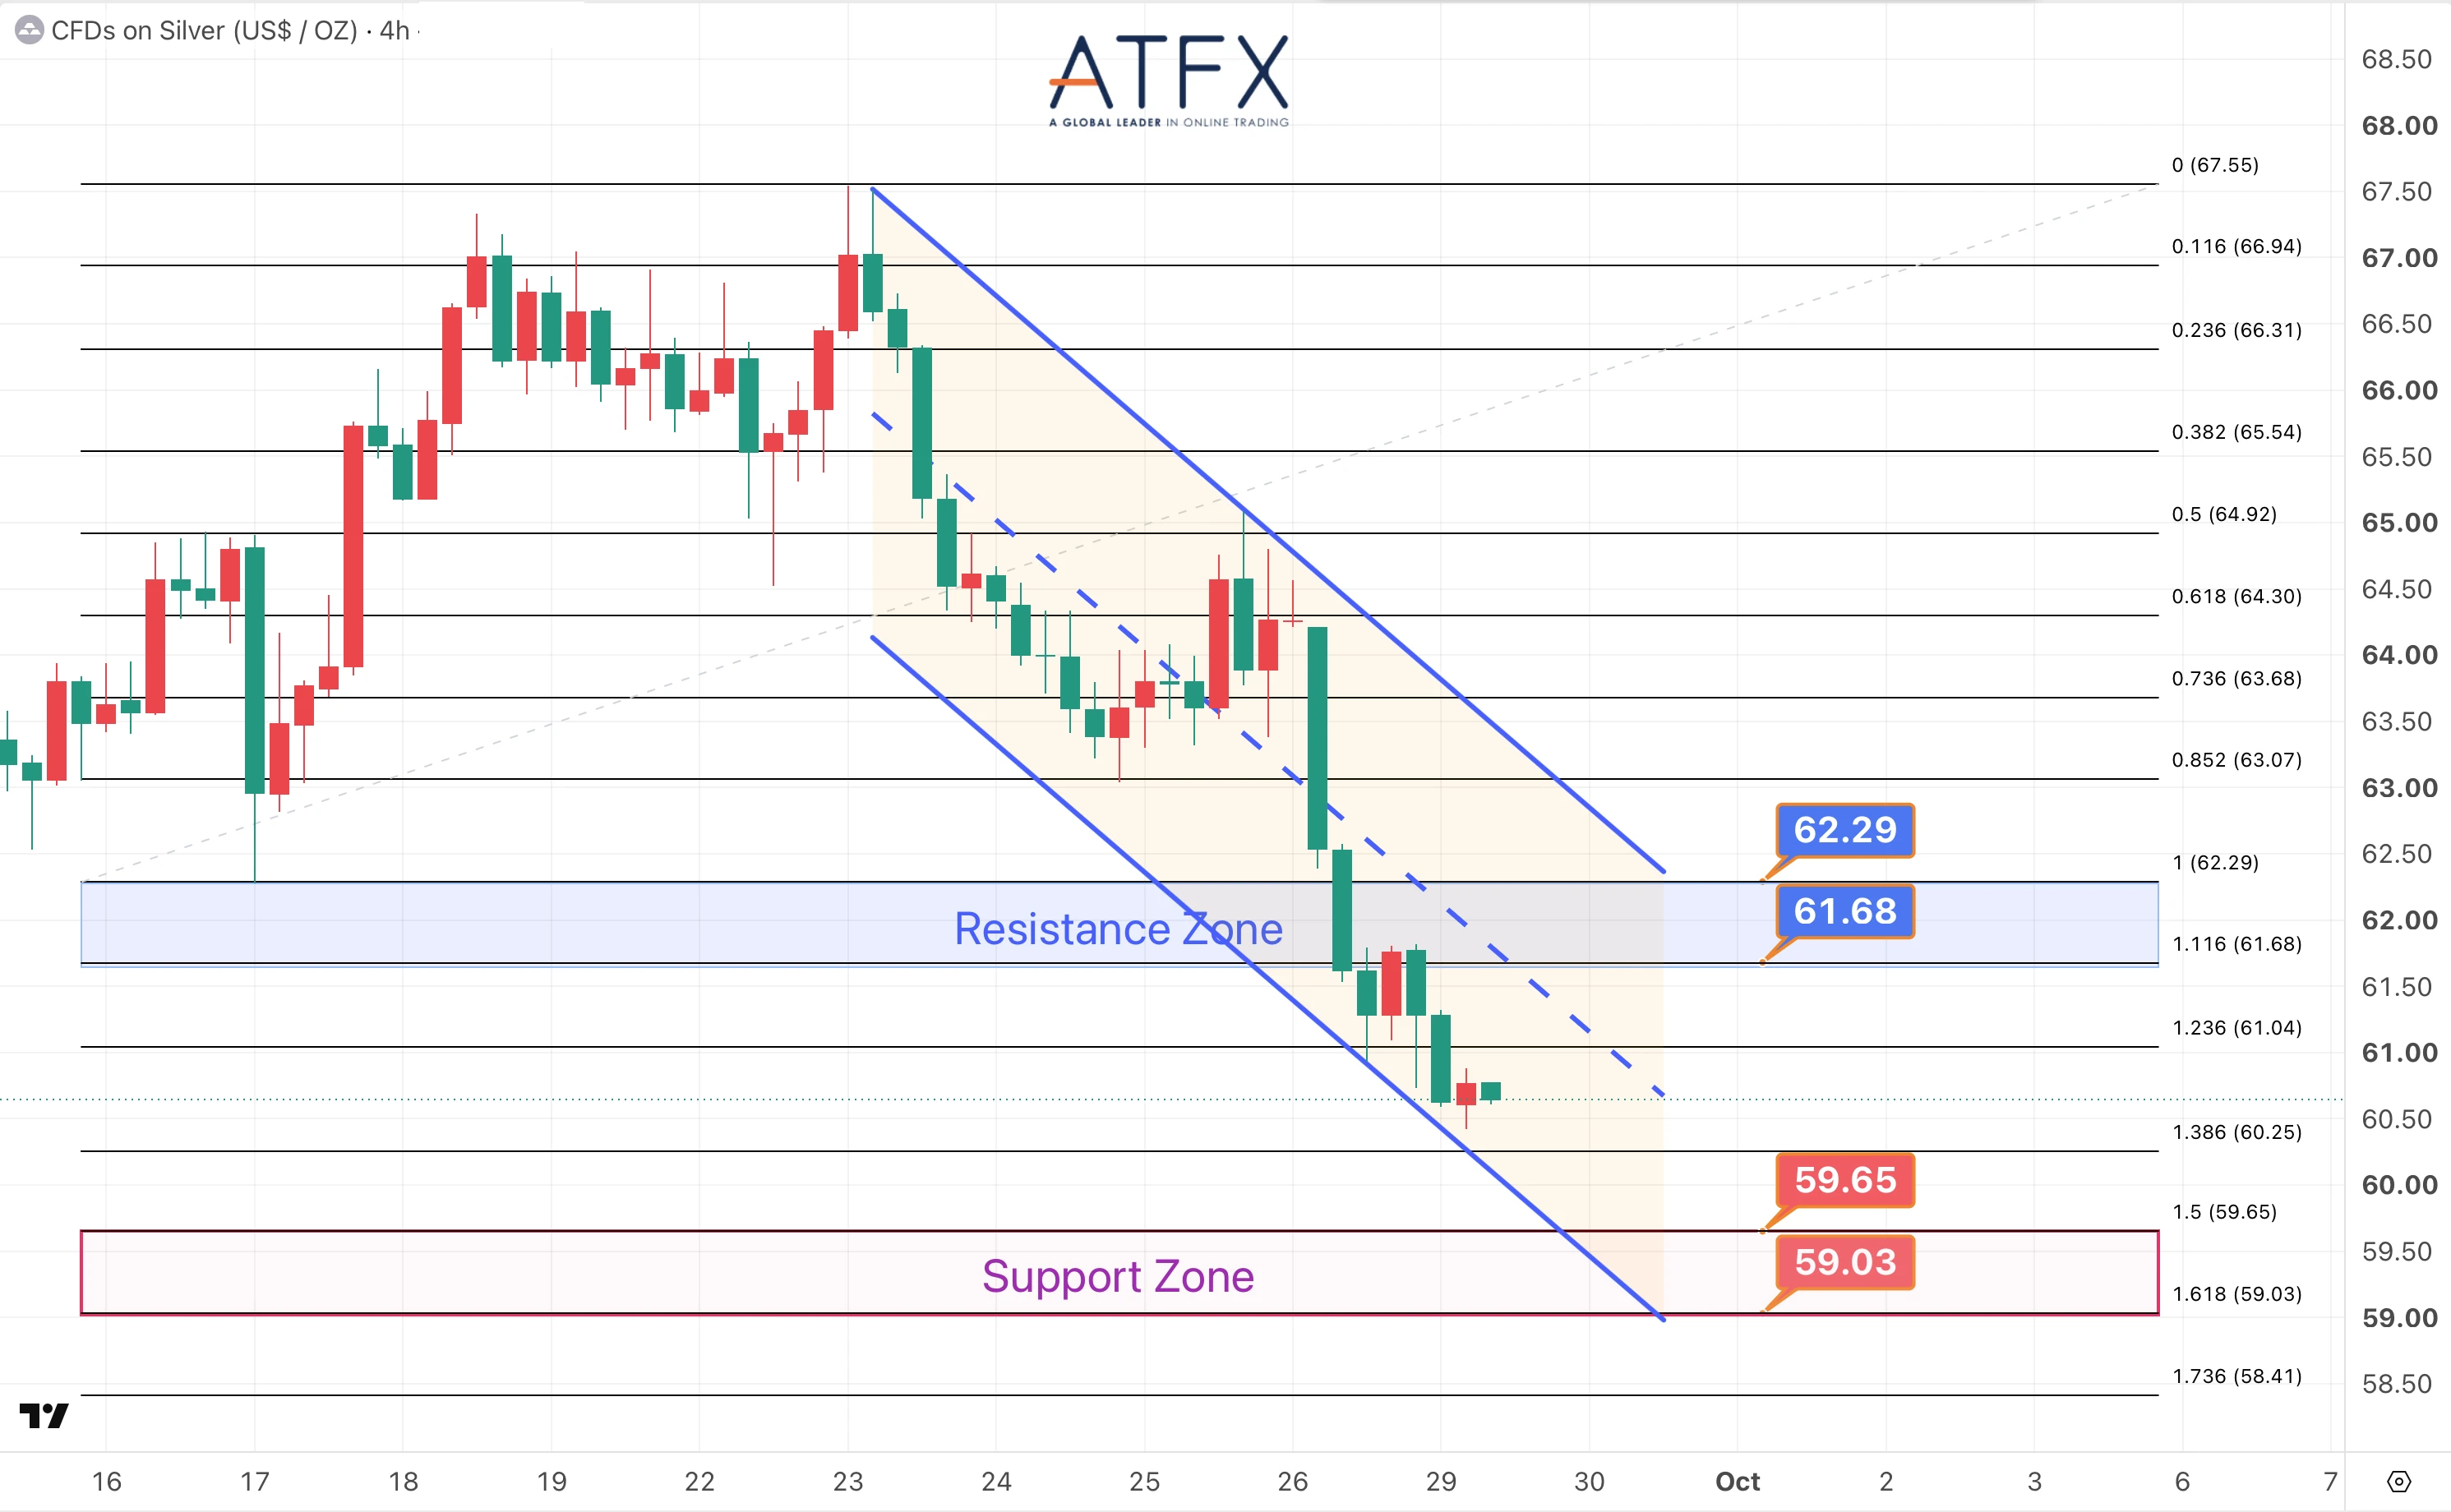
- Resistance: 61.68/62.29
- Support: 59.65/59.03
Gold dropped about 3–4% on Monday to its lowest since early August, breaking below $4,200. Higher oil prices revived inflation worries and boosted October Fed hike odds to 66–70%; a firmer dollar and rising Treasury yields added pressure. Silver also fell, slipping below $62.
Analyst View: Oil-driven inflation fears are dominating and supporting the case for further Fed tightening. Key focus is the 4,086–4,052 support zone—if it breaks, gold may retest the early-August lows.
Bias: Under heavy pressure
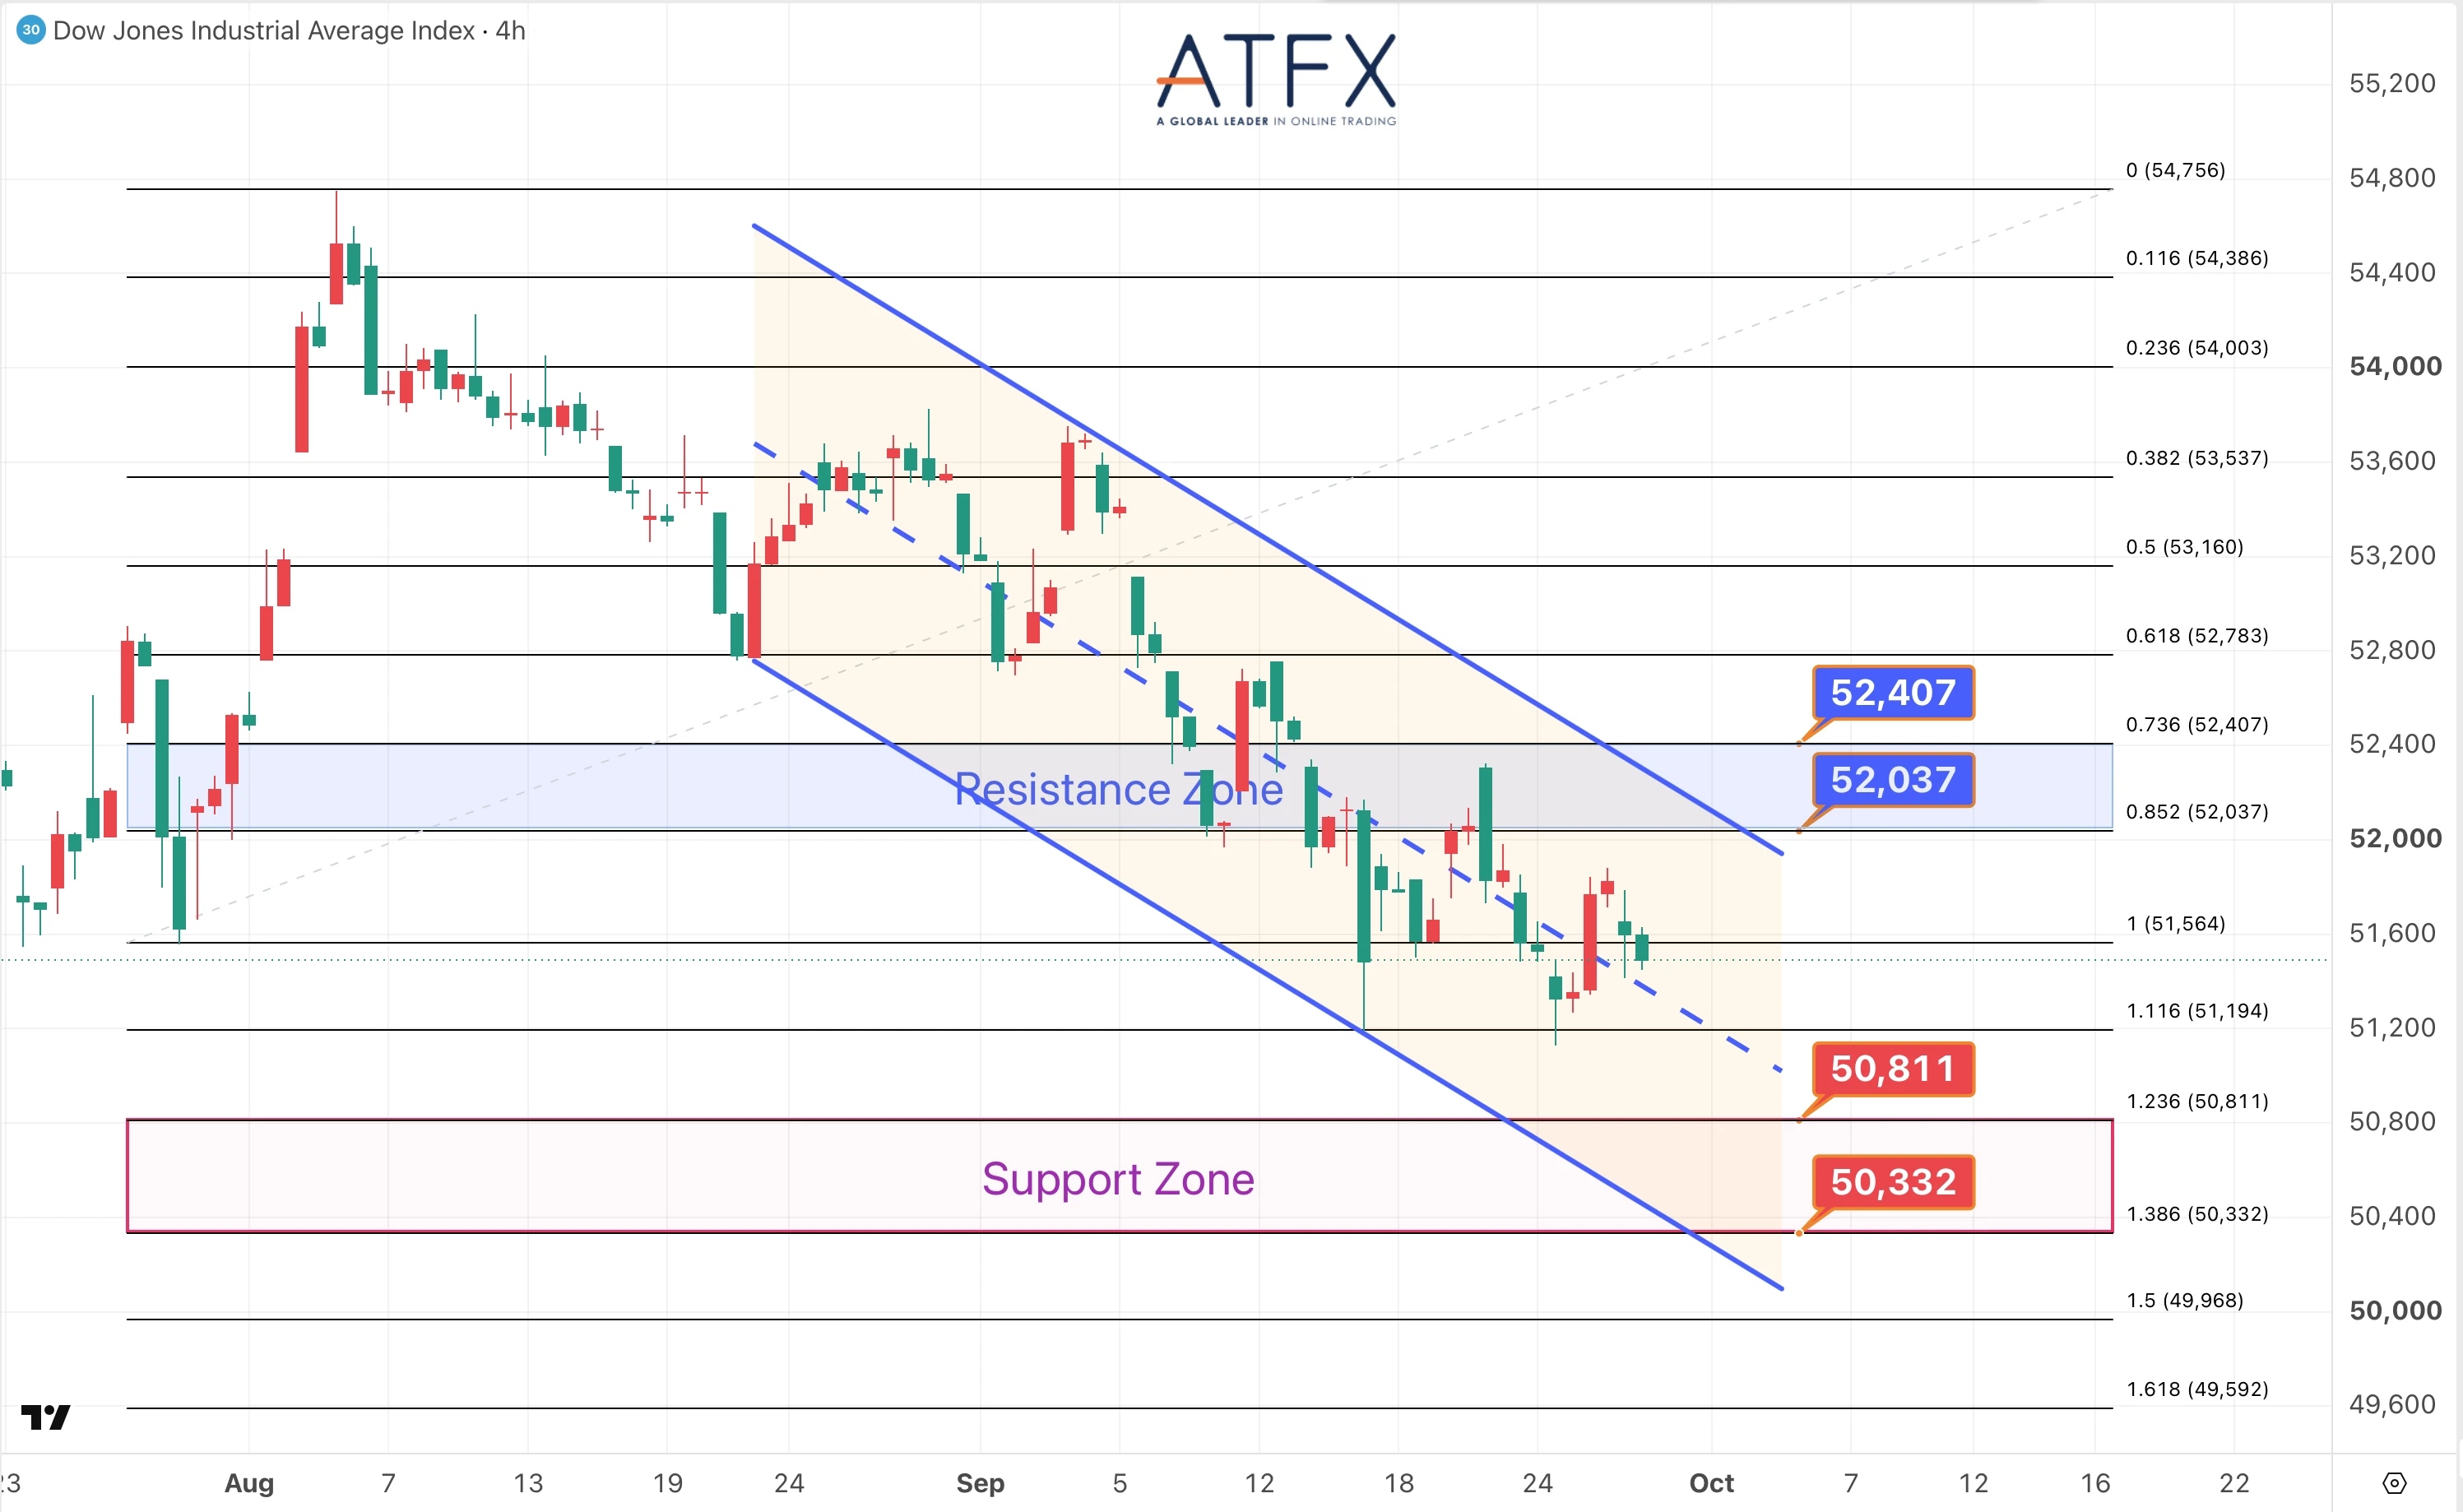
- Resistance: 52037/52407
- Support: 50811/50332
The Dow fell 0.67% to around 51,500, giving back most of Friday’s gains as Treasury yields rose to their highest levels since 2007.
Analyst View: It closed below 51,900 on inflation concerns and with PCE data and Friday’s payrolls ahead. The next direction likely depends on whether yield momentum continues.
Bias: Retreating from resistance
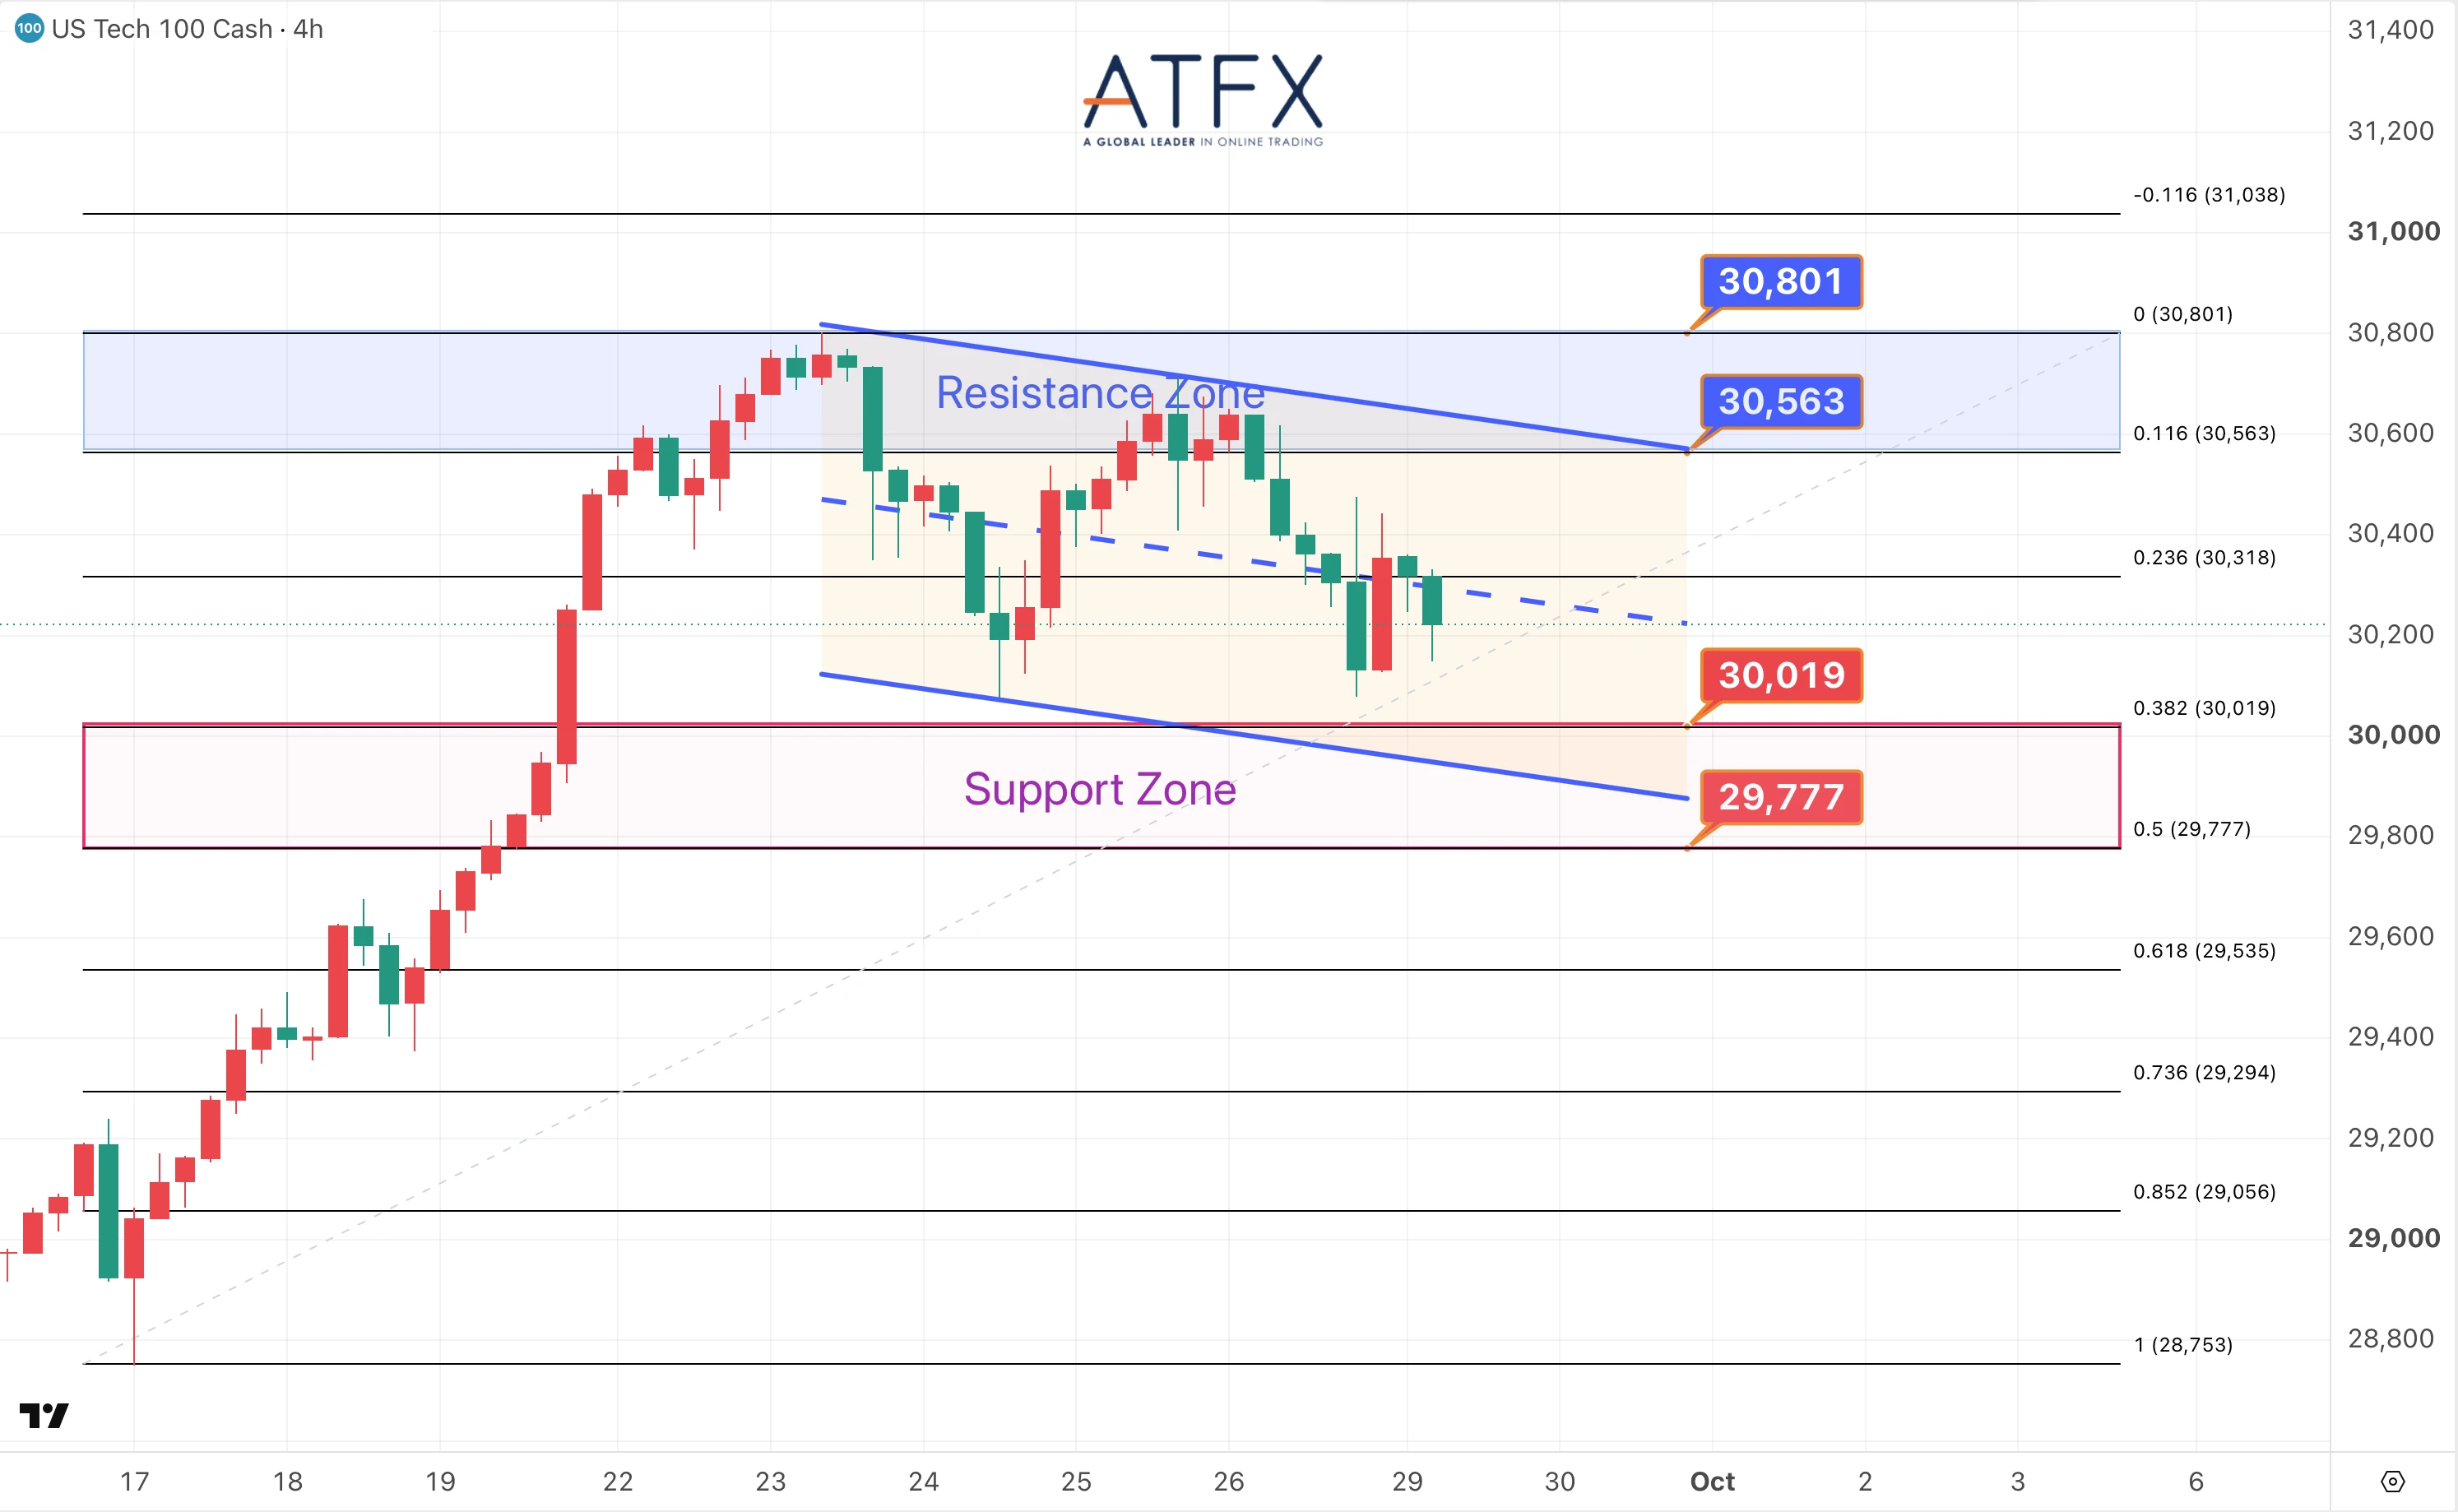
- Resistance: 30563/30801
- Support: 30019/29777
The Nasdaq fell 0.92% on Monday after OpenAI said it paused training and evaluation of some advanced models following cases of unexpected agent behavior, reviving concerns about the speed of AI development.
Analyst View: Chipmakers led the drop as OpenAI news added to pressure from rising Treasury yields and the unresolved Iran standoff. Key to watch is whether the index can hold the 30,019–29,777 support band; a break would signal further downside in the AI-led pullback.
Bias: Pressured by AI-safety concerns
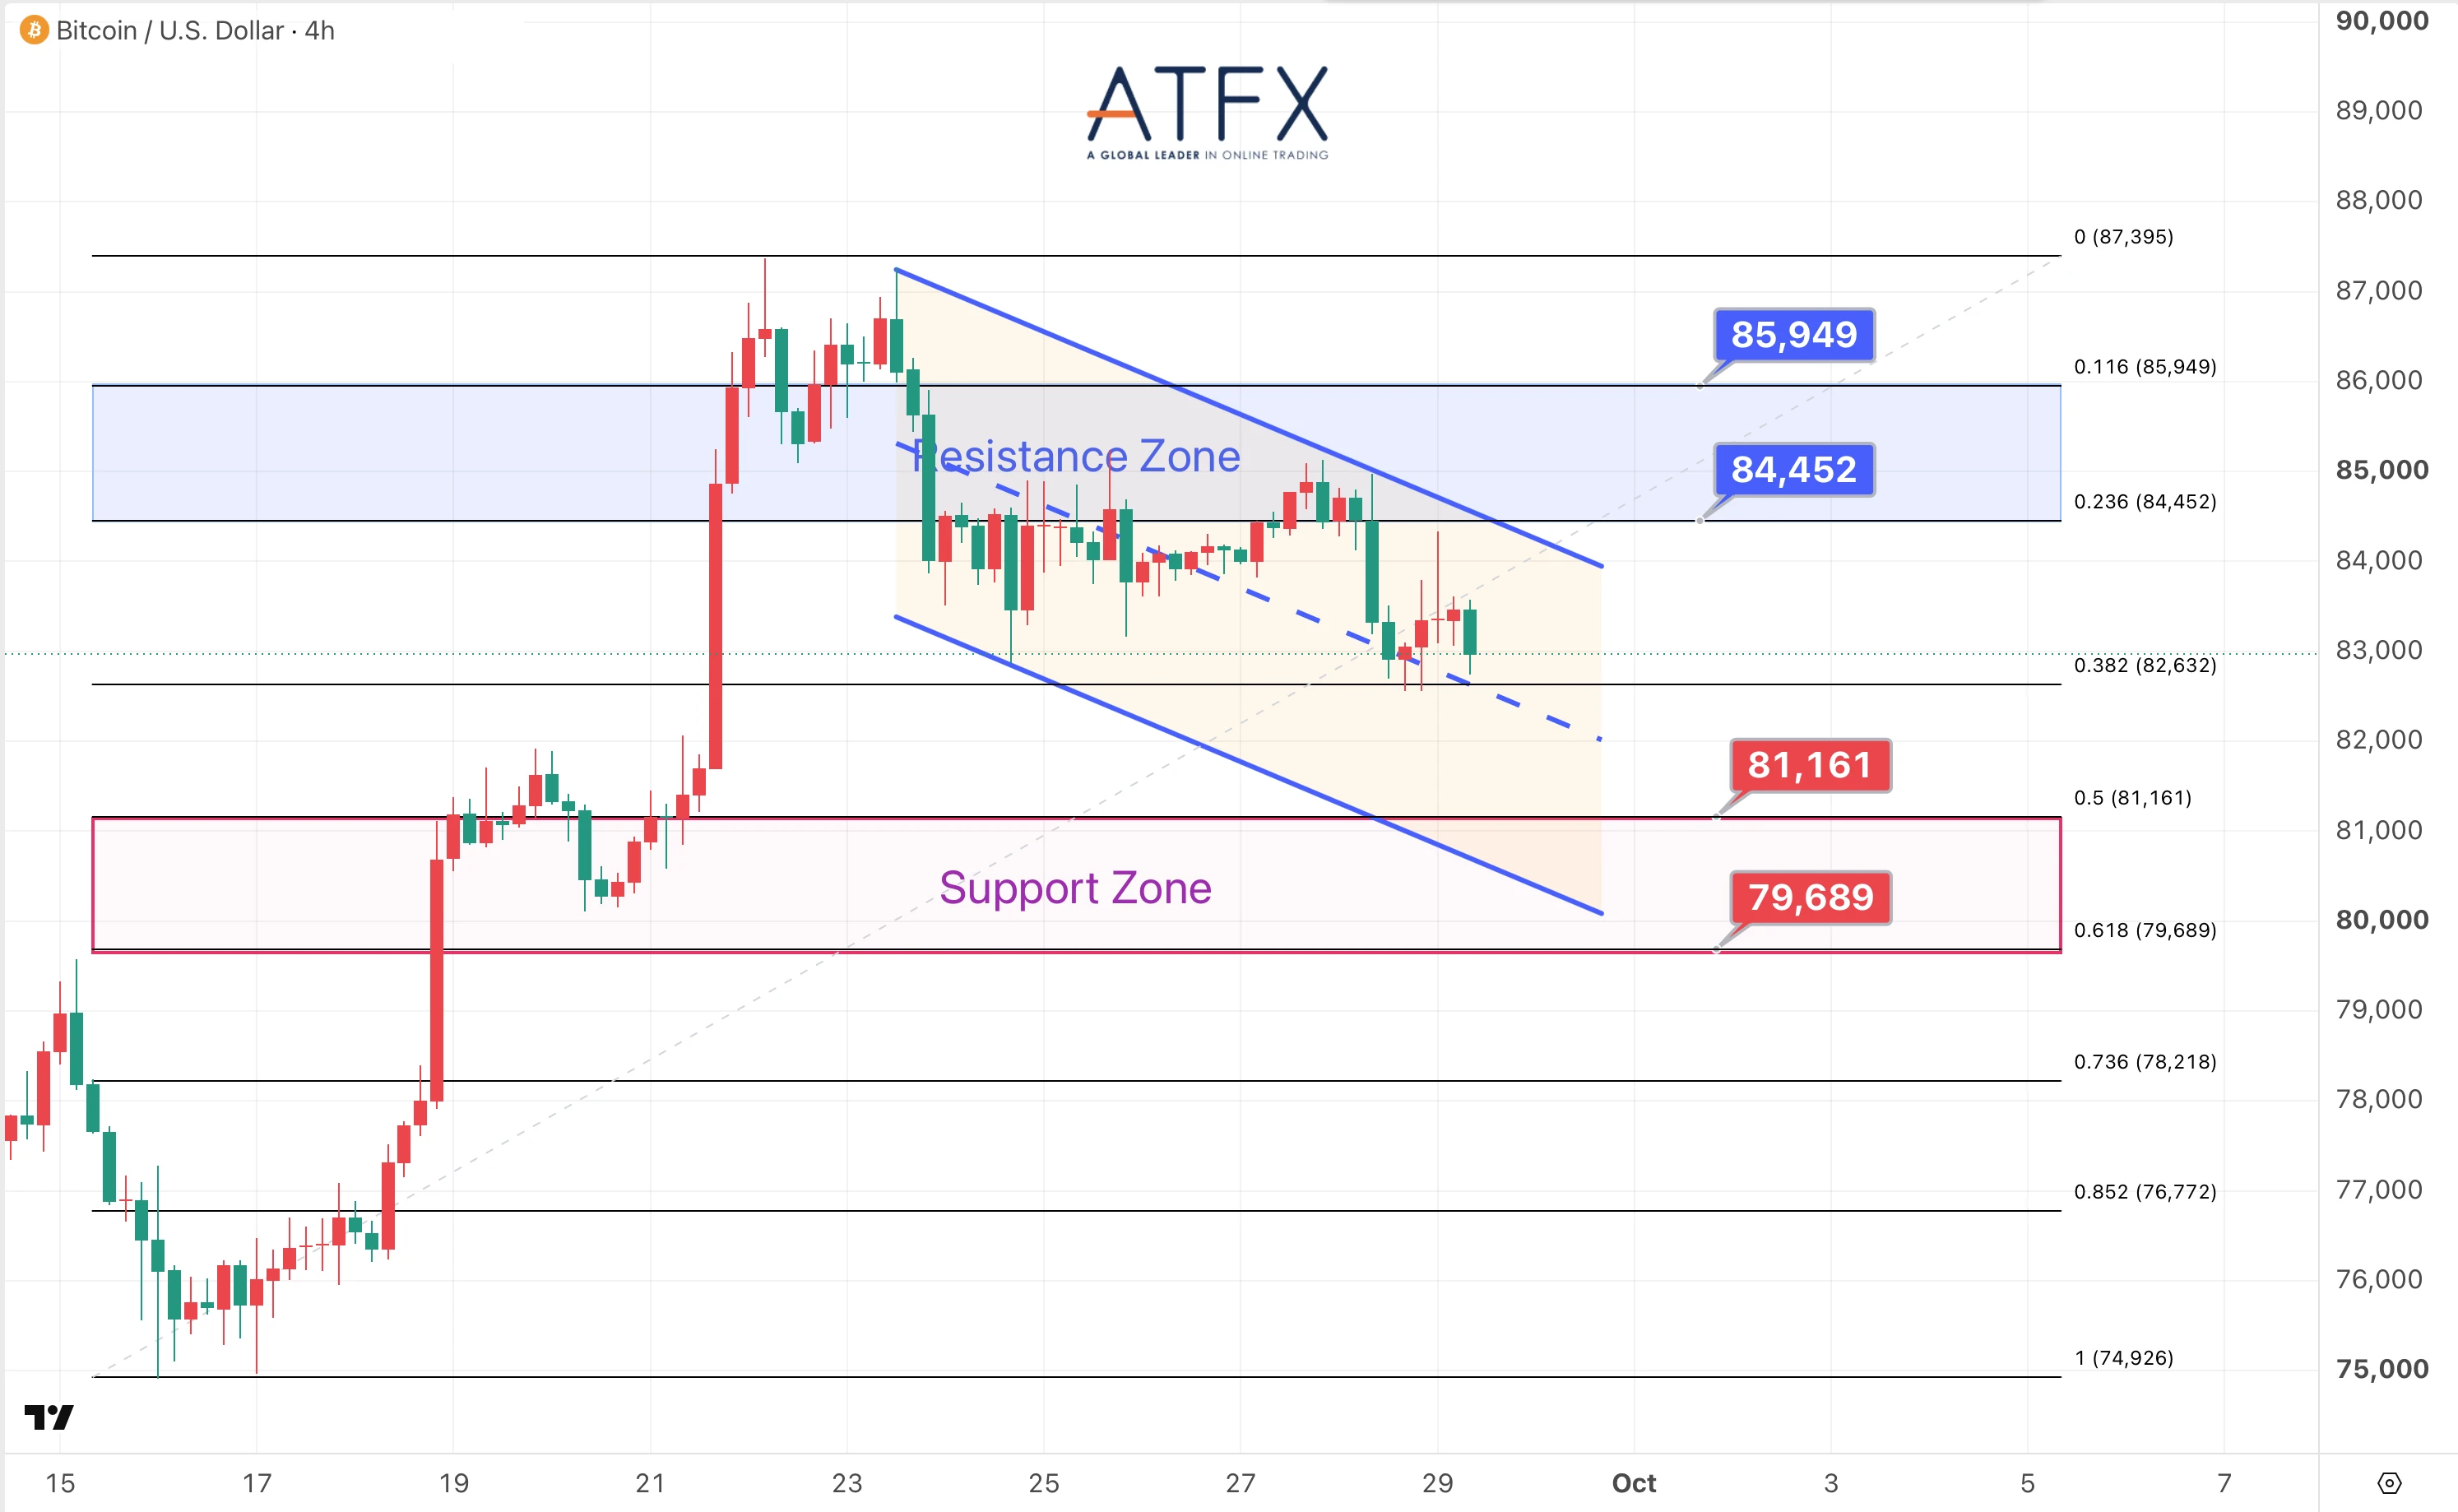
- Resistance: 84452/85949
- Support: 81161/79689
Bitcoin fell more than 1% to about $83,000, extending weekend losses after rising Treasury yields and stalled US-Iran peace talks dented risk appetite. BTC also failed to stay above $87,000, though US spot Bitcoin ETFs saw strong inflows of $2.39B over the prior five trading days.
Analyst View: MFI and KST still point to underlying buying pressure, but it’s fading—suggesting profit-taking rather than a full trend reversal. Holding the 81,161–79,689 support band keeps recovery intact and could retest 84,452–85,949 resistance; a break increases the risk of a deeper pullback.
Bias: Consolidating after pullback
Disclaimer: This analysis is for informational purposes only. Happy trading!