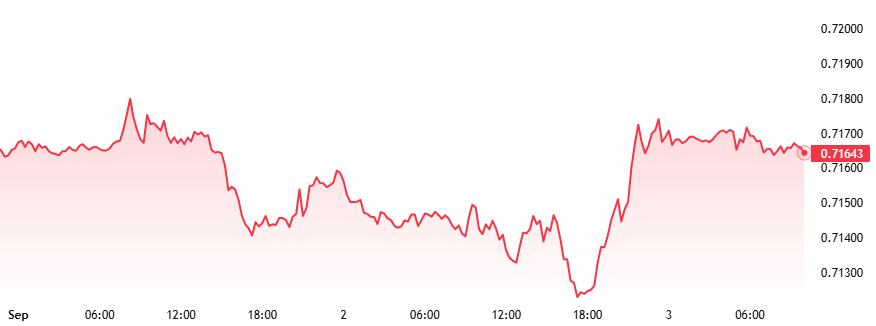


Key Takeaways:
Today’s Focus: Today’s focus is Germany’s industrial production at 14:00 (GMT+8), followed by US EIA crude inventories at 22:30 (GMT+8) and one-year consumer inflation expectations at 23:00 (GMT+8). A production rebound could support the euro; a Lower-than-expected oil inventory draw could strengthen WTI’s price. US NY Fed 1-Year Consumer Inflation Expectations in focus; higher inflation expectations would reinforce concerns about further Fed tightening, potentially lifting the dollar and yields while weighing on gold and equities. |
Global Market Review 07/10/2026
- Reduced expectations for an immediate Fed hike supported equities ahead of third-quarter earnings, with the S&P 500 and Nasdaq reaching fresh highs.
- EUR/USD recovered as French bond pressures eased and the dollar weakened.
- The yen struggled to benefit from comments supporting future BoJ hikes.
- Gold rebounded regardless of higher yields, while oil remained supported by supply uncertainty.
- Bitcoin’s recovery remained limited by still-elevated borrowing costs.
Economic Calendar
Key Events on October 7 (GMT+8)
- China Holiday – National Day Golden Week (final day)
| Time (GMT+8) | Event | Importance |
|---|---|---|
| 14:00 | Germany Industrial Production MoM AUG | ** |
| 22:30 | US EIA Crude Oil Stocks Change | ** |
| 23:00 | US NY Fed 1-Year Consumer Inflation Expectations SEP | ** |
Key Events on October 8 (GMT+8)
| Time (GMT+8) | Event | Importance |
|---|---|---|
| 02:00 | US FOMC Minutes – Watch Fed policy outlook | *** |
| 14:00 | Germany Balance of Trade AUG | ** |
| 20:30 | US Initial Jobless Claims | ** |
Markets Analysis 07/10/2026
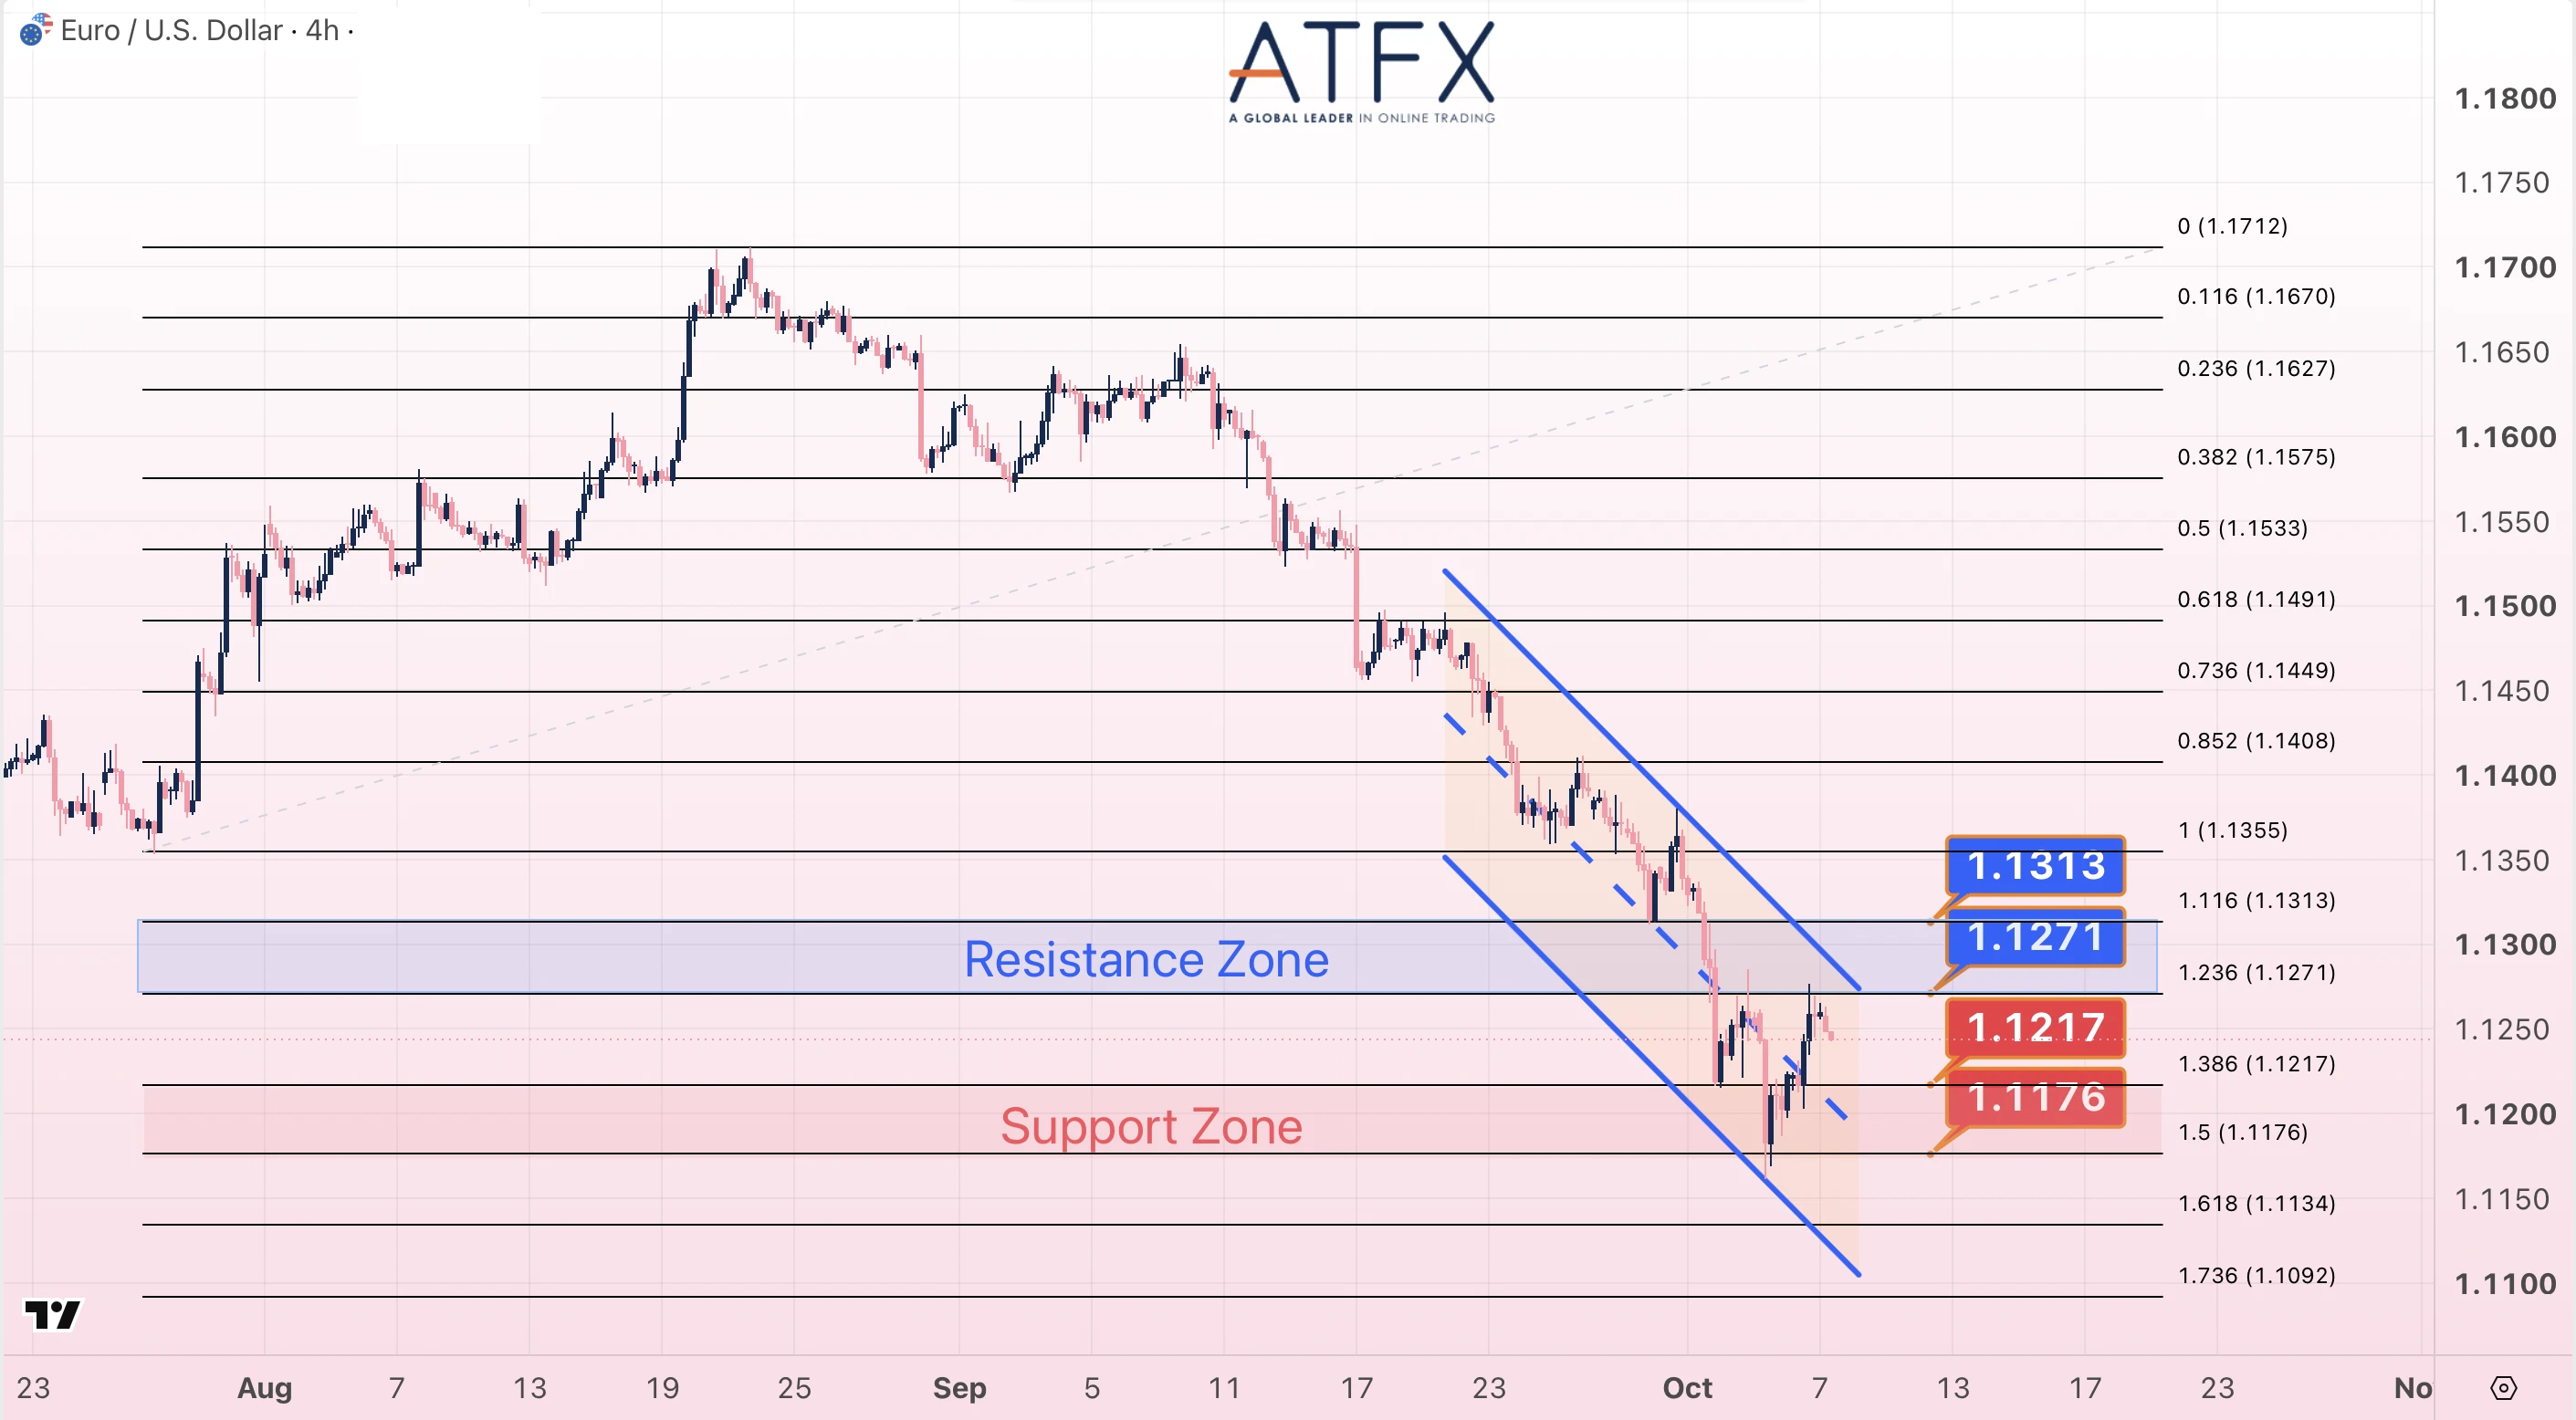
- Resistance: 1.1271 / 1.1313
- Support: 1.1217 / 1.1176
Analyst View: The 4H chart shows a rebound within a falling channel, with price below the 1.1271–1.1313 resistance zone. Stronger German production could support another test of resistance. A break above 1.1313 would strengthen the recovery; failure to hold 1.1217 would expose 1.1176.
Bias: Short-term recovery; broader downtrend remains intact.
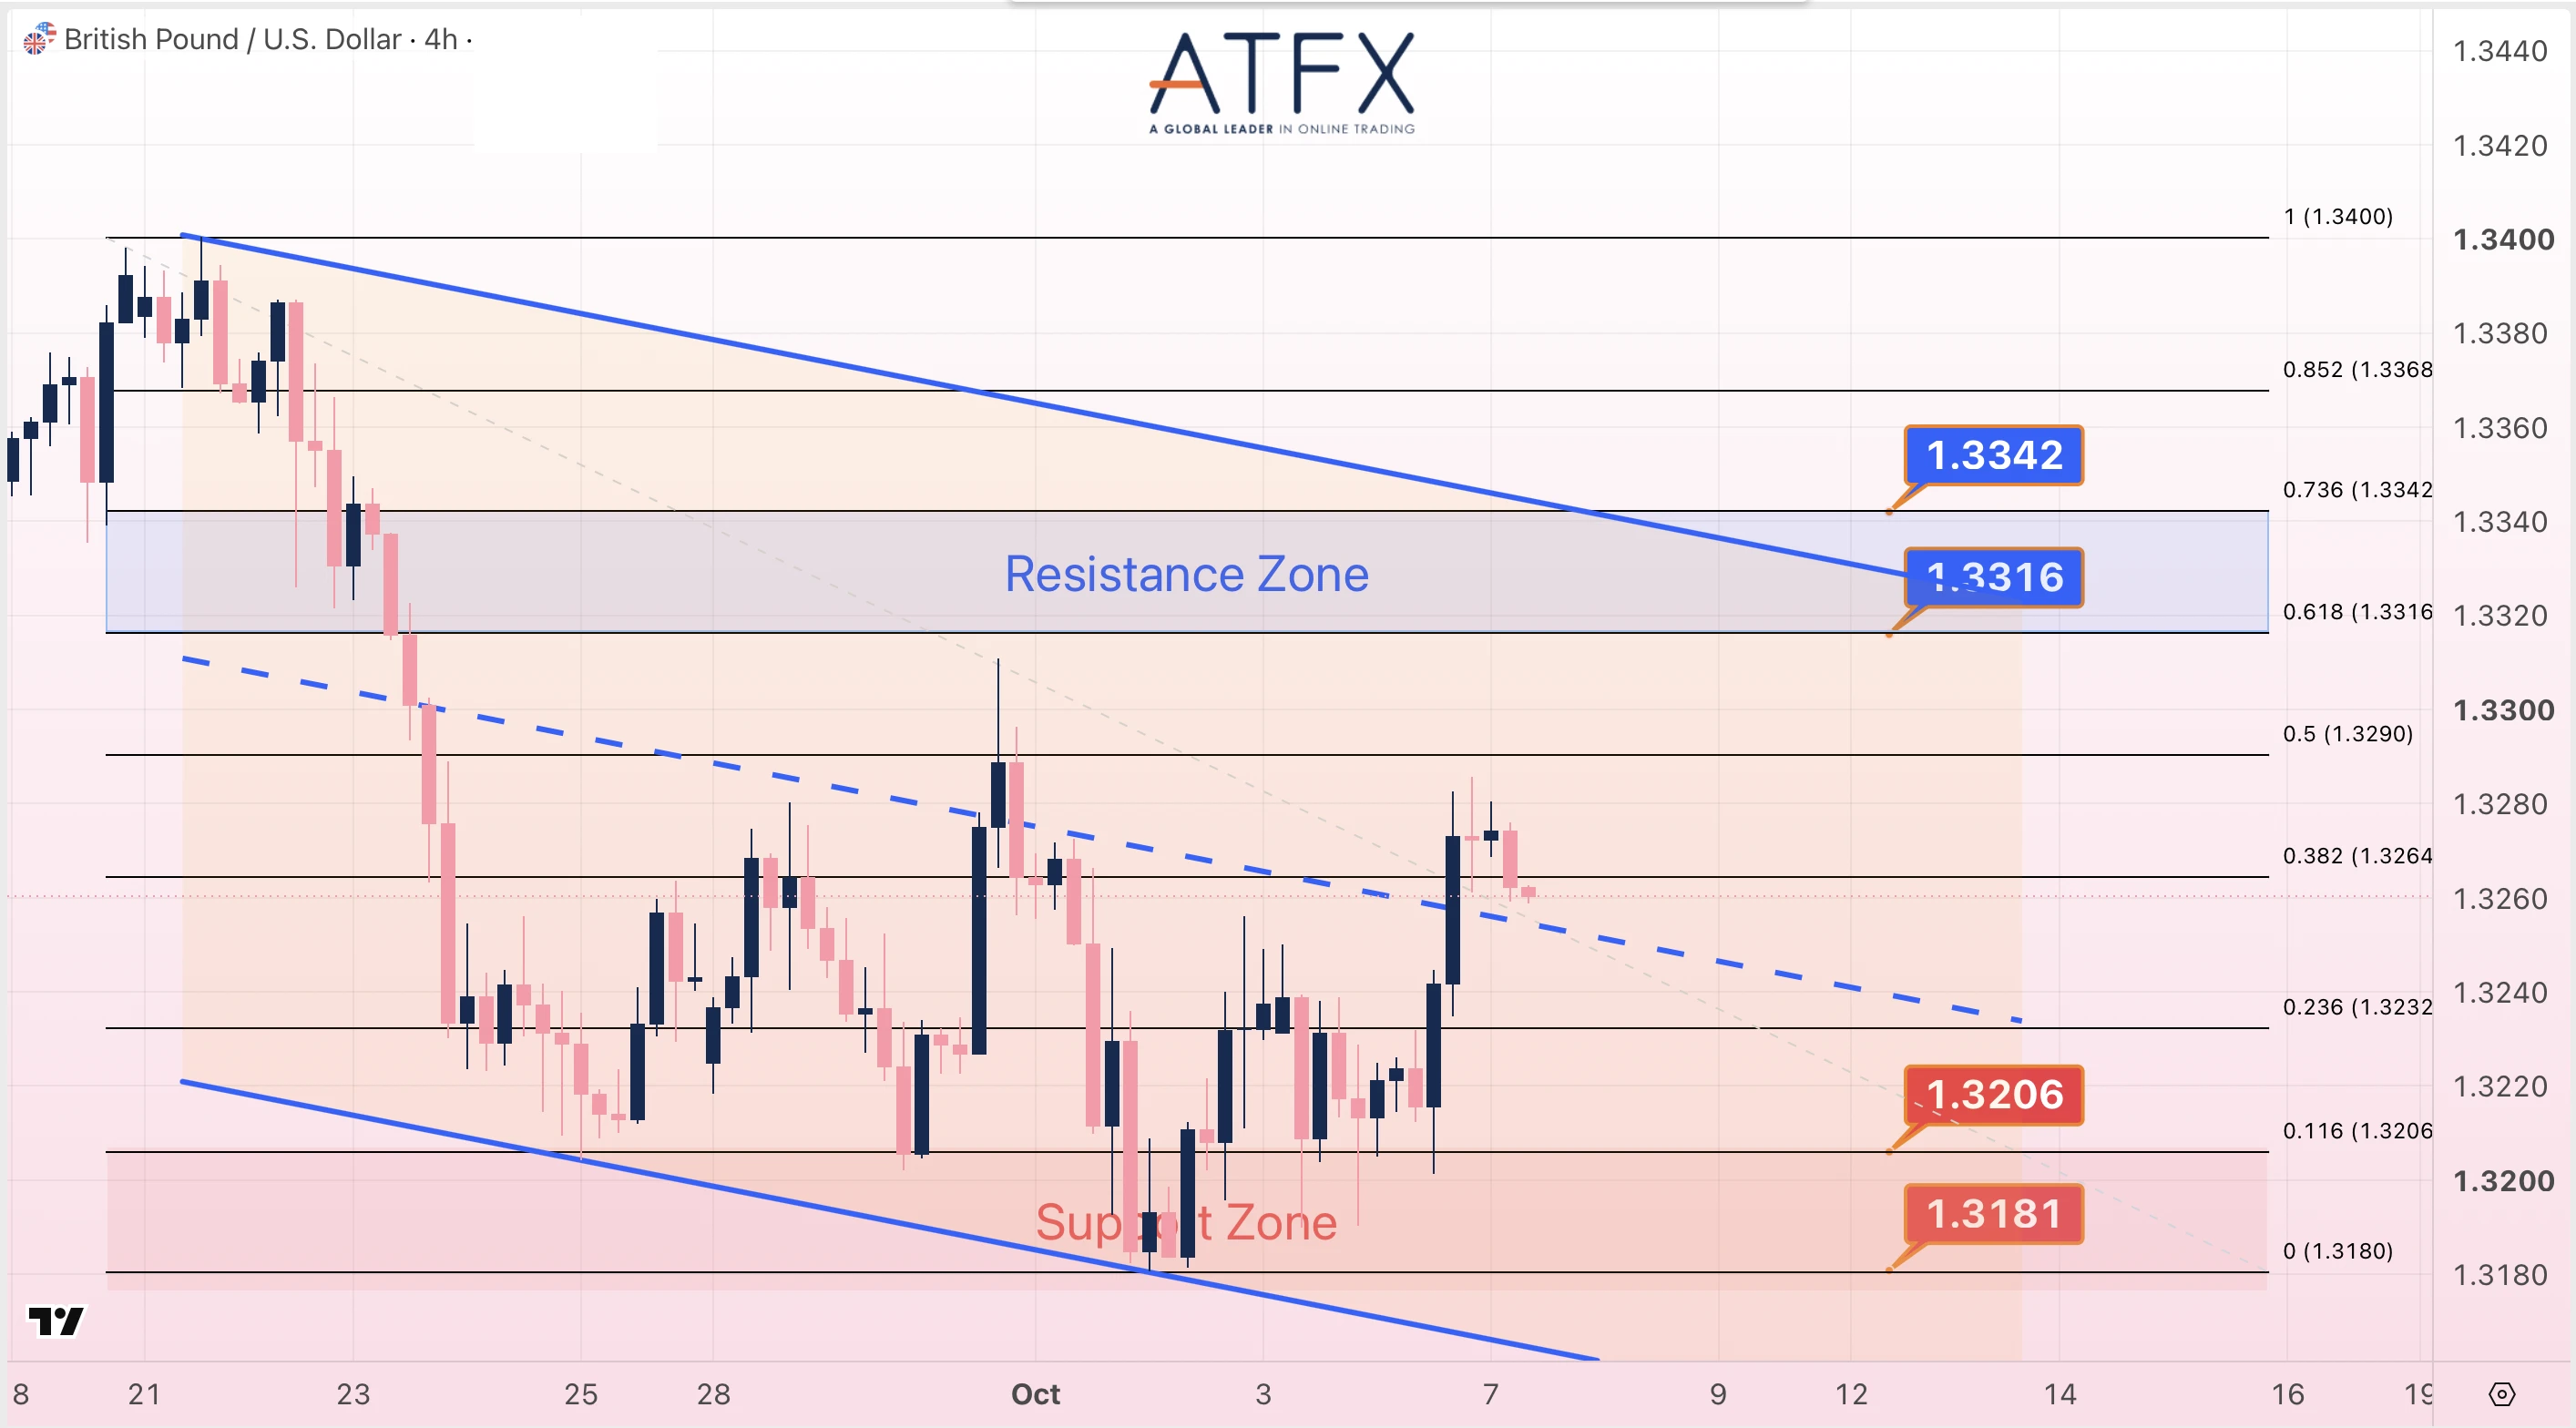
- Resistance: 1.3316 / 1.3342
- Support: 1.3206 / 1.3181
Analyst View: Sterling has bounced from support but remains inside a falling 4H channel. A sustained move above the intermediate 1.3290 level could open the 1.3316–1.3342 resistance zone. Renewed dollar strength could stall the rebound; a break below 1.3206 would bring 1.3181 into focus.
Bias: Cautious recovery within a broader downtrend.
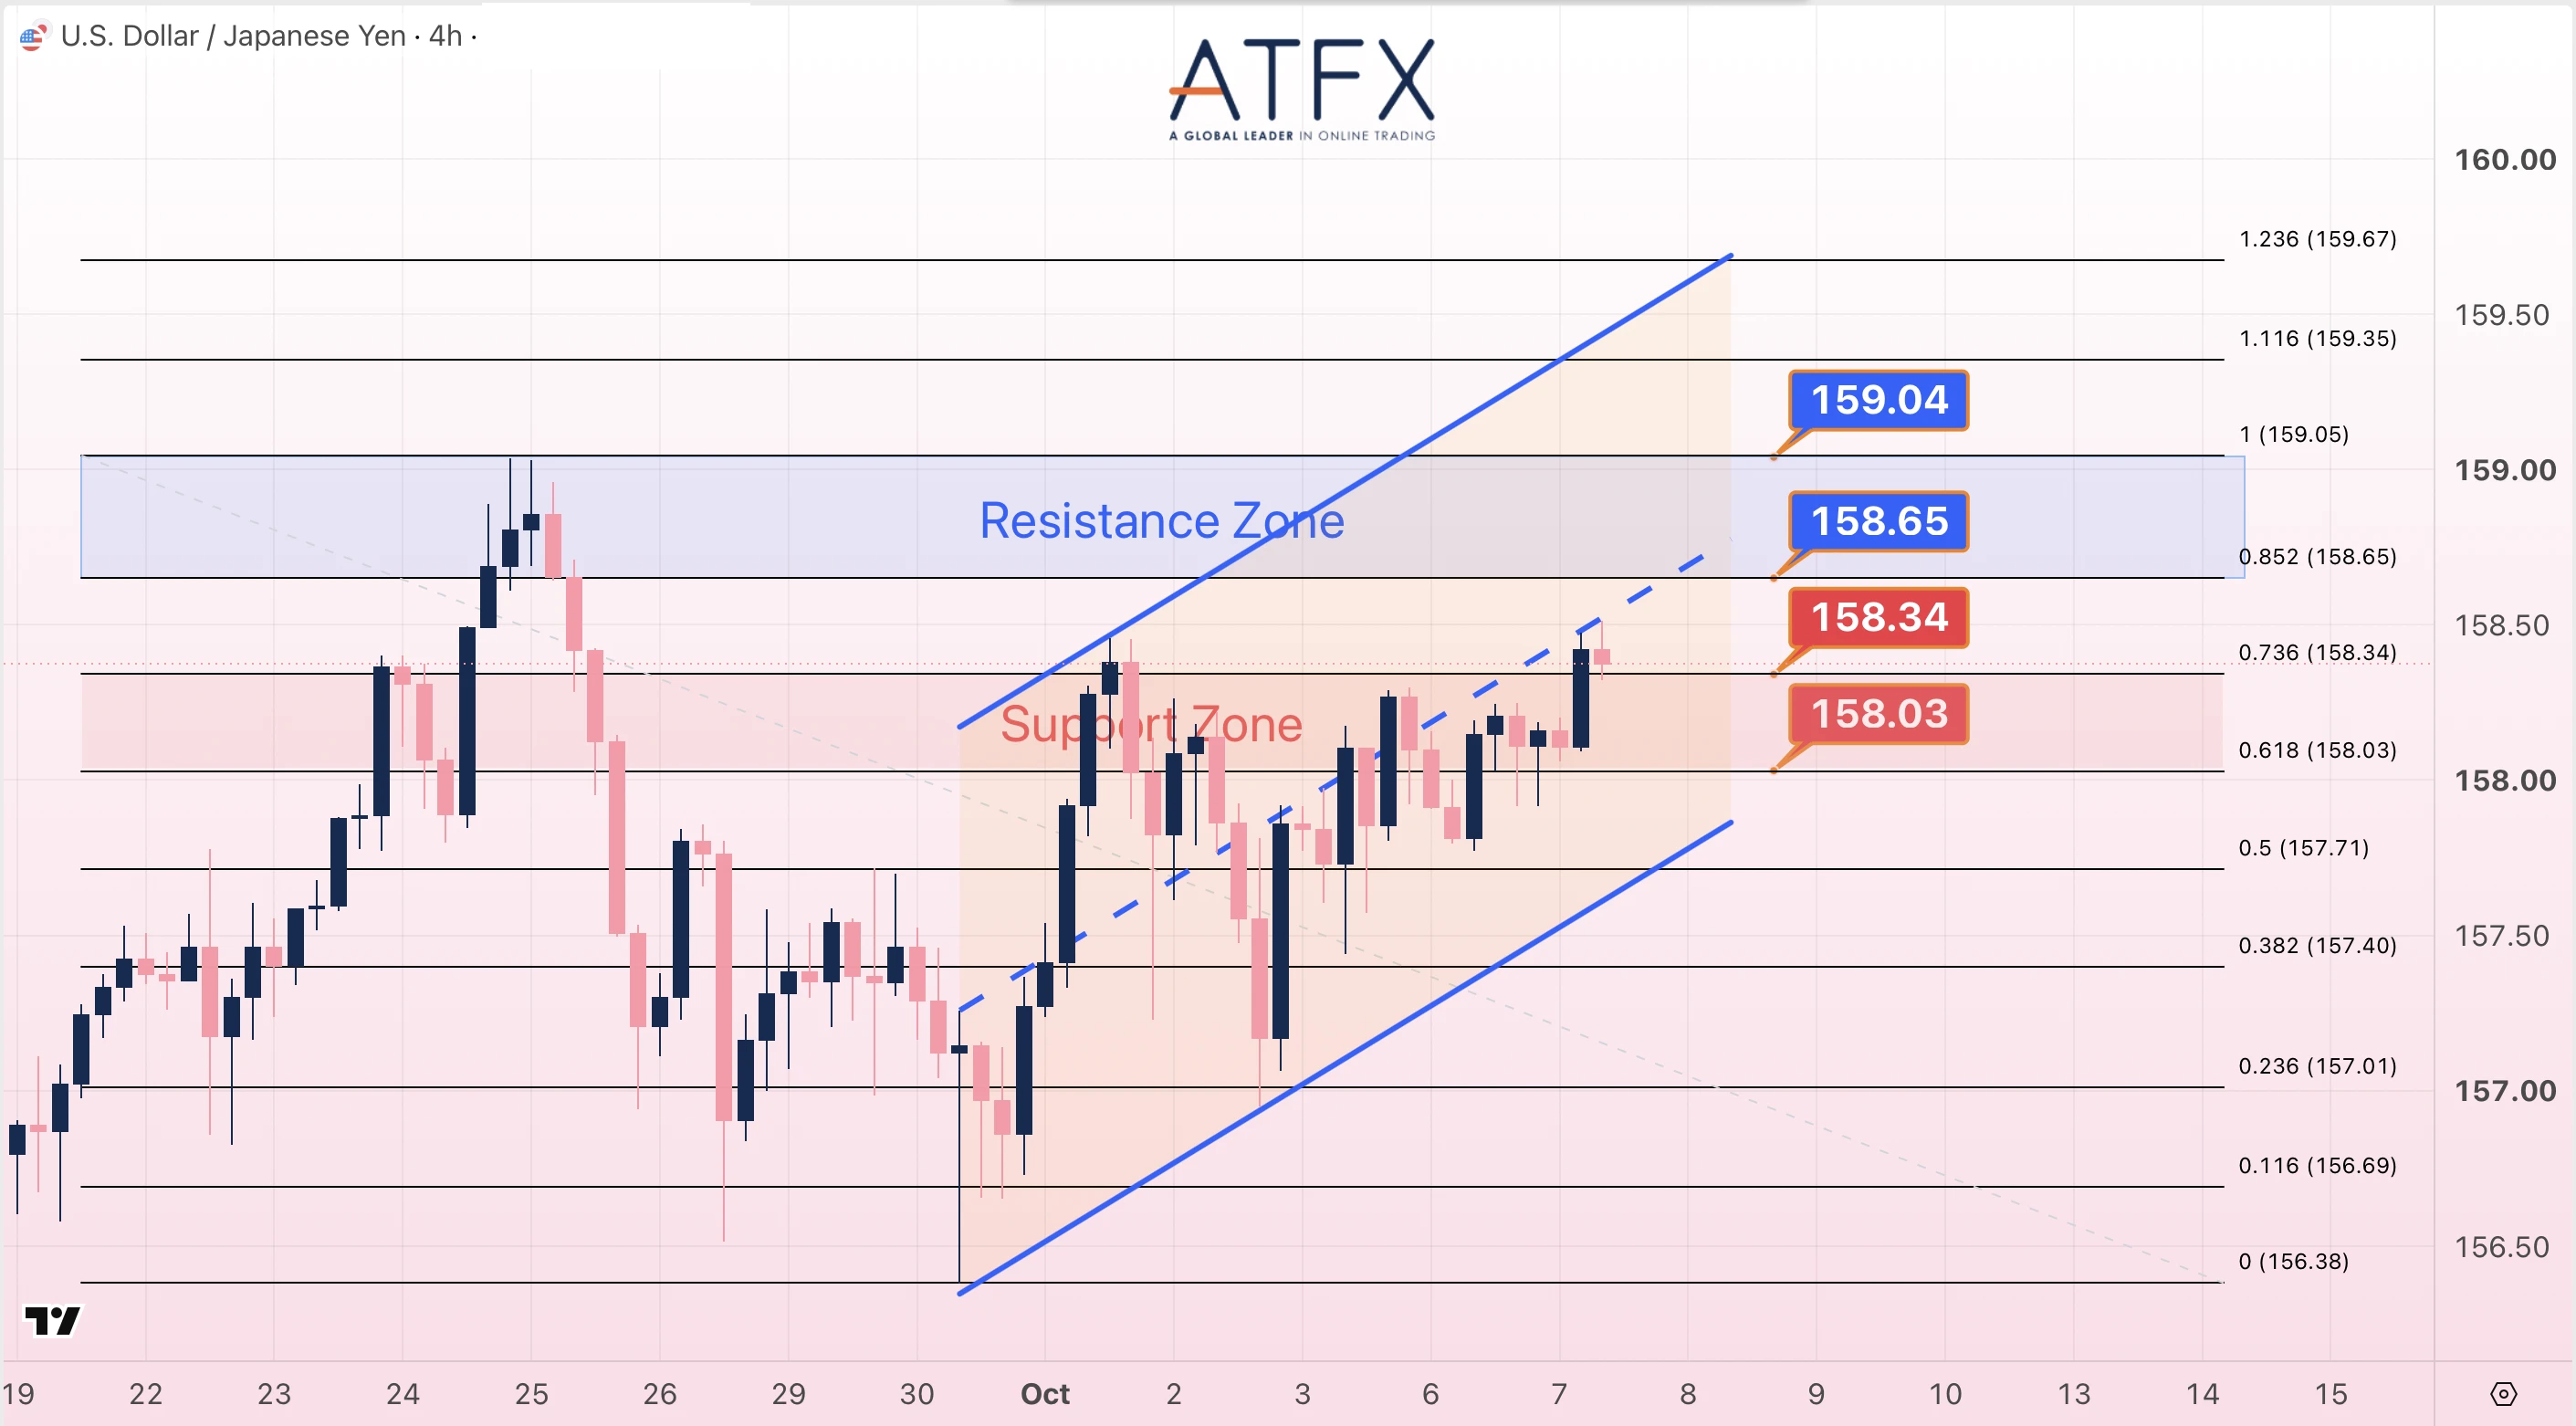
- Resistance: 158.65 / 159.04
- Support: 158.34 / 158.03
Analyst View: The pair is recovering within a rising 4H channel and testing support around 158.34. Holding this level would favor another attempt at 158.65, followed by 159.04. A break below 158.03 would weaken the recovery and expose 157.71, particularly if U.S. yields ease further.
Bias: Cautiously bullish while 158.03 holds.
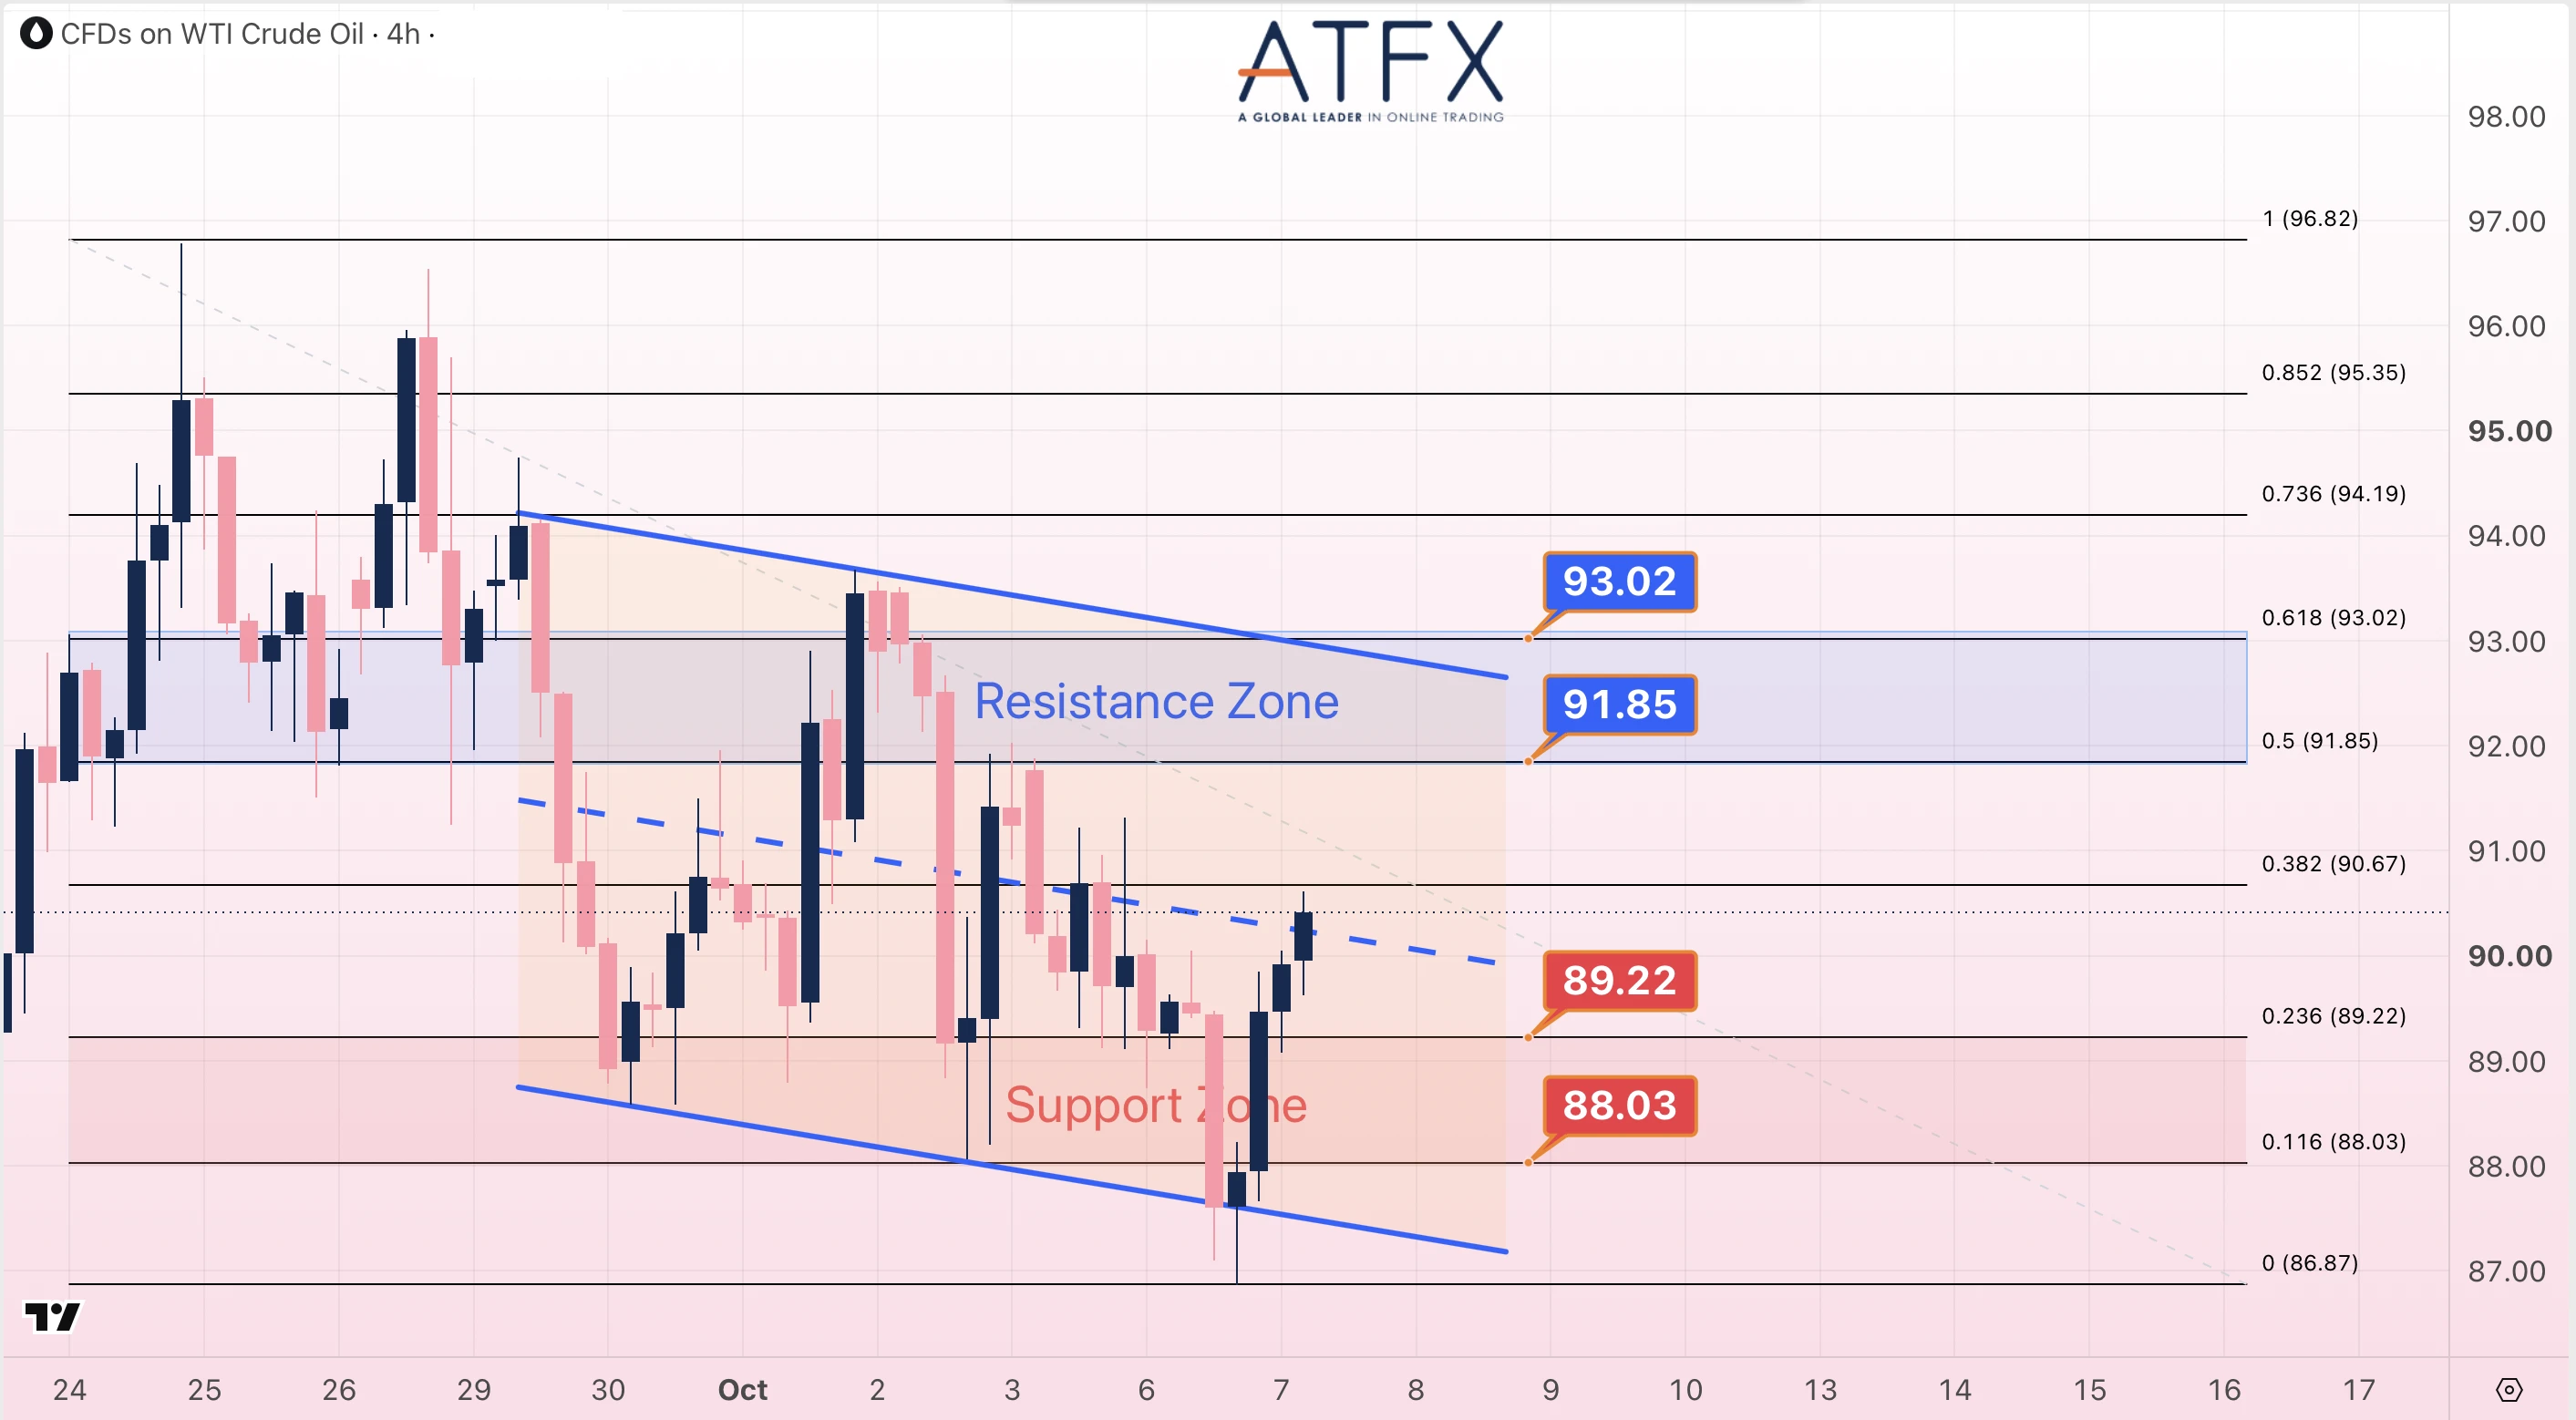
- Resistance: 91.85 / 93.02
- Support: 89.22 / 88.03
Analyst View: WTI(USOIL) has rebounded from the lower edge of its falling 4H channel. A move above 90.67 could extend the recovery toward 91.85, with EIA inventories as the main catalyst. A larger inventory draw would favor upside. However, a break below 89.22 would test 88.03.
Bias: Short-term rebound; broader channel remains bearish.
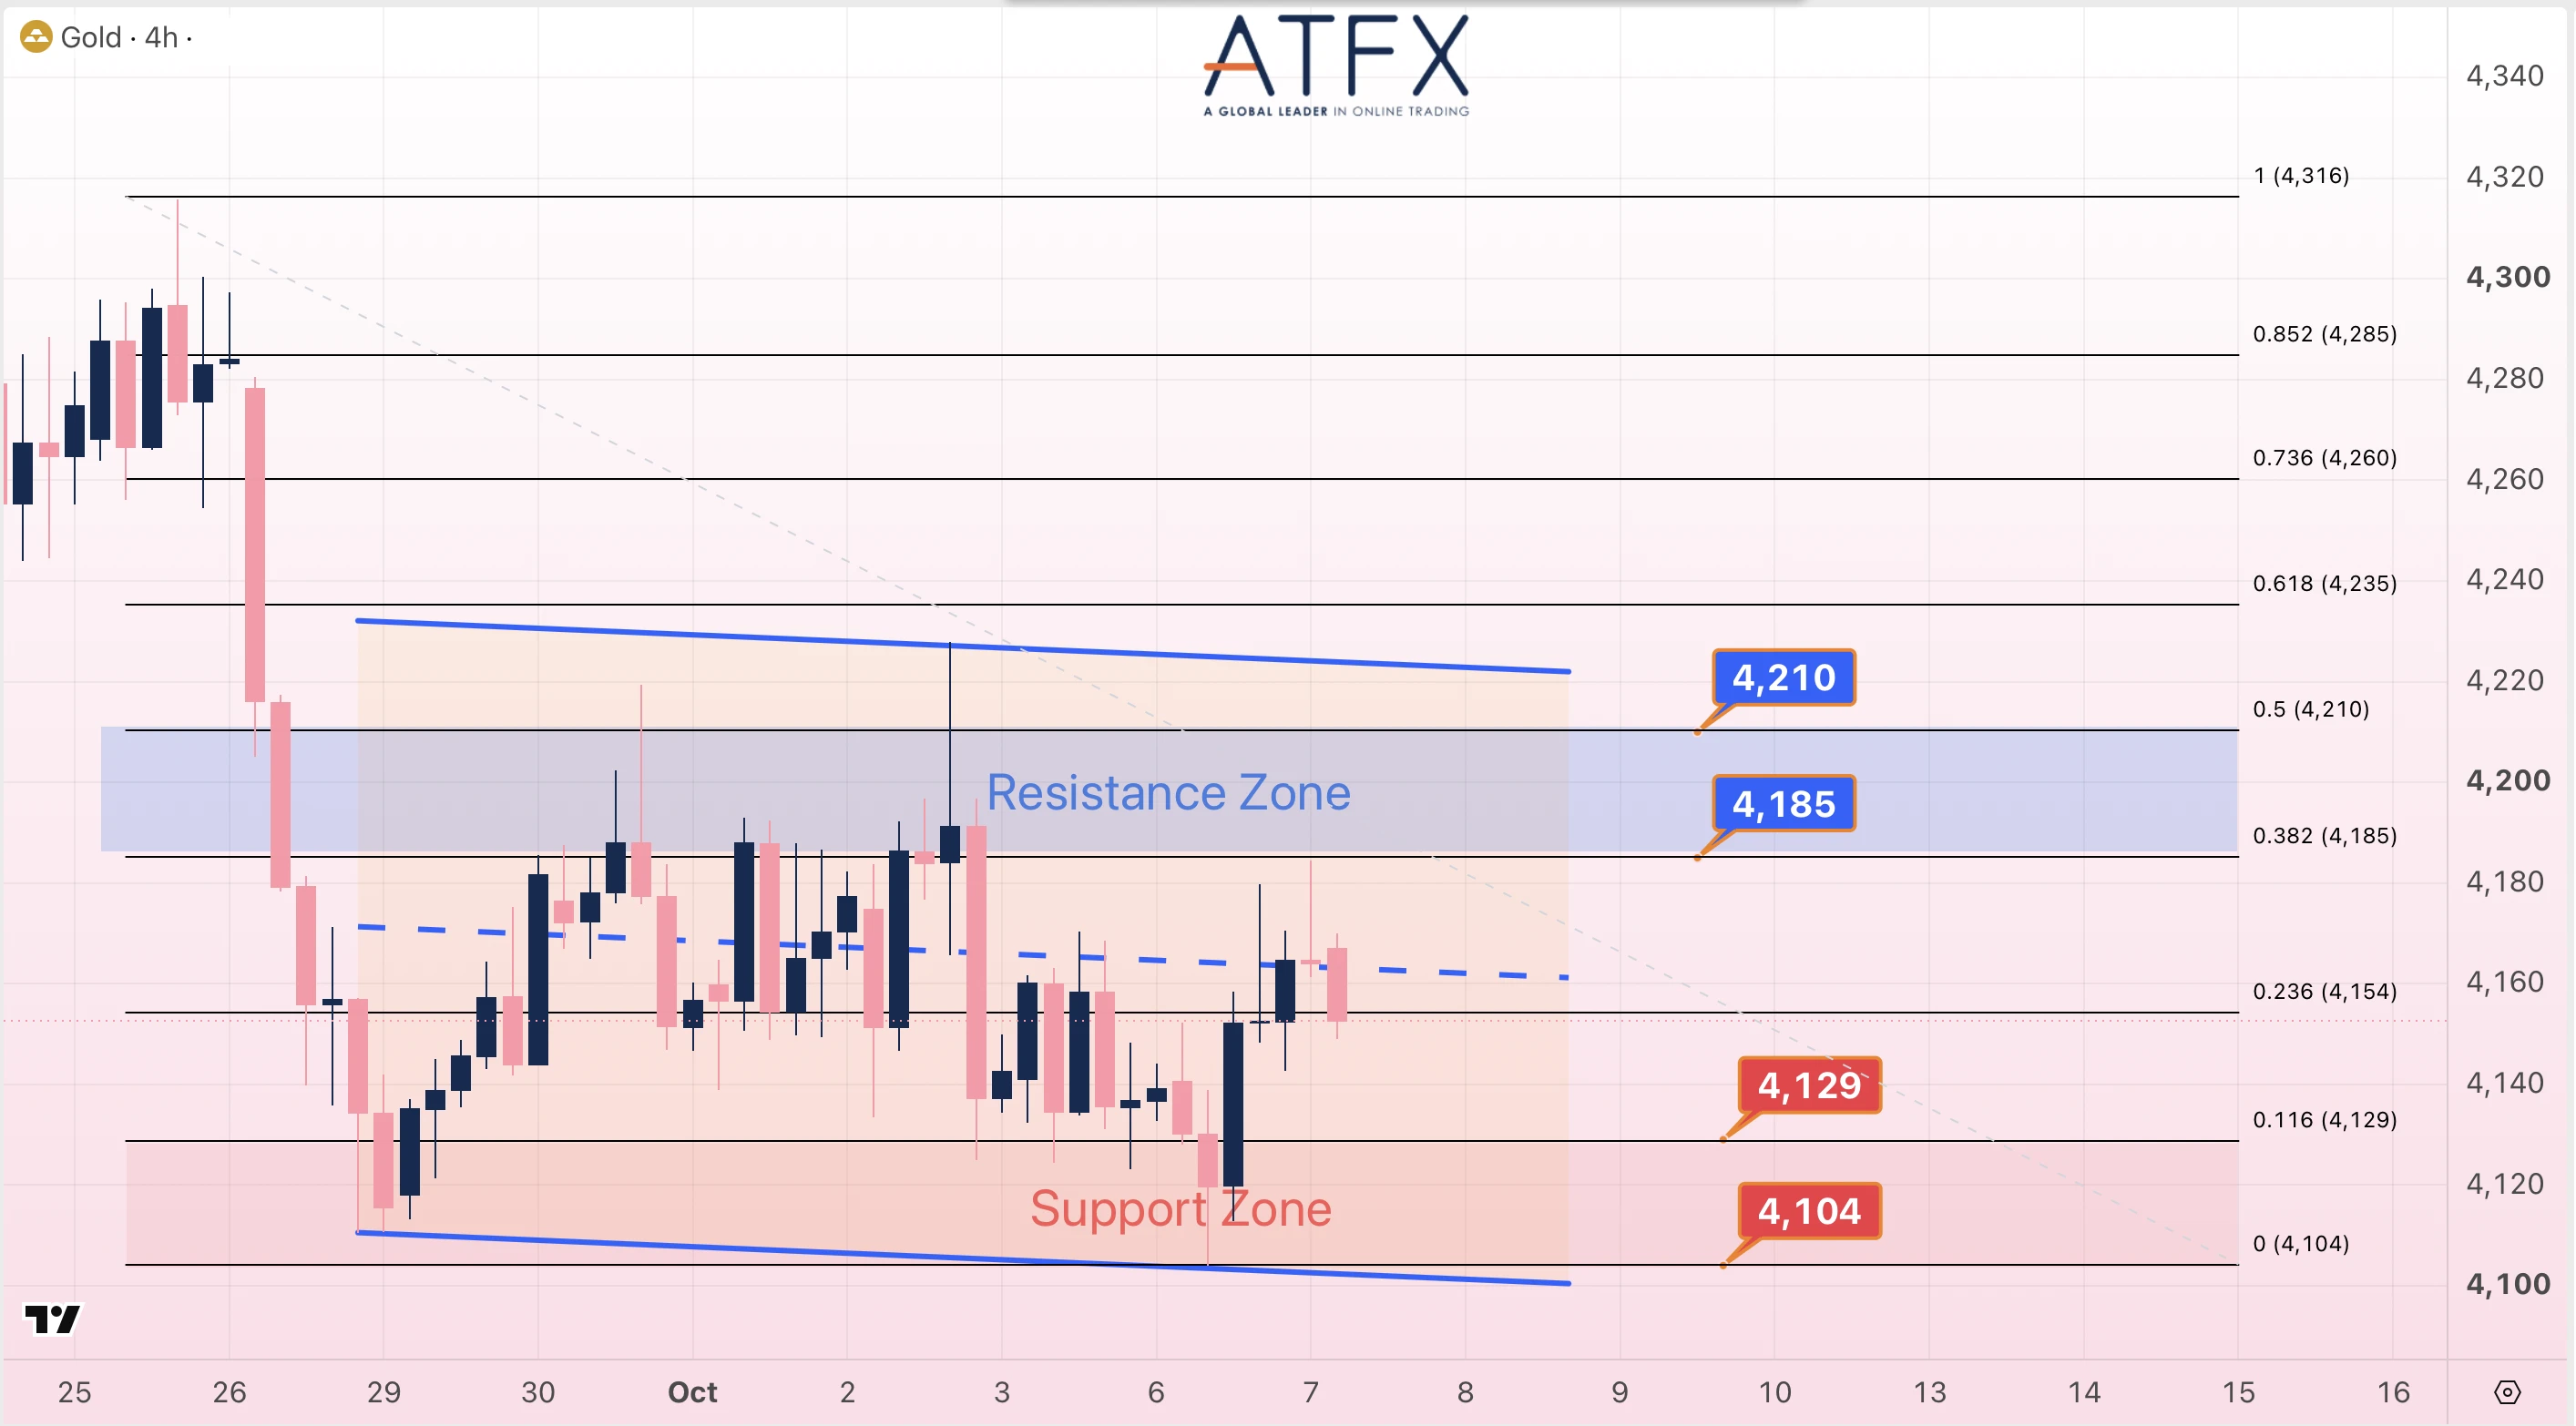
- Resistance: 4,185 / 4,210
- Support: 4,129 / 4,104
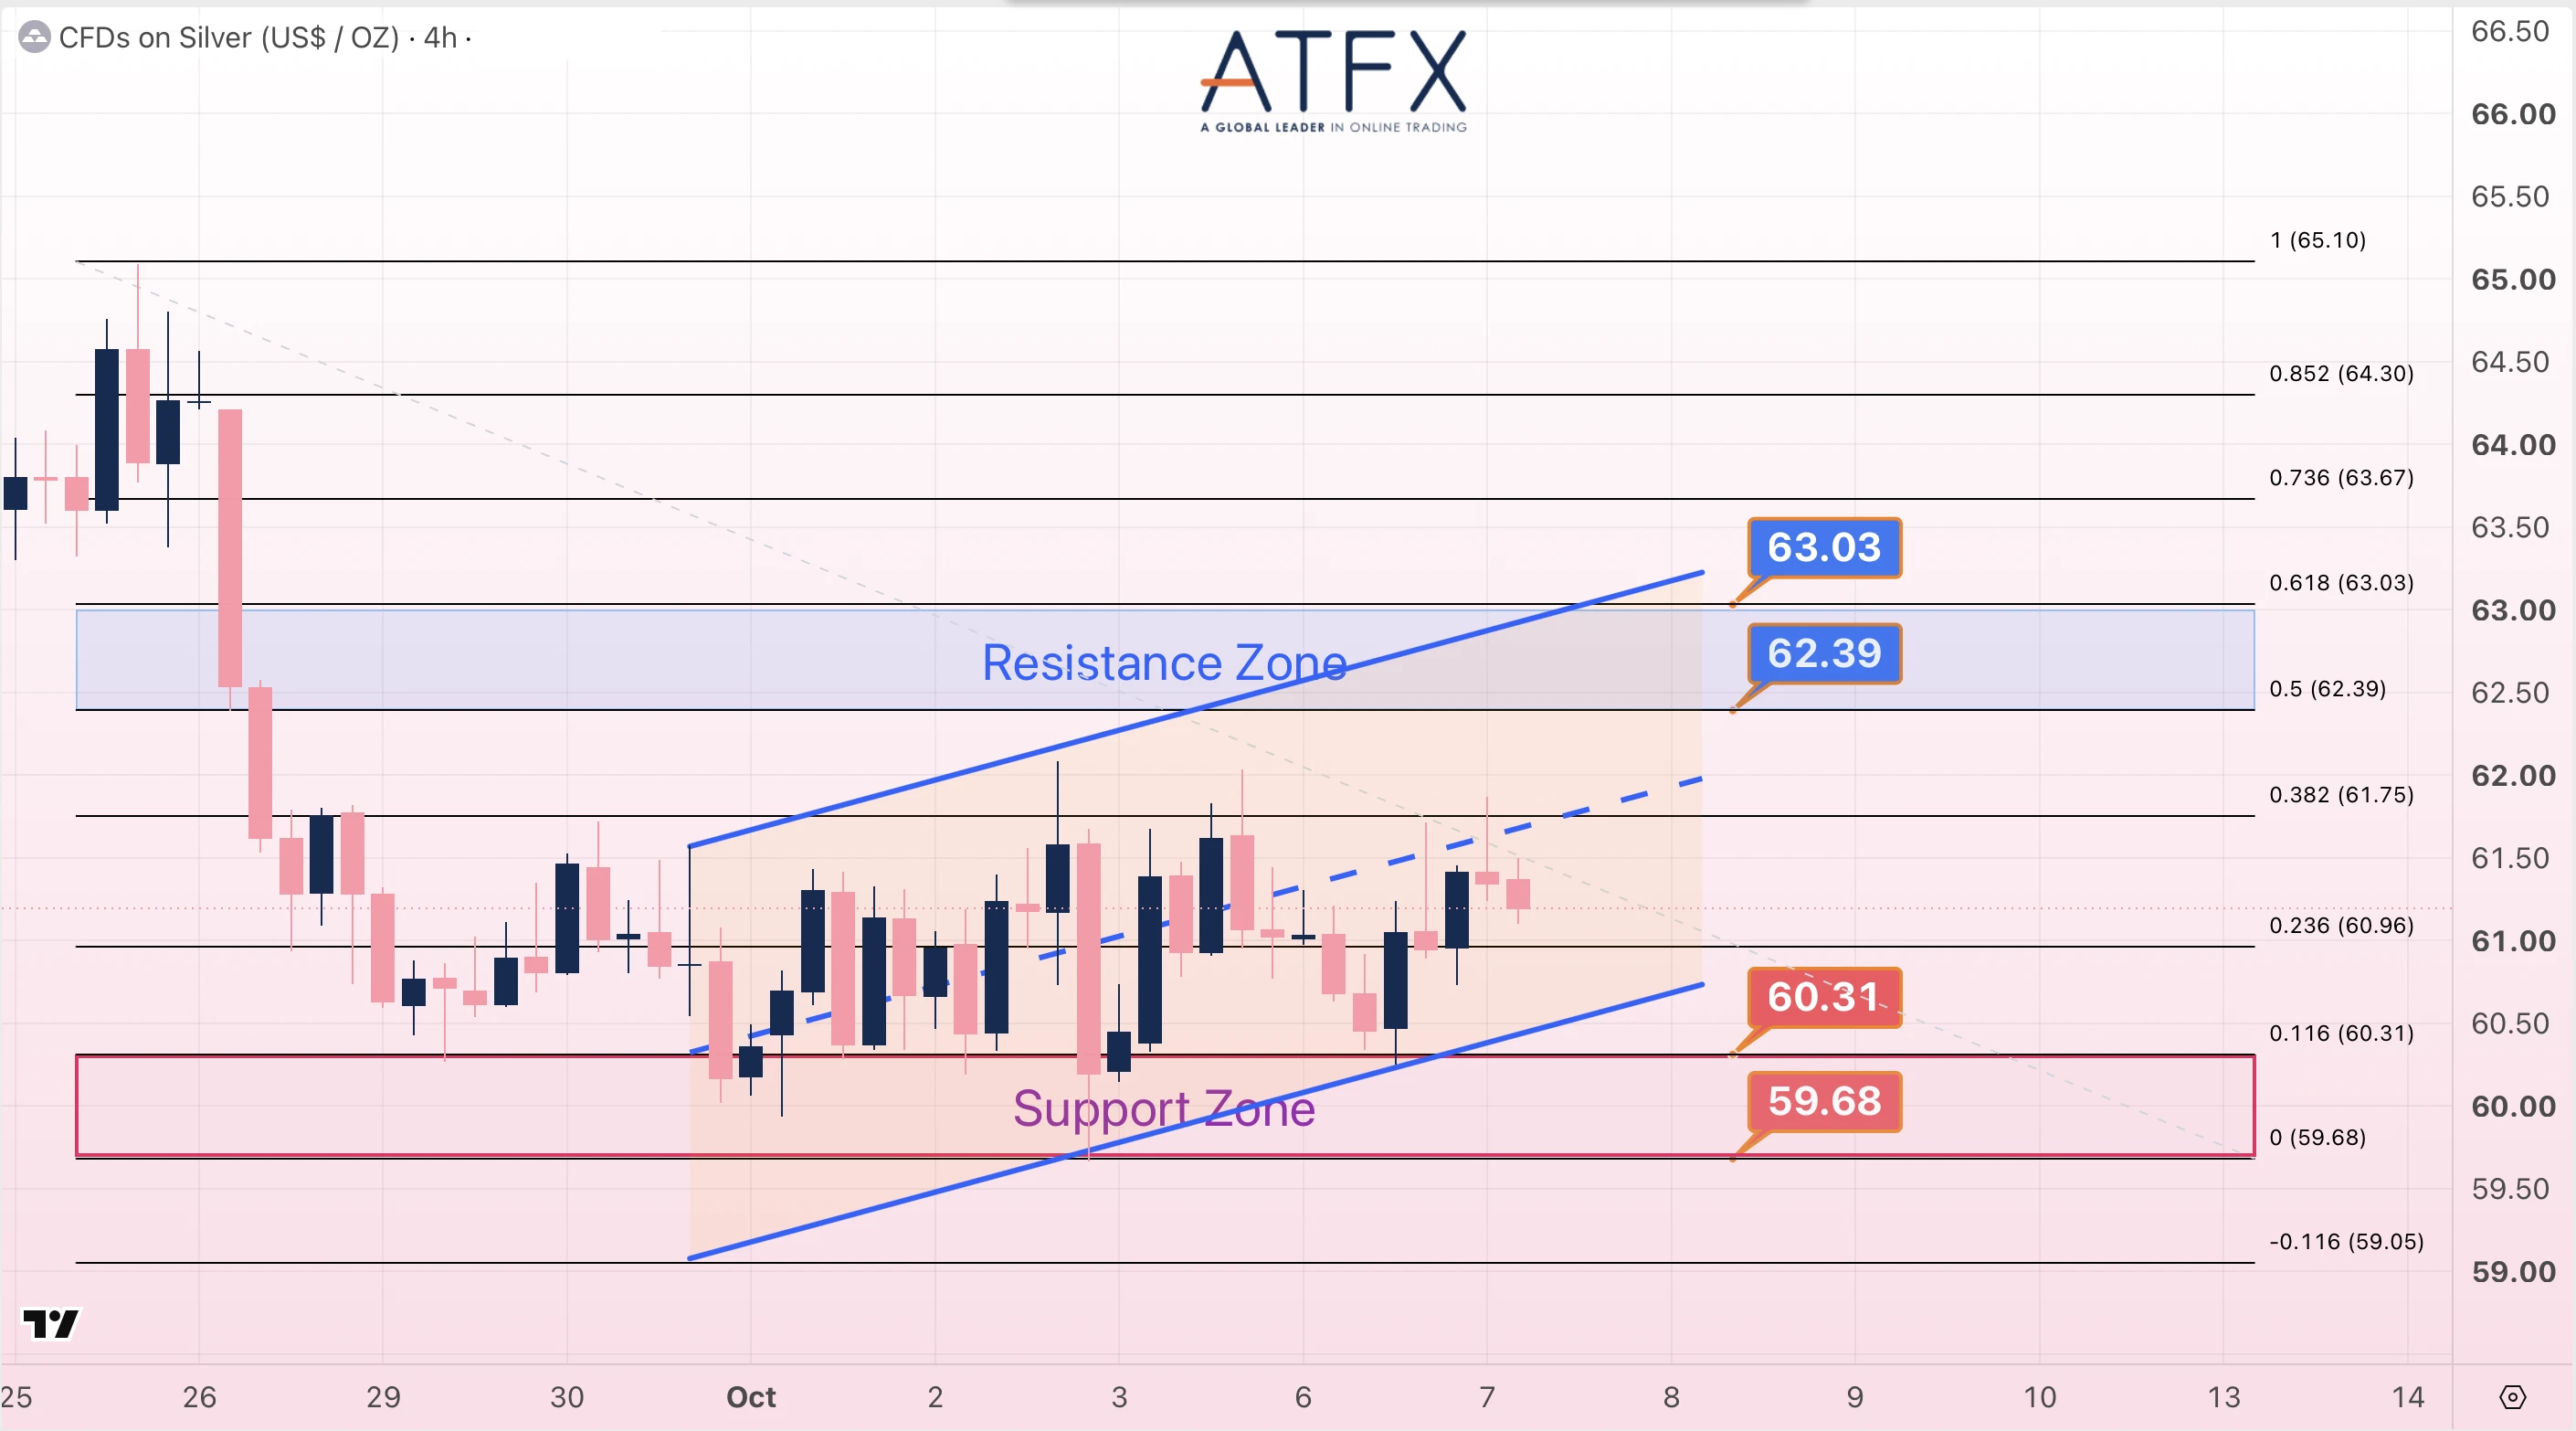
- Resistance: 62.39 / 63.03
- Support: 60.31 / 59.68
Analyst View: Gold remains in a shallow, falling 4H channel after rebounding from support. A break above 4,185 would open 4,210; below 4,129, watch 4,104. Silver is consolidating within a rising channel, with 61.75 an intermediate hurdle before 62.39–63.03. Higher U.S. inflation expectations could lift yields and pressure both recoveries.
Bias: Gold range-bound; silver cautiously constructive while support holds.
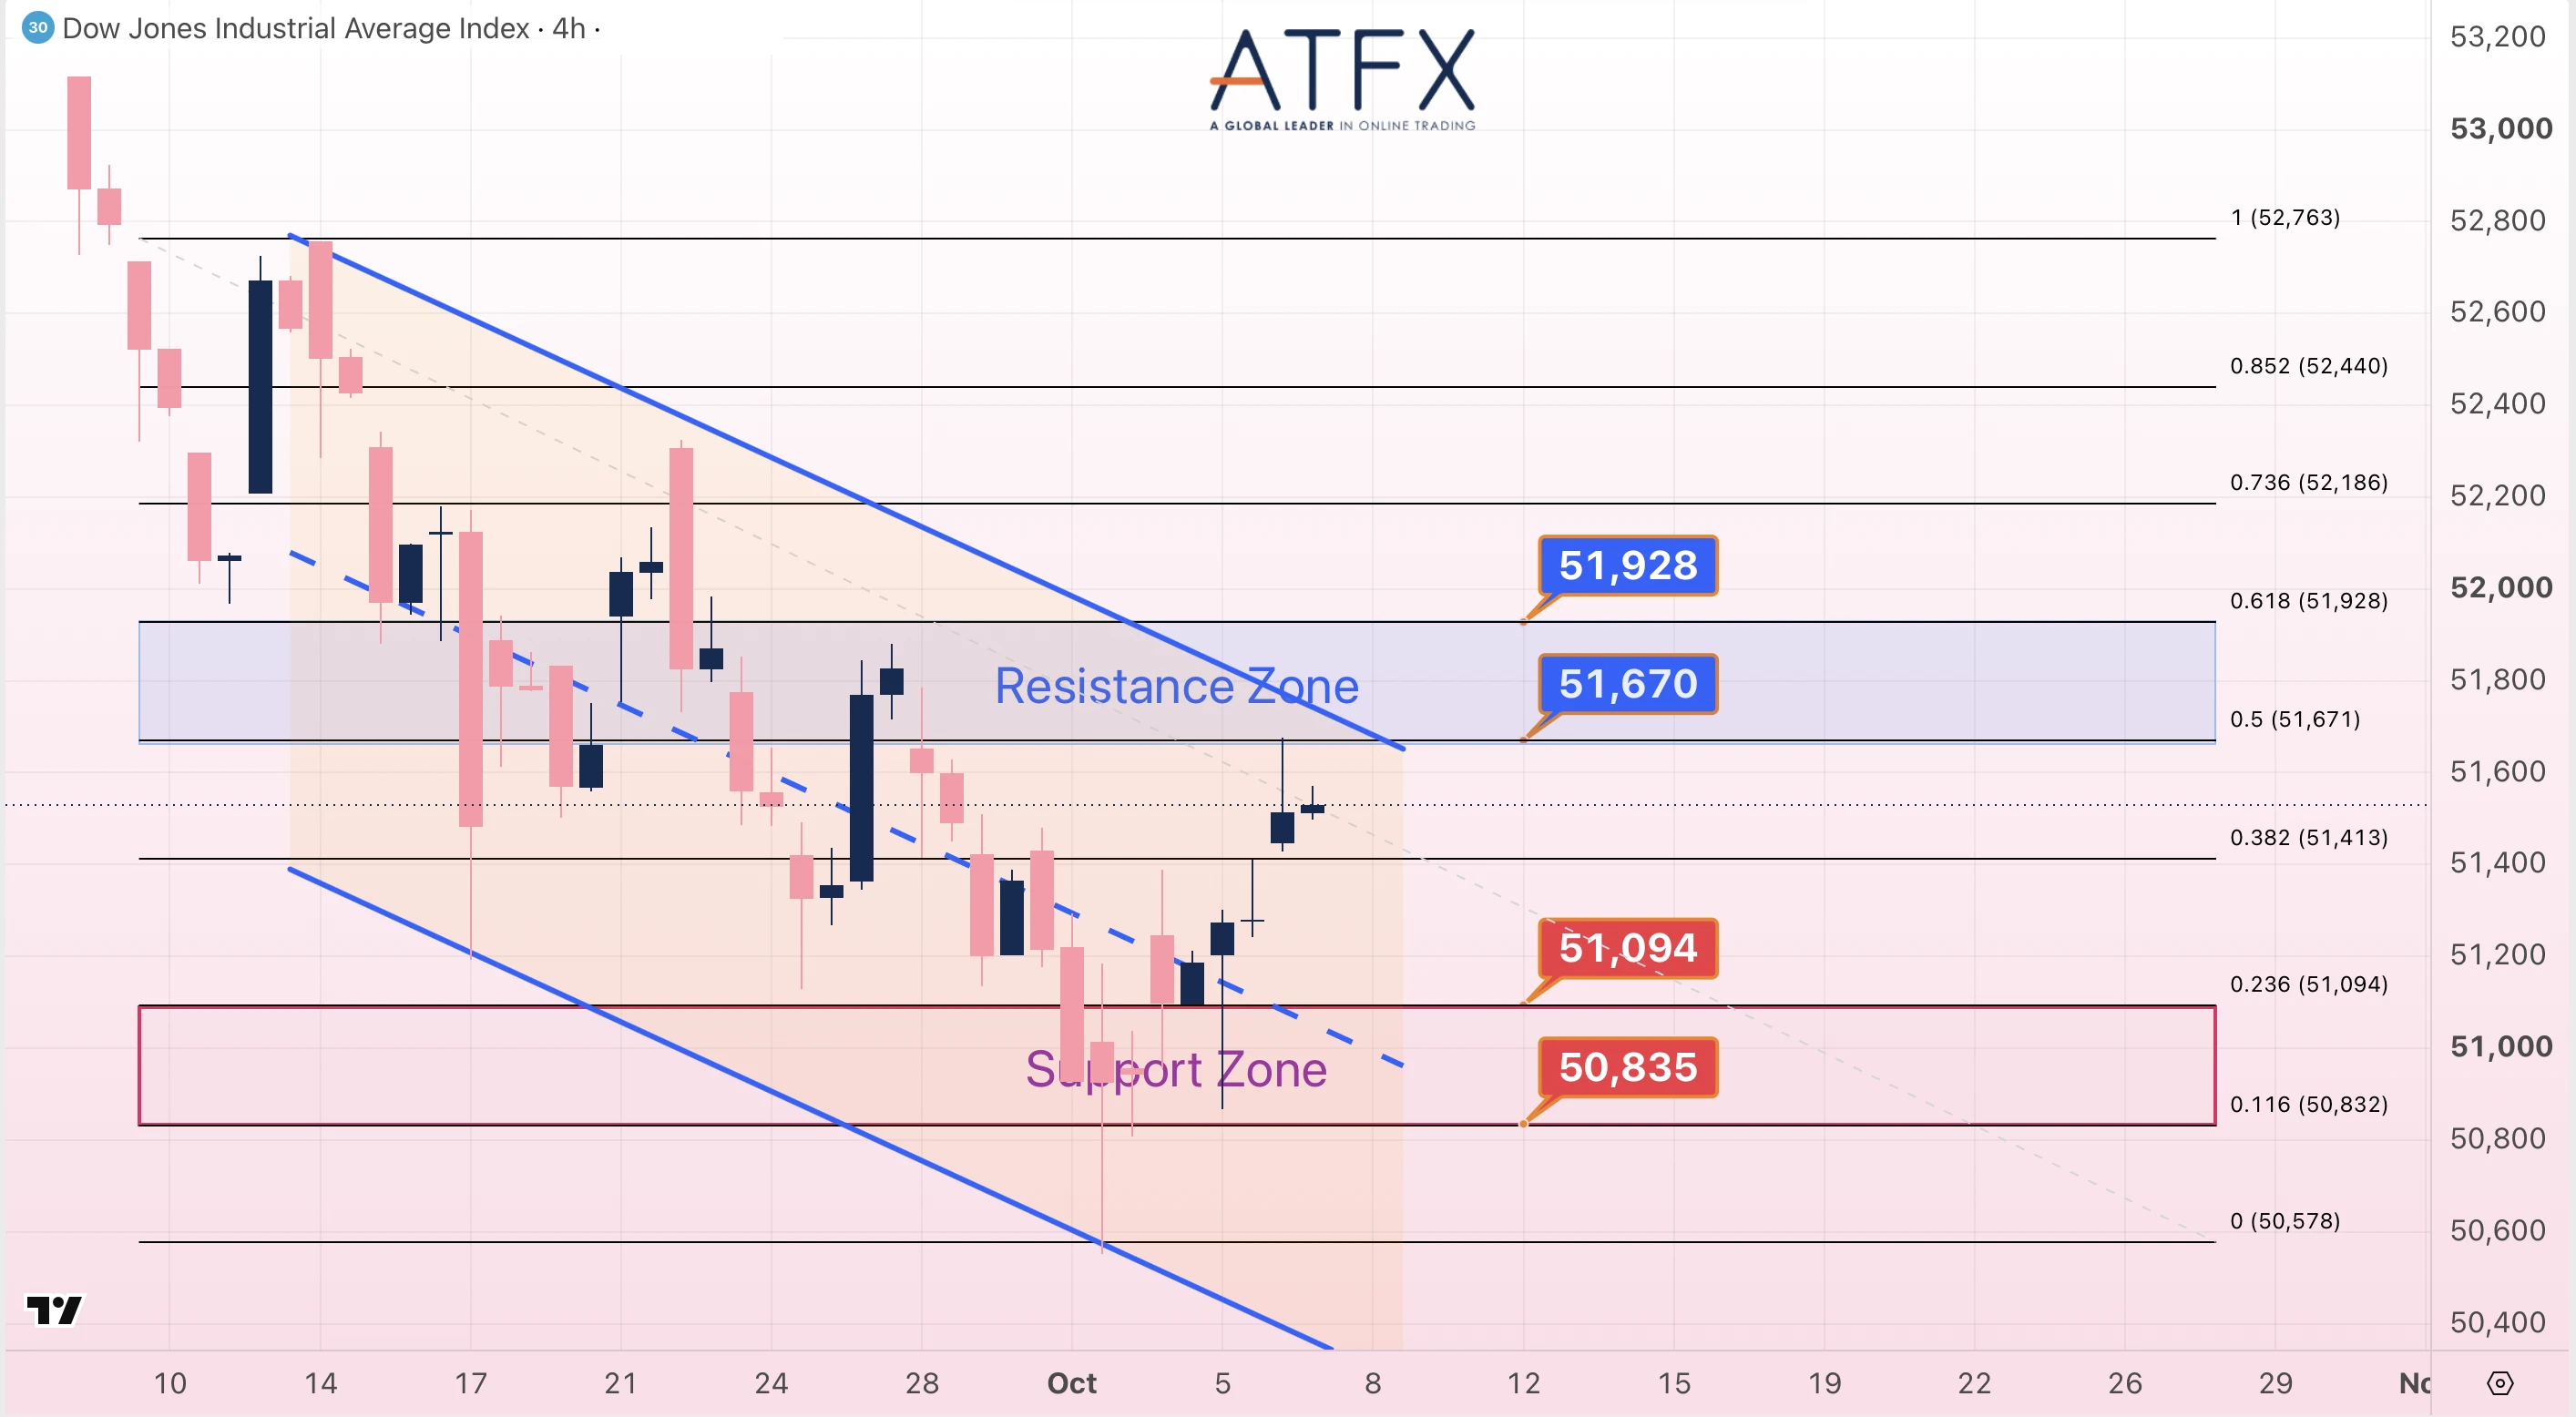
- Resistance: 51,670 / 51,928
- Support: 51,094 / 50,835
Analyst View: Dow has rebounded from support toward the upper edge of its falling 4H channel. A break above 51,670 would open 51,928 and strengthen the recovery. Rejection at resistance, especially if inflation expectations lift yields, could trigger a return toward 51,094 and 50,835.
Bias: Recovery phase; resistance breakout needed for confirmation.
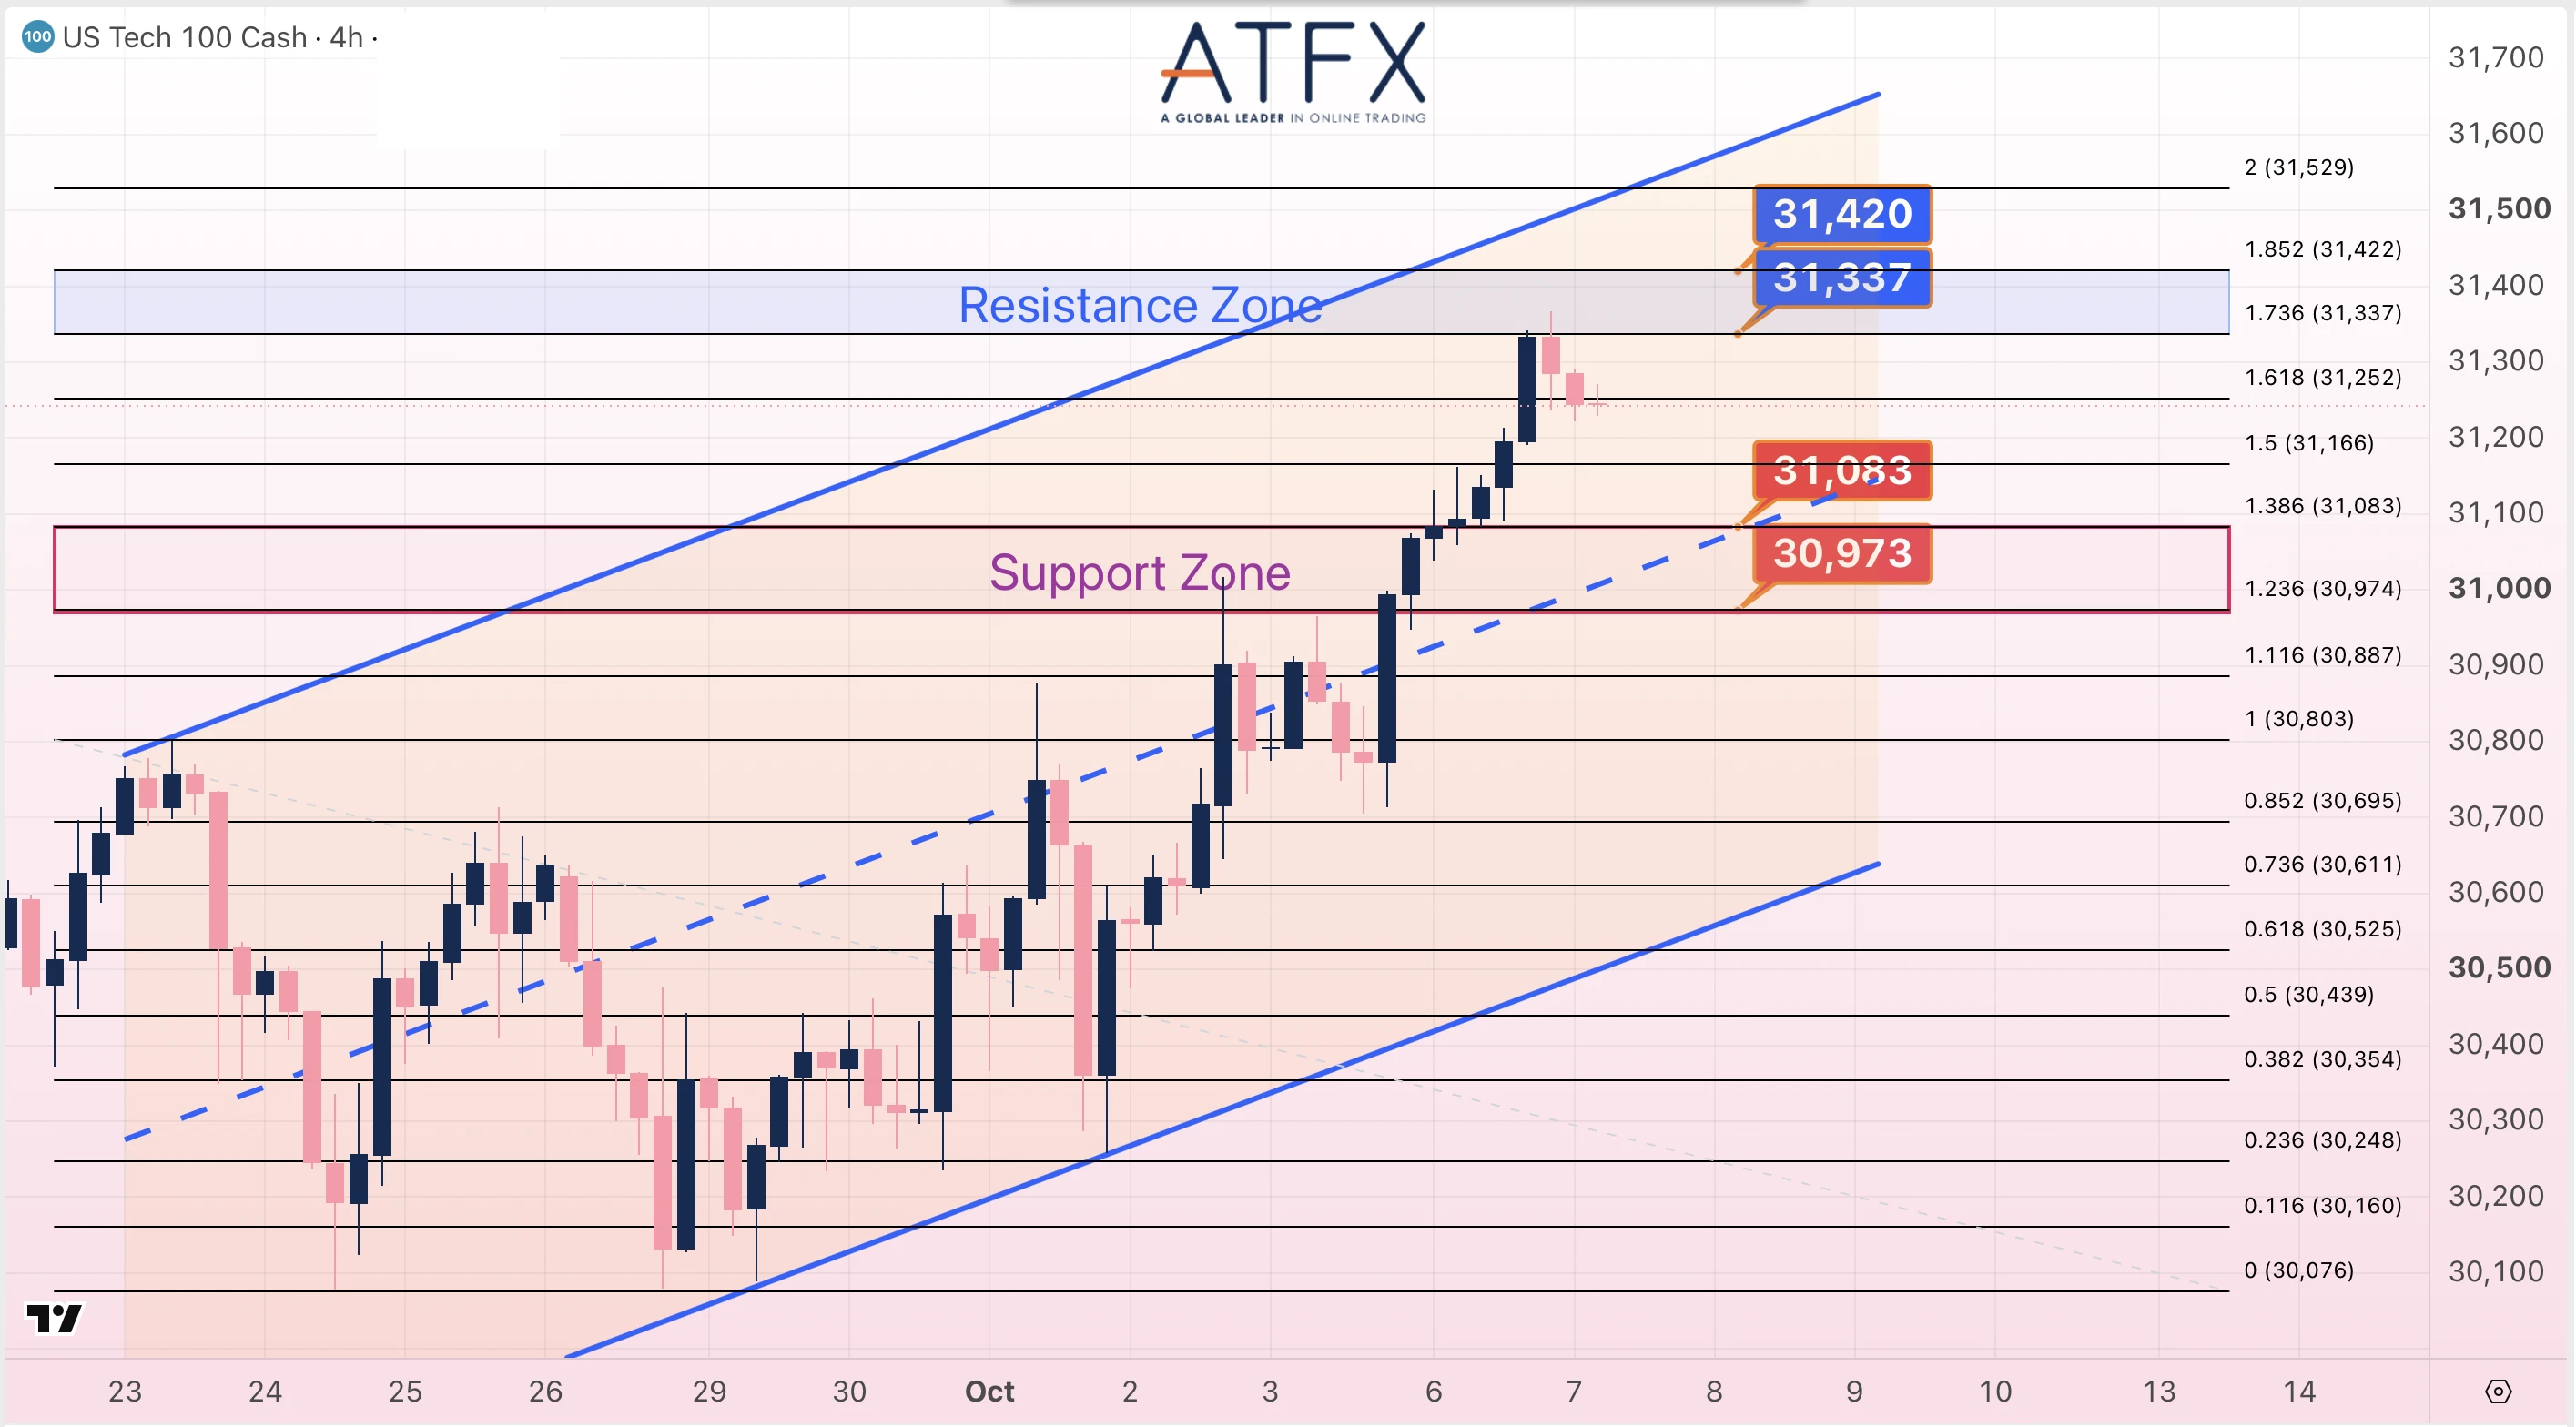
- Resistance: 31,337 / 31,420
- Support: 31,083 / 30,973
Analyst View: Nasdaq 100 remains in a rising 4H channel but has pulled back after testing 31,337. Holding 31,083–30,973 would preserve the bullish structure. A break above 31,420 could extend the rally; higher inflation expectations and renewed yield pressure could deepen the pullback.
Bias: Bullish structure; near-term consolidation below resistance.
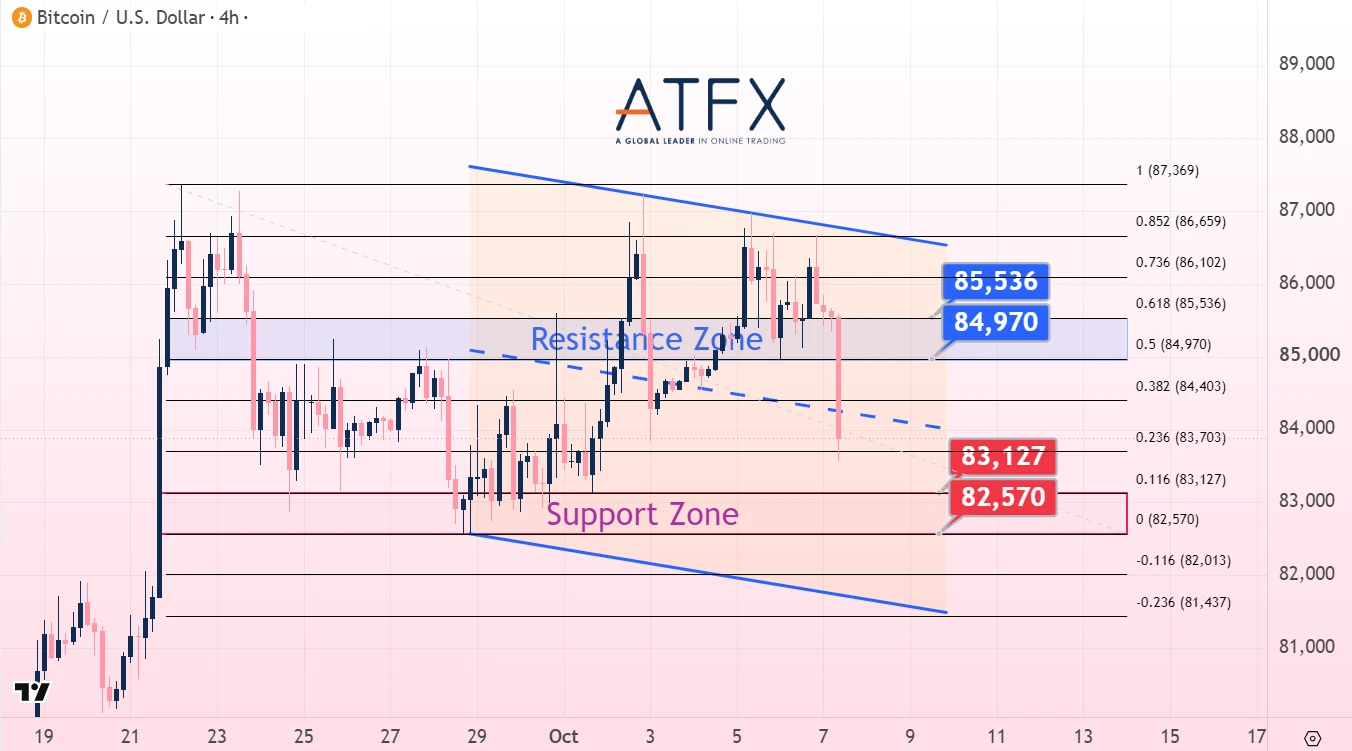
- Resistance: 84970 / 85536
- Support: 83127 / 82570
Analyst View: Bitcoin pulled back from $86,659 within a rising 4H channel and broke out of the $84,970–$84,403 initial support zone, failing to preserve the recovery structure and forming a new downward pattern. A reclaim of $86,659 could reopen the $87,369 level; a break below $83,127 would increase downside risk and test the last low at $82,570.
Bias: Near-term pullback; recovery depends on support holding.
Enjoy Trading!