

Key Takeaways:
Today’s Focus: Key macro and policy signals today: EU Retail Sales will shape the Eurozone demand outlook, followed by the U.S. Trade Balance, a dollar-sensitive data point. Overnight, API and EIA crude inventory reports could drive WTI momentum, while the Fed minutes, released on Oct 8, may offer additional clarity on whether policymakers are leaning toward controlling inflation or managing growth risks. |
Global Market Review 06/10/2026
- Global markets saw a tech-led upswing, with Nasdaq pushing toward record highs as Tesla, Nvidia, and Meta shares rose.
- Oil slipped amid supply concerns, and the SPR was drawn down to its lowest level since 1982.
- The U.S. dollar strengthened above 102, while USD/JPY hovered near 158 as the risk of BoJ intervention increased.
- In crypto, Bitcoin held near $86K on ETF inflows but remained capped by resistance around $87K.
Economic Calendar
Key Events on October 6 (GMT+8)
- China Holiday
| Time (GMT+8) | Event | Importance |
|---|---|---|
| TBD | Bank of Japan Governor Speaks | *** |
| 17:00 | EU Retail Sales AUG | ** |
| 20:30 | US Trade Balance AUG | ** |
Key Events on October 7 (GMT+8)
- China Holiday
| Time (GMT+8) | Event | Importance |
|---|---|---|
| 04:30 | API Crude Oil Stock Change | *** |
| 14:00 | EU GERMANY Industrial Production AUG | ** |
| 22:30 | EIA Crude Oil Stocks Change | ** |
Markets Analysis 06/10/2026
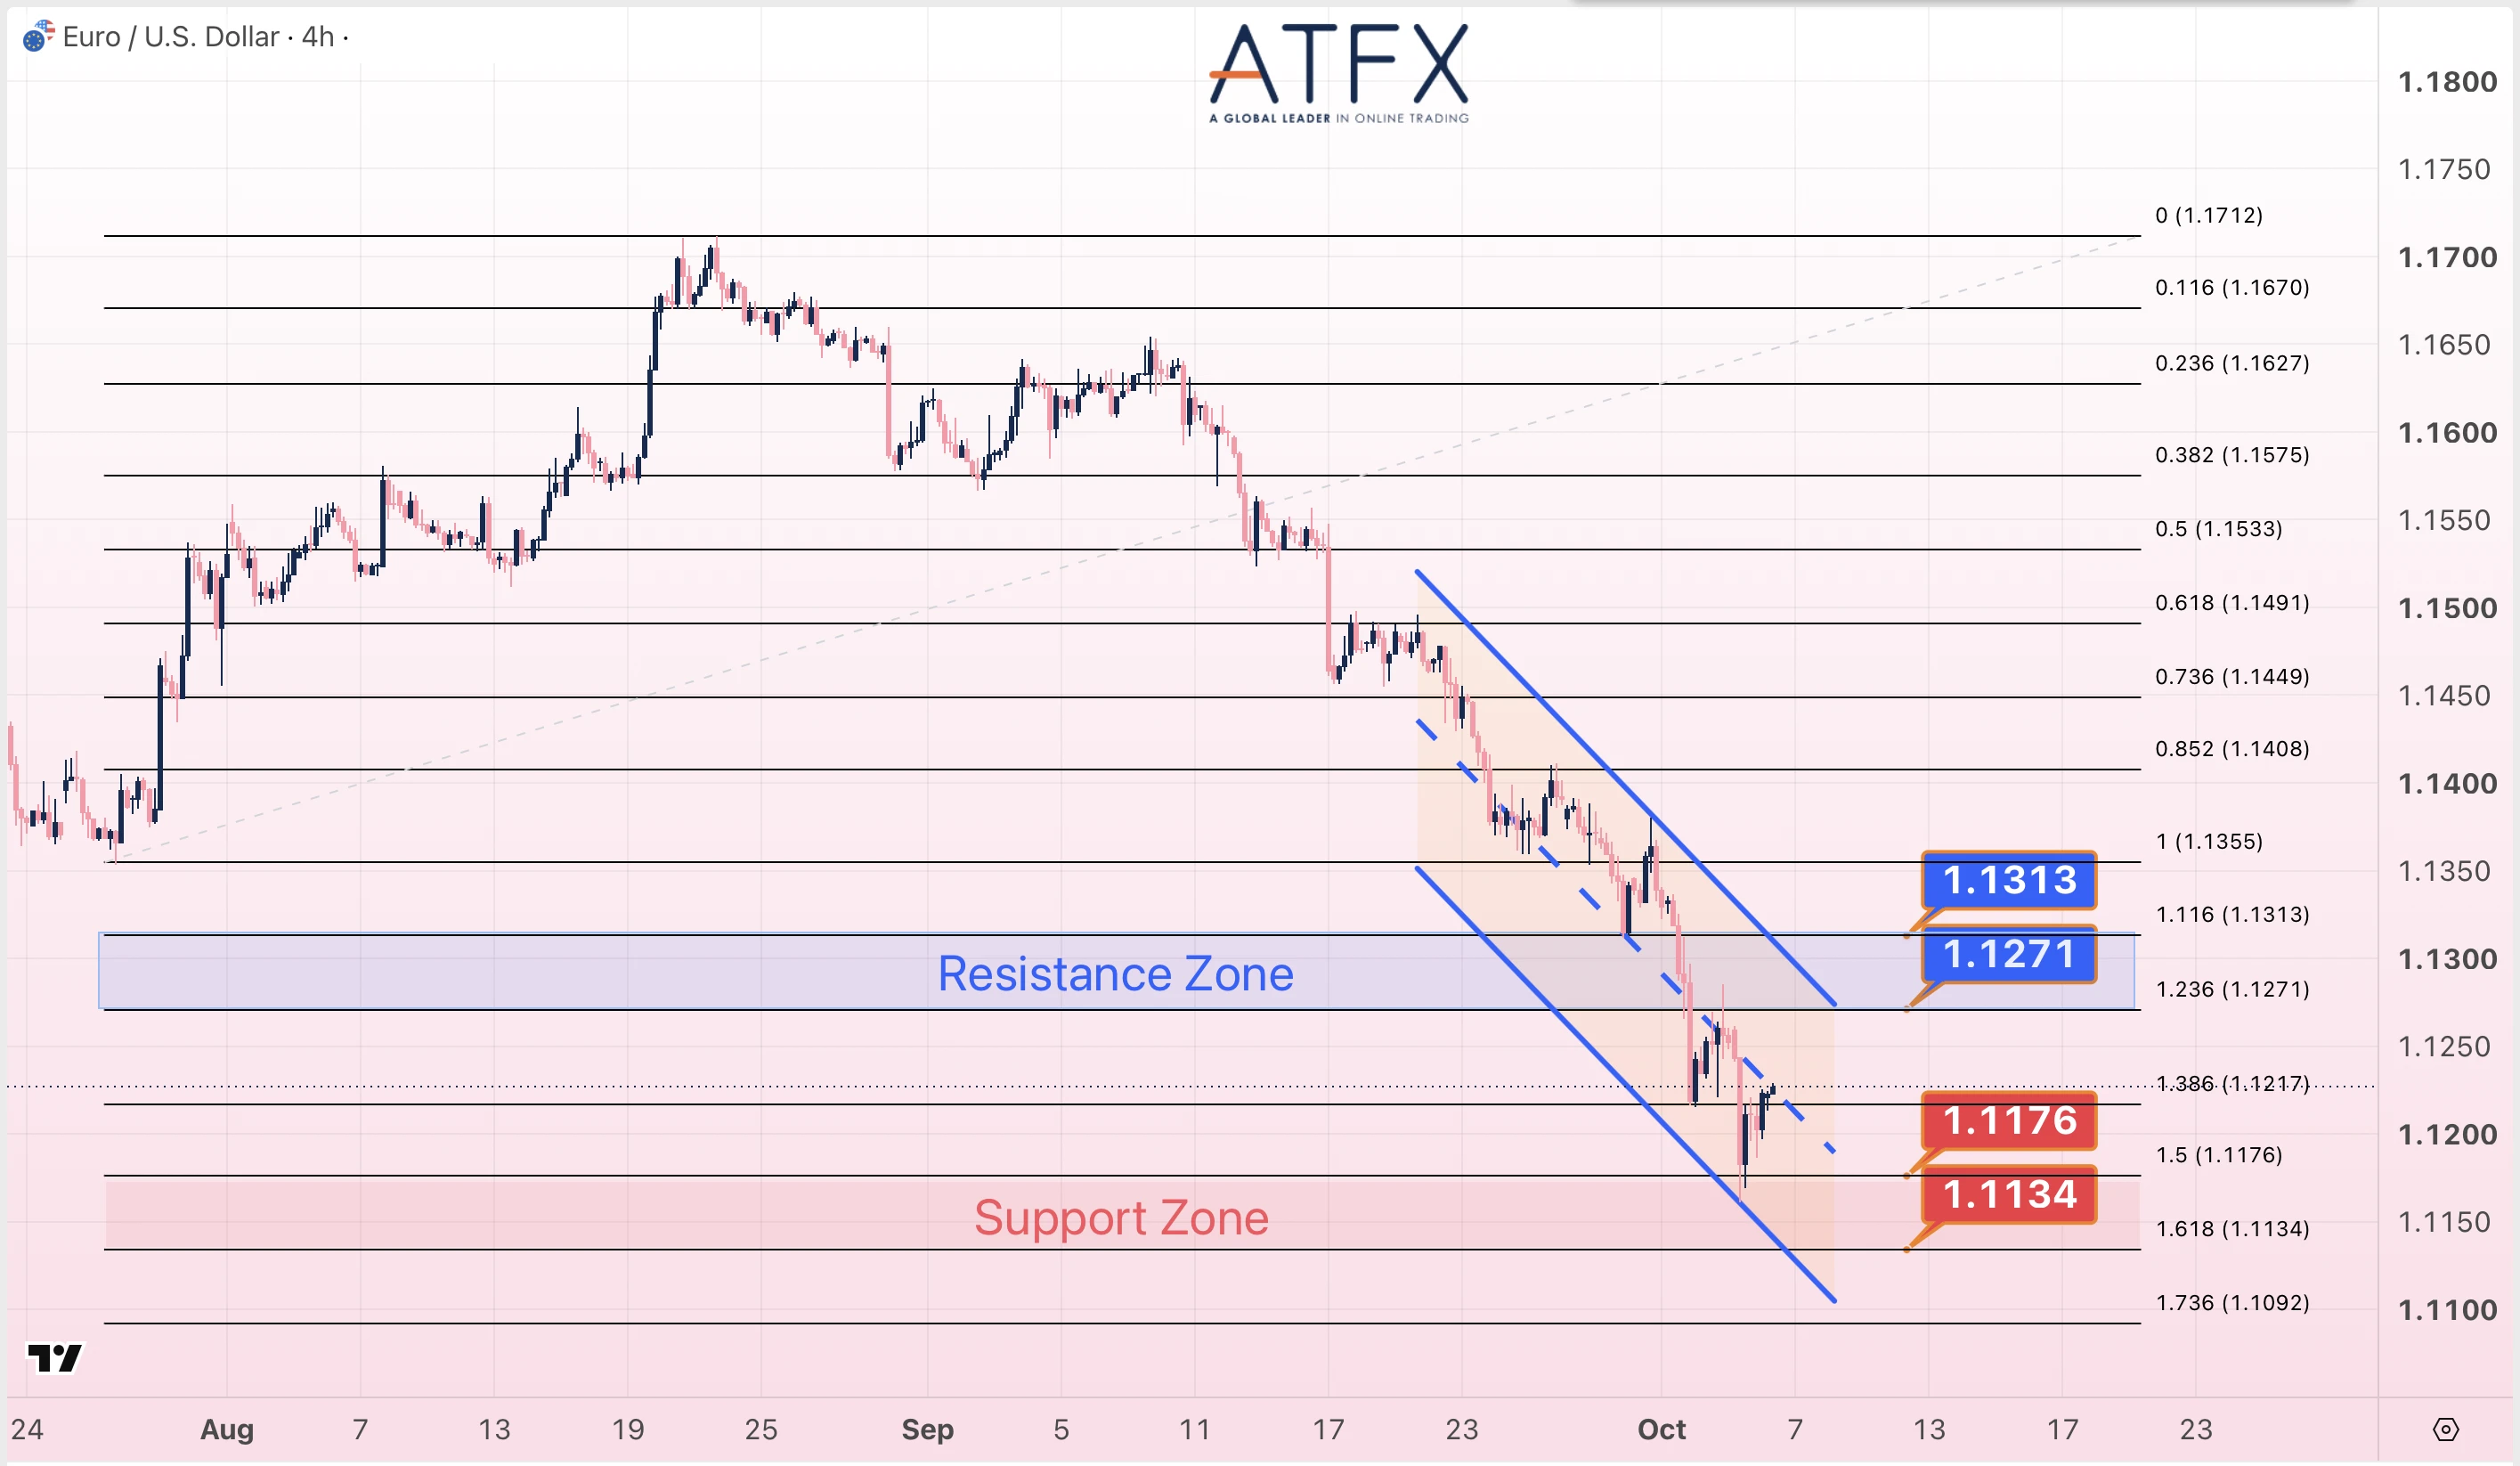
- Resistance: 1.1271 / 1.1313
- Support: 1.1176 / 1.1134
Analyst View: Price oscillates between 1.1163 and 1.1230. The hourly chart shows the 10MA crossing above the 20MA, signaling short-term bullish momentum. RSI at 54 suggests room for upside. A short-term rebound toward 1.1271 is possible if EU retail sales surprise positively.
Bias: Cautiously bullish intraday; initial watch 1.1176 support.
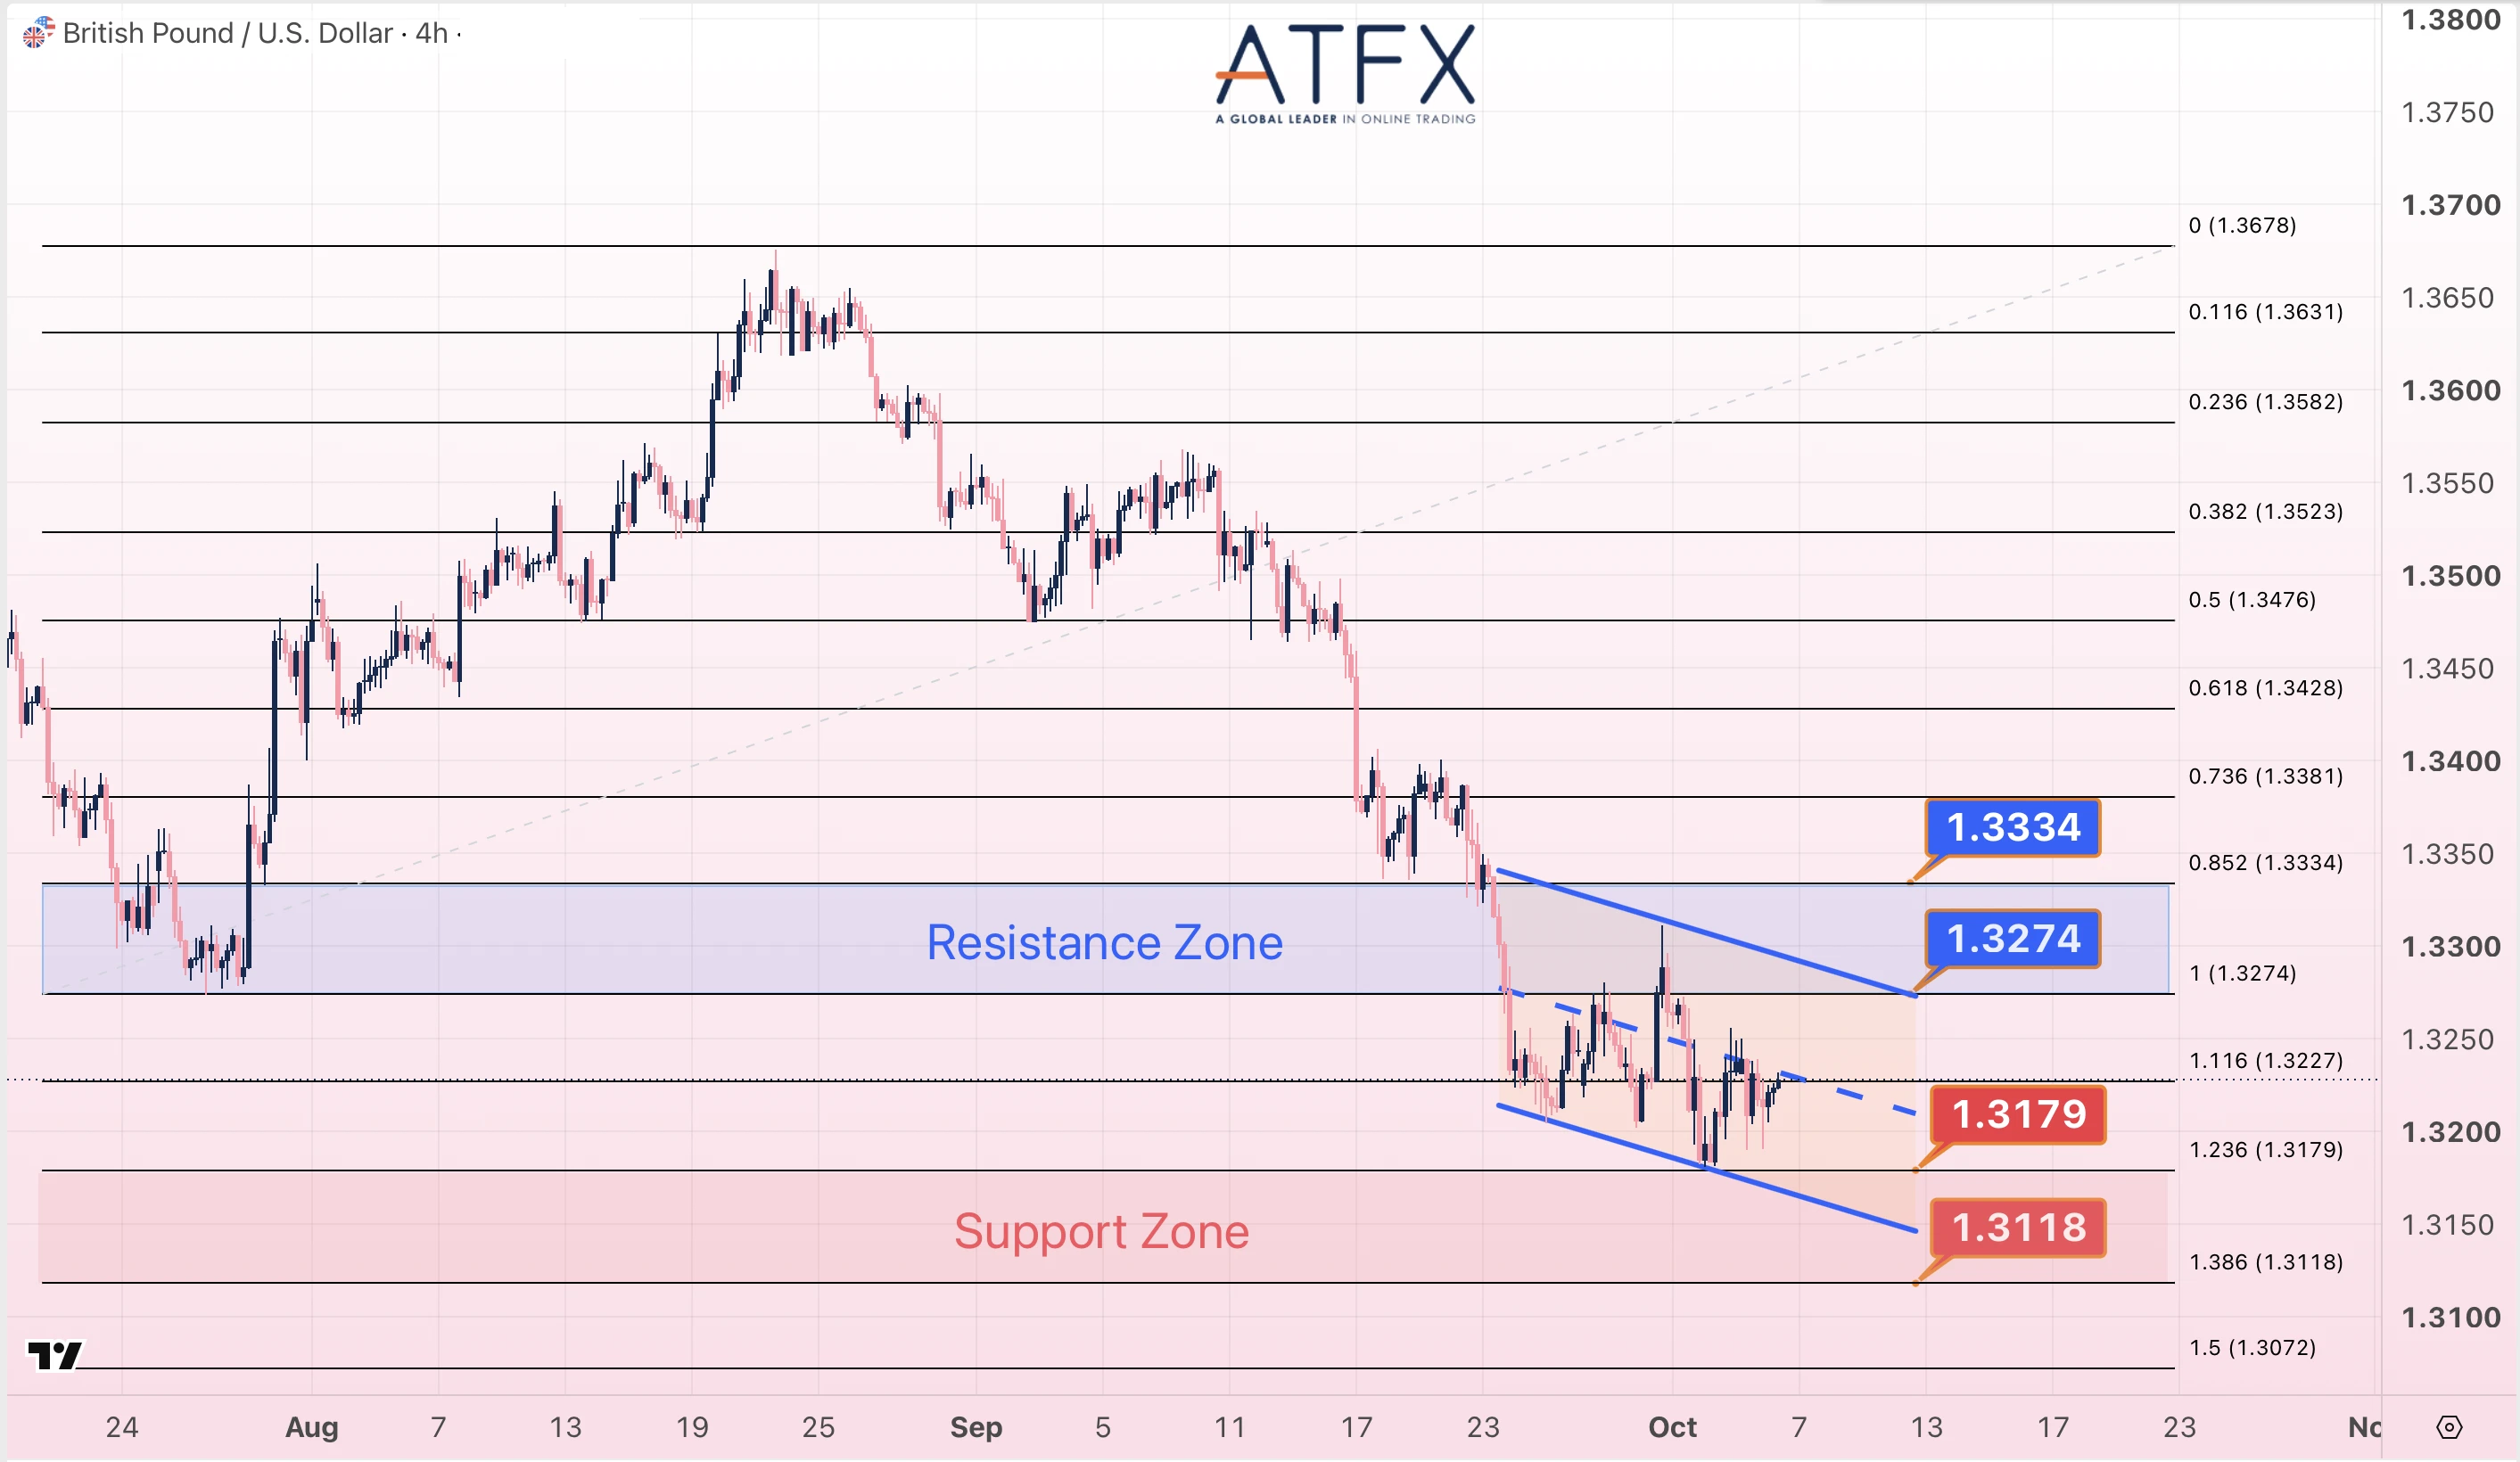
- Resistance: 1.3274 / 1.3334
- Support: 1.3179 / 1.3118
Analyst View: On the 4H chart, price remains below the 1.3334 resistance level, and the RSI is neutral around 51, indicating consolidation rather than a clear breakout. Upside momentum is intact but capped by macro uncertainty. A break above 1.3334 would confirm recovery.
Bias: Hovering near lows, cautiously bullish.
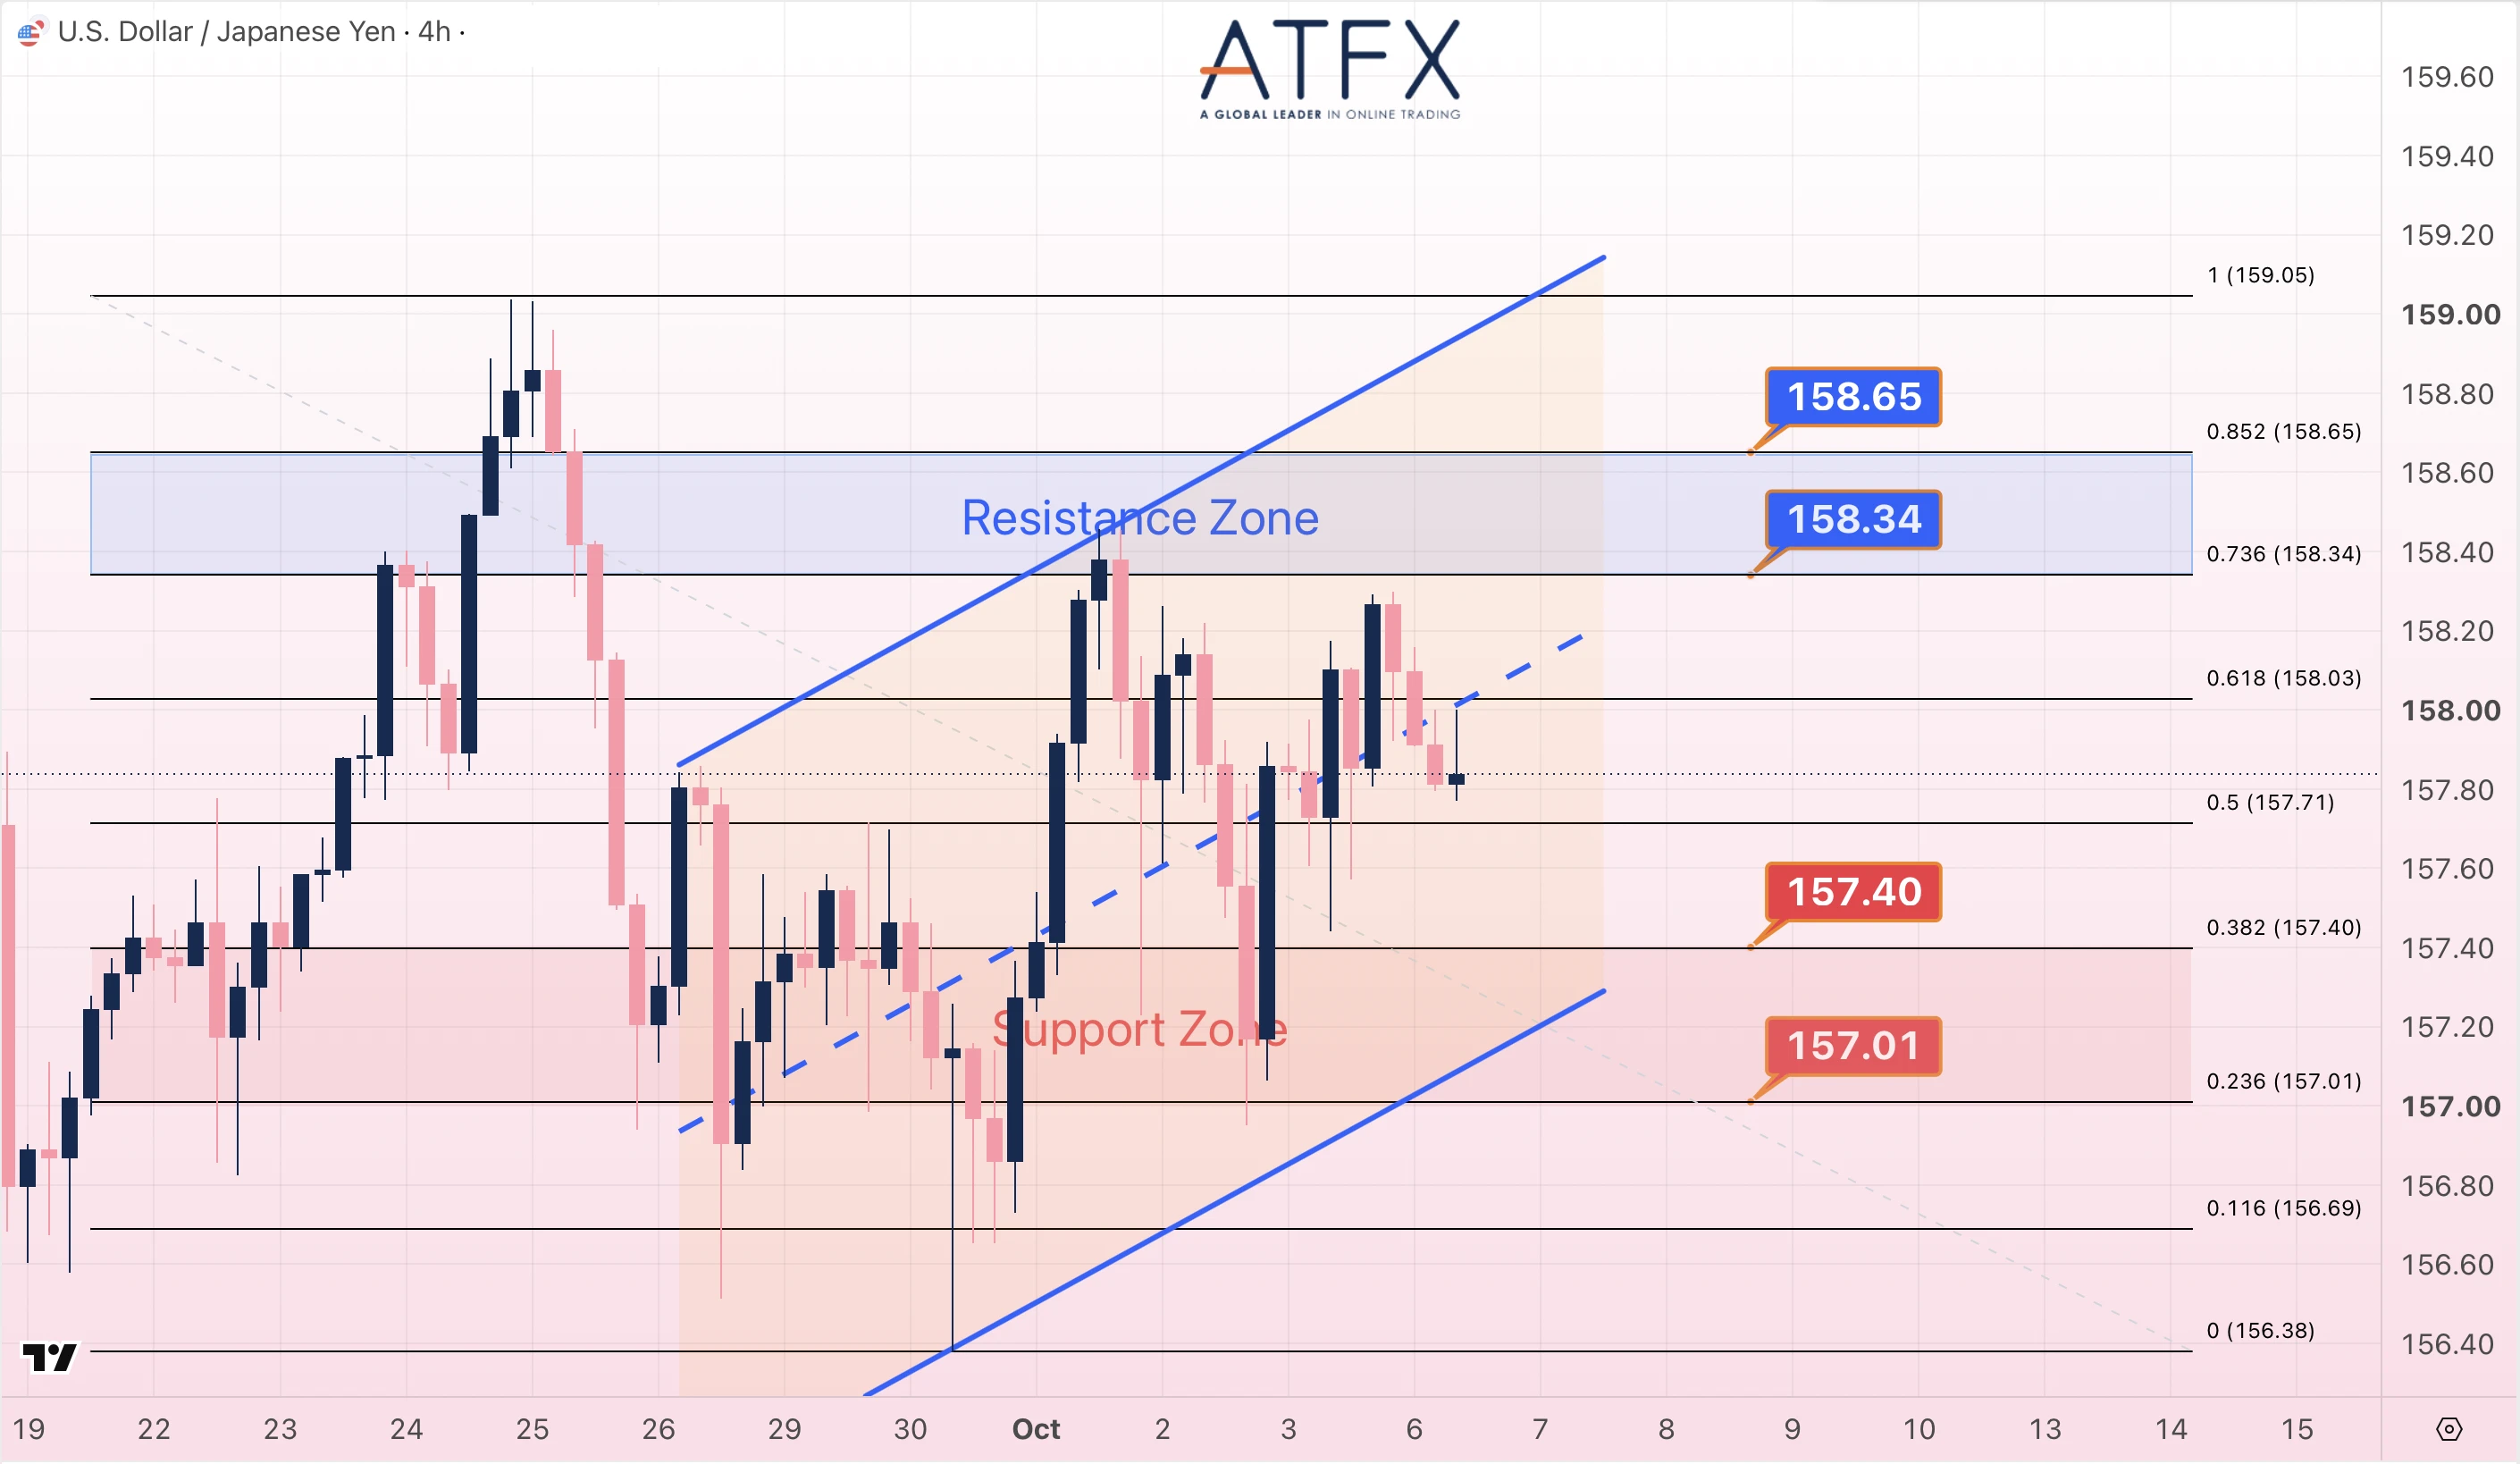
- Resistance: 158.34 / 158.65
- Support: 157.40 / 157.01
Analyst View: Price is testing the 157.40 support level. On the 4H chart, price is consolidating near 158.00, with the RSI at 47 and momentum largely flat. There is downside risk if 157.01 breaks; BoJ commentary could trigger volatility.
Bias: Mild decline; watch support.
WTI Crude (Dec)
- Resistance: 90.82 / 91.78
- Support: 87.75 / 86.78
Analyst View: On the 1H chart, price is oscillating around $89.50, while the 10MA is below the 20MA and an RSI near 46 signals bearish pressure. On the 4H chart, it’s still holding above the $88.70 support level, with a neutral RSI around 50, indicating flat momentum. Analysts note that tonight’s inventory data could shift the direction; an upside move is more likely if $91.78 is broken.
Bias: Oscillating with bullish bias.
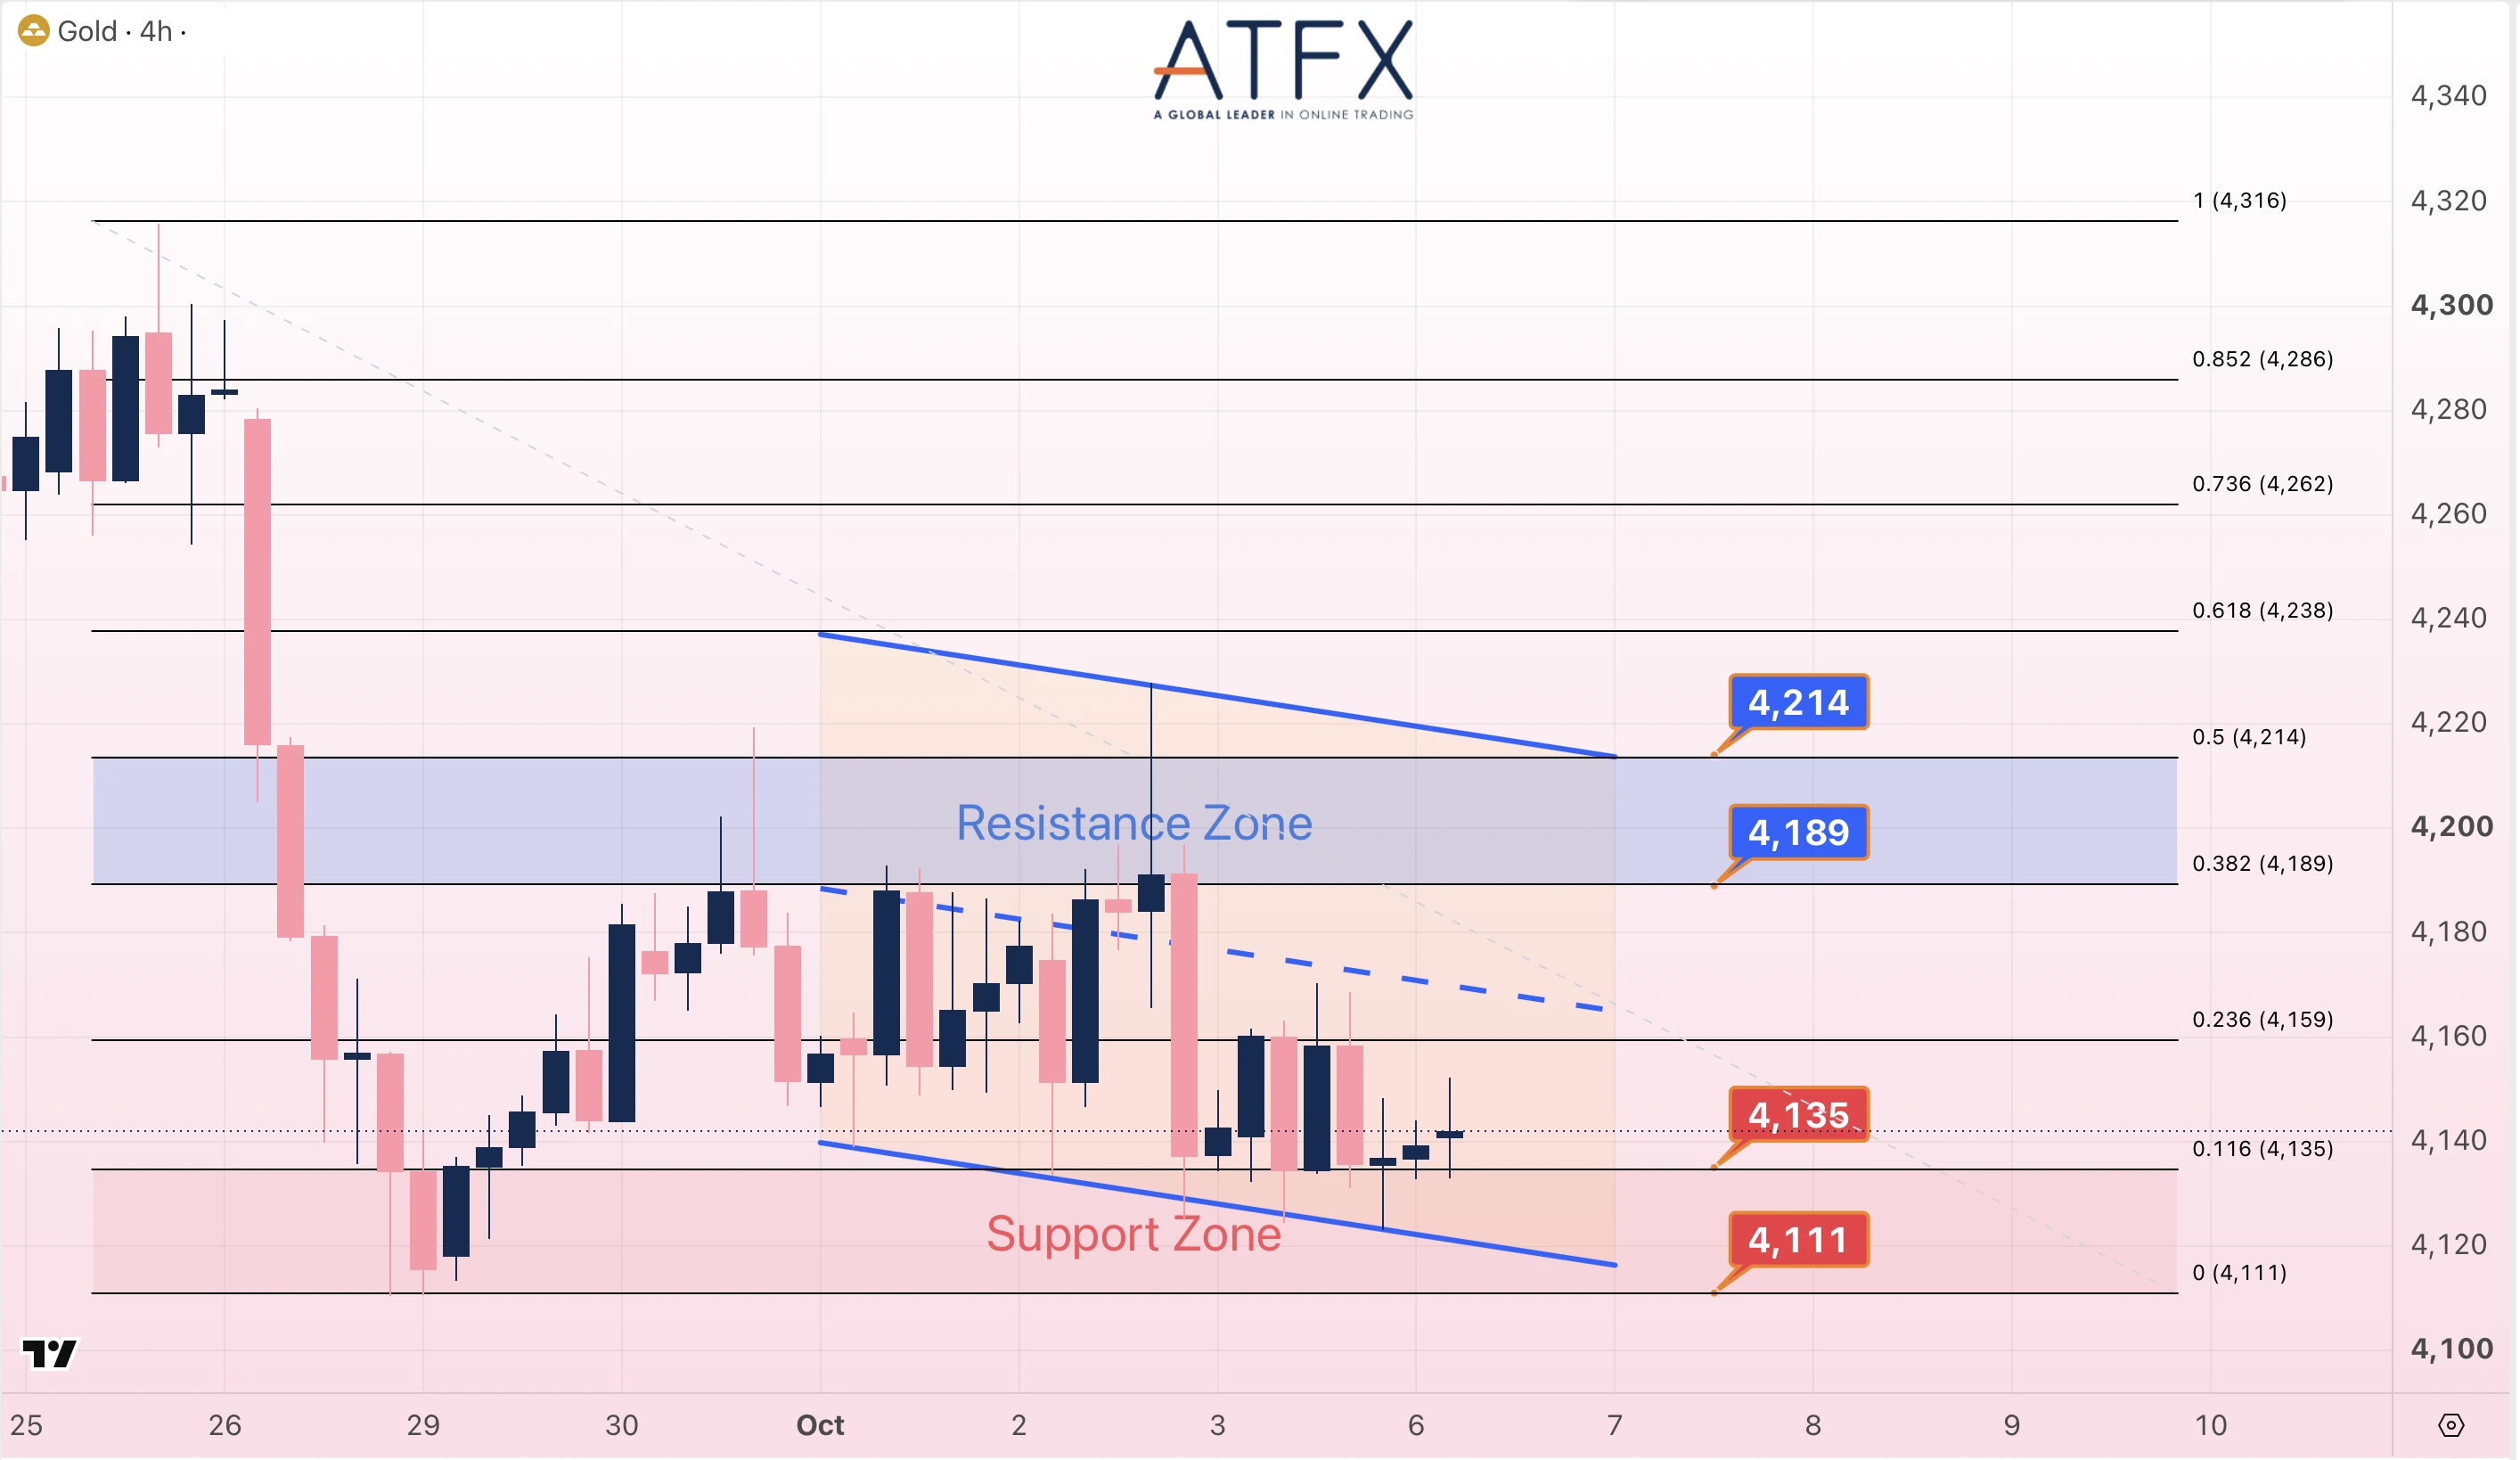
- Resistance: 4189 / 4214
- Support: 4135 / 4111
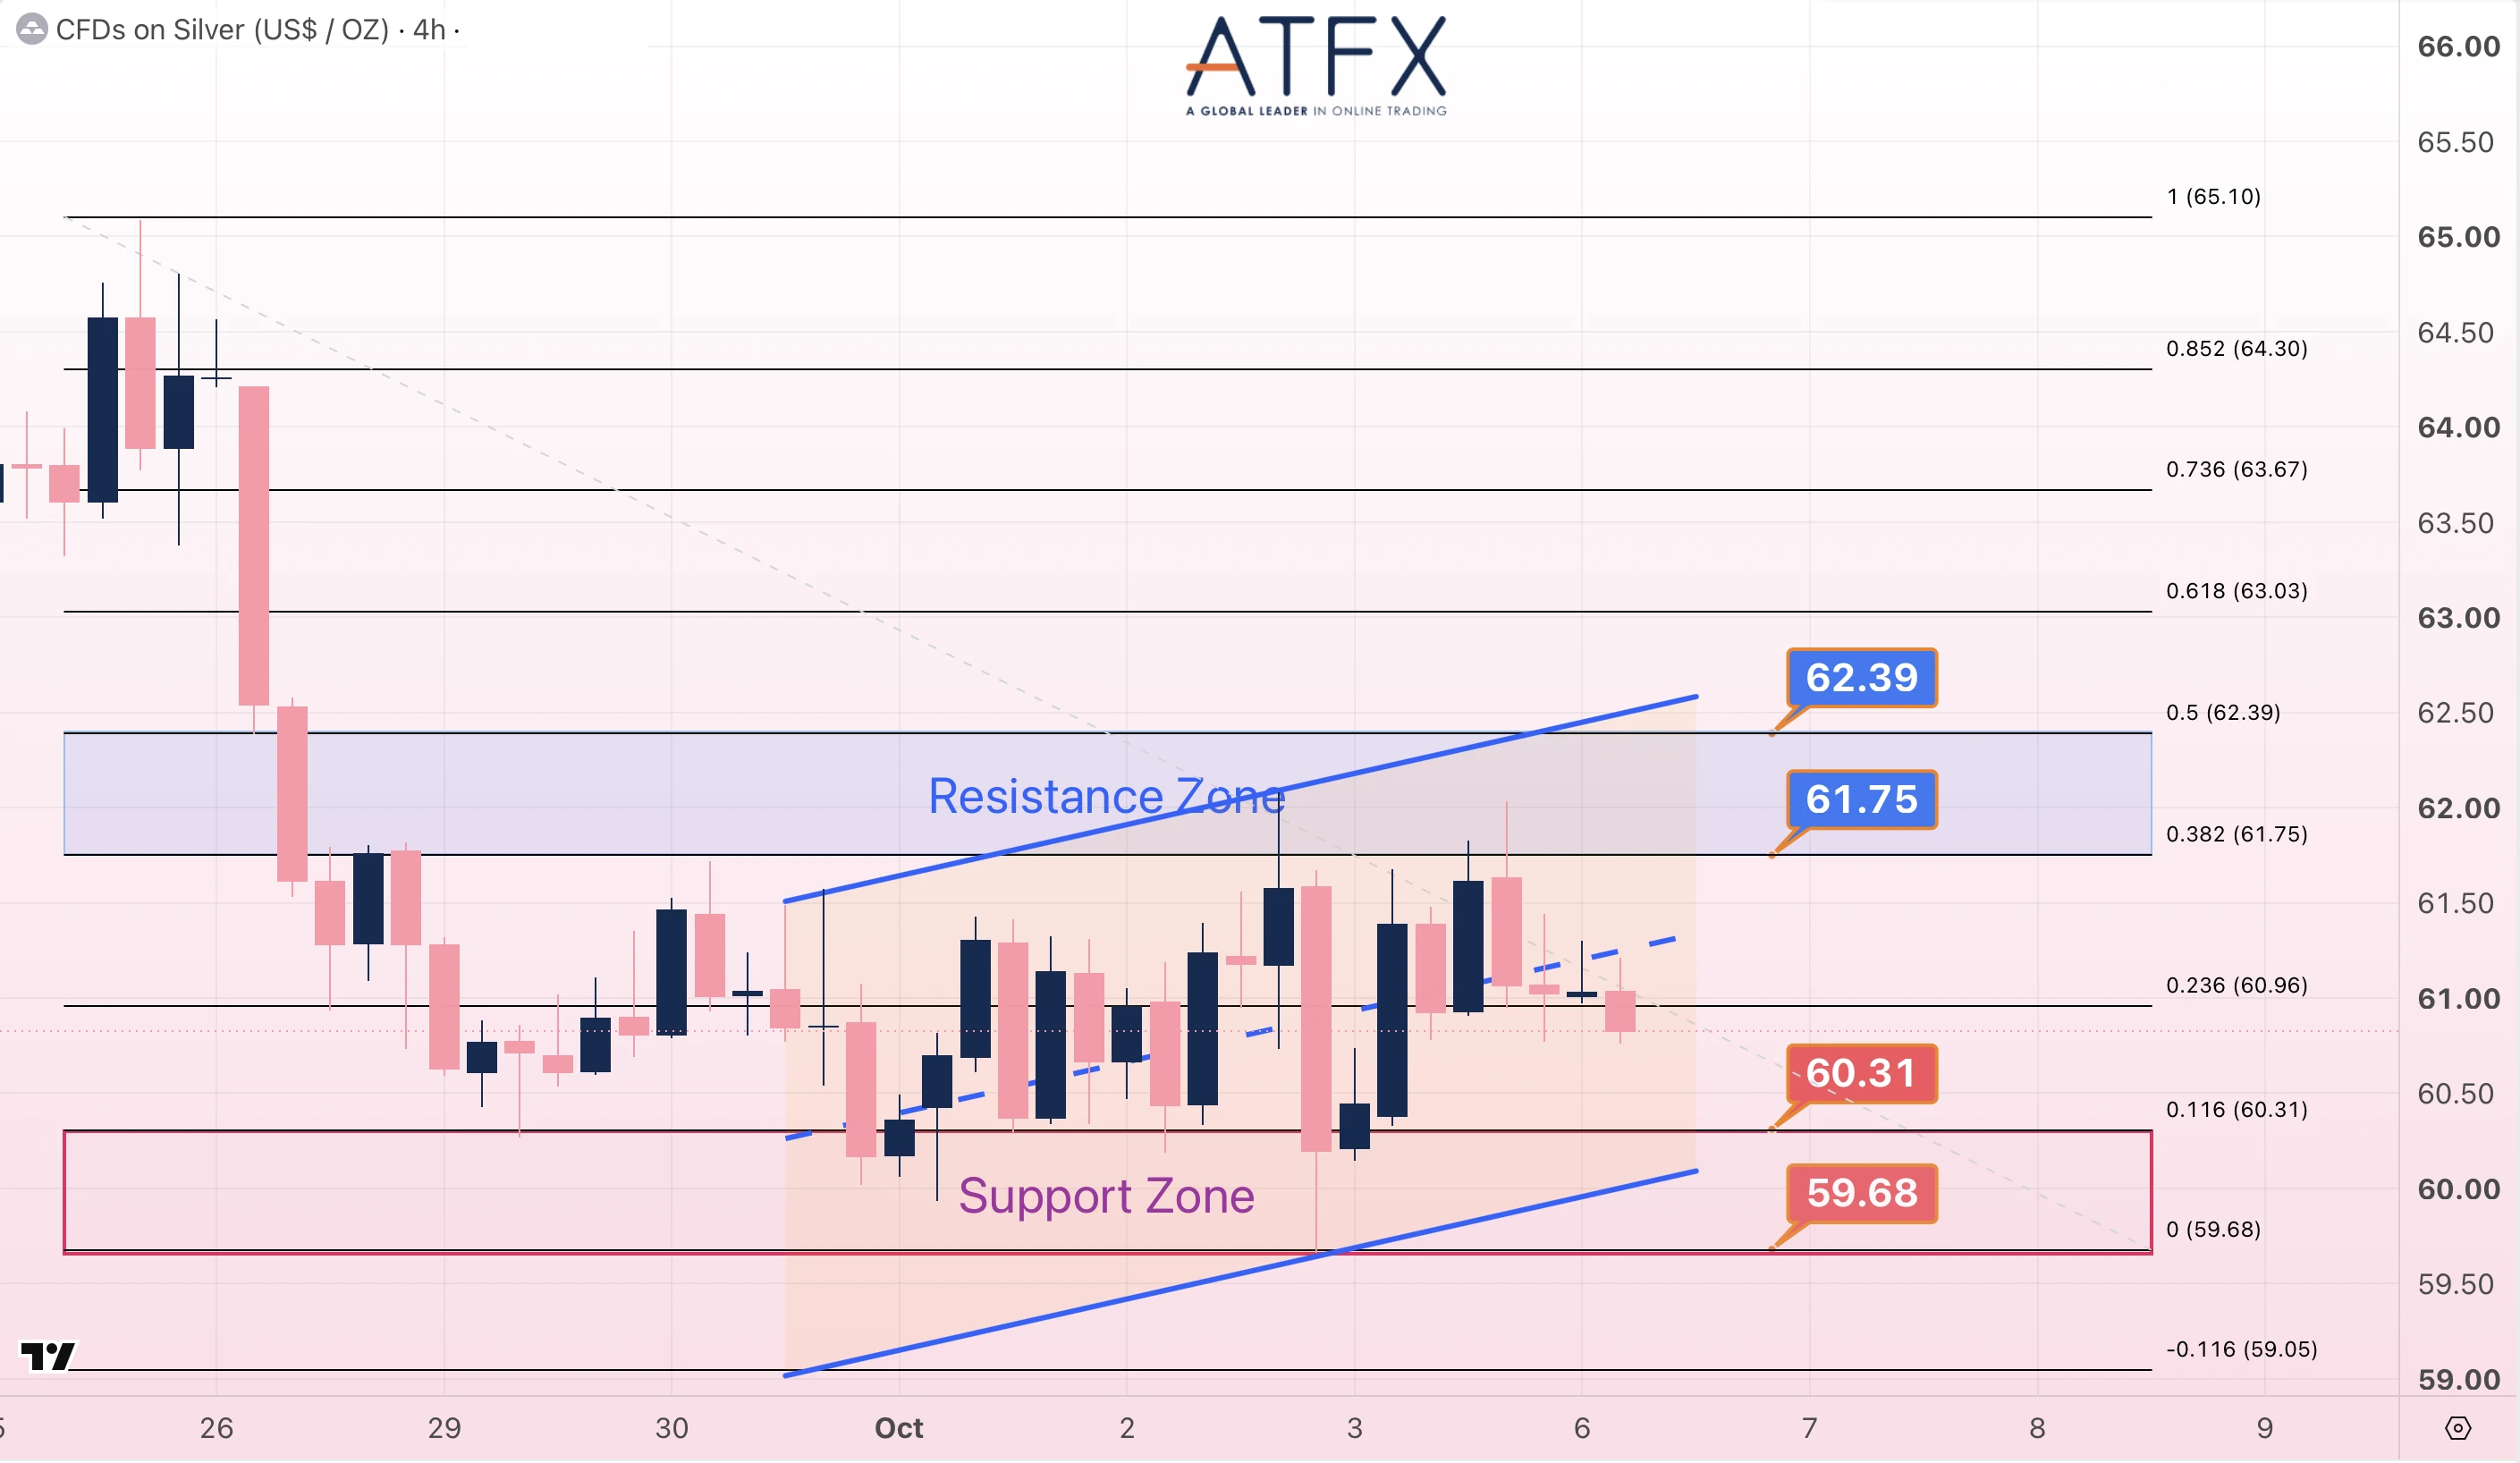
- Resistance: 61.75 / 62.39
- Support: 60.31 / 59.68
Analyst View: Price is consolidating near $4,168, with the 10MA above the 20MA and RSI near 58, signaling bullish momentum on the 1H chart. On the 4H chart, price remains above the $4,135 support level, with RSI around 52 and MACD showing improving momentum. Analysts expect a push toward the $4,189–$4,214 resistance zone, with downside risk to $4,111 if $4,135 breaks. Silver is tracking gold; expect consolidation in the 60–62 range.
Bias: Cautiously bullish.
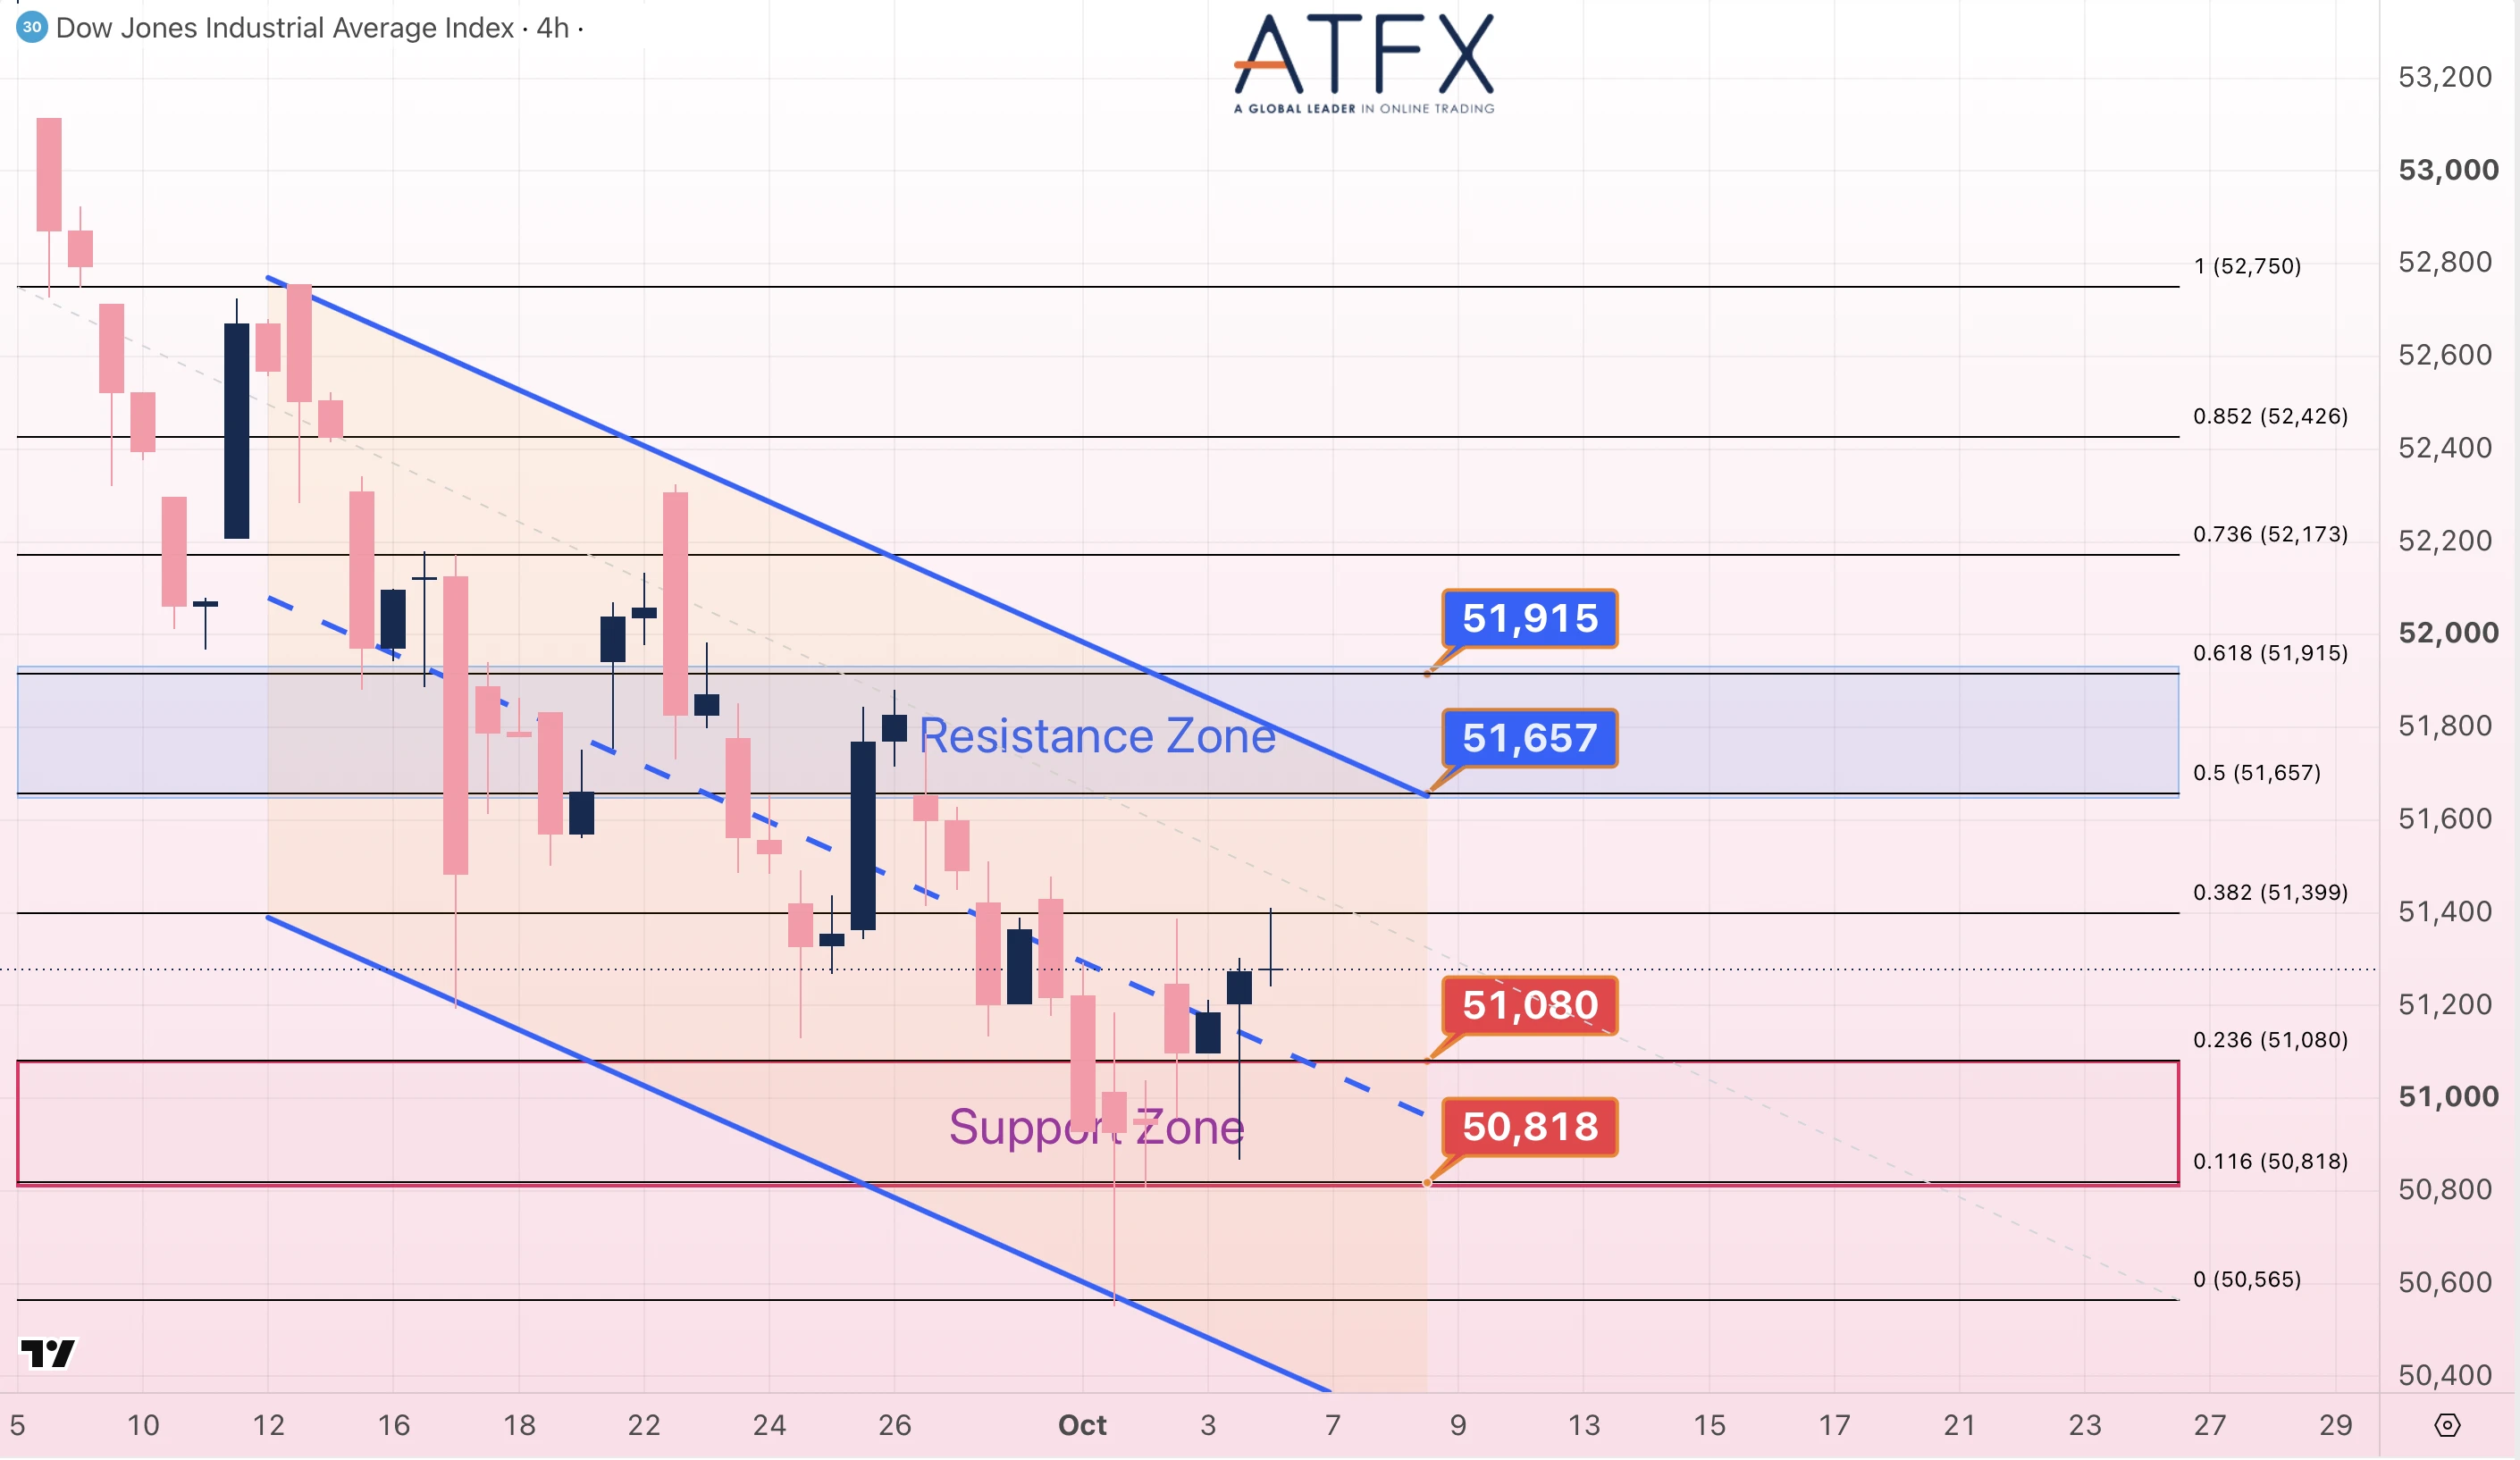
- Resistance: 51657 / 51915
- Support: 51080 / 50818
Analyst View: On the 1H chart, price is consolidating near 51,300, with the 10MA above the 20MA and RSI around 56, indicating a mild bullish bias. On the 4H chart, price remains capped below the 51,648 resistance level, while RSI is neutral near 52. Overall, the rebound appears modestly constructive, but traders should watch the U.S. trade balance for potential volatility.
Bias: Mild rebound.
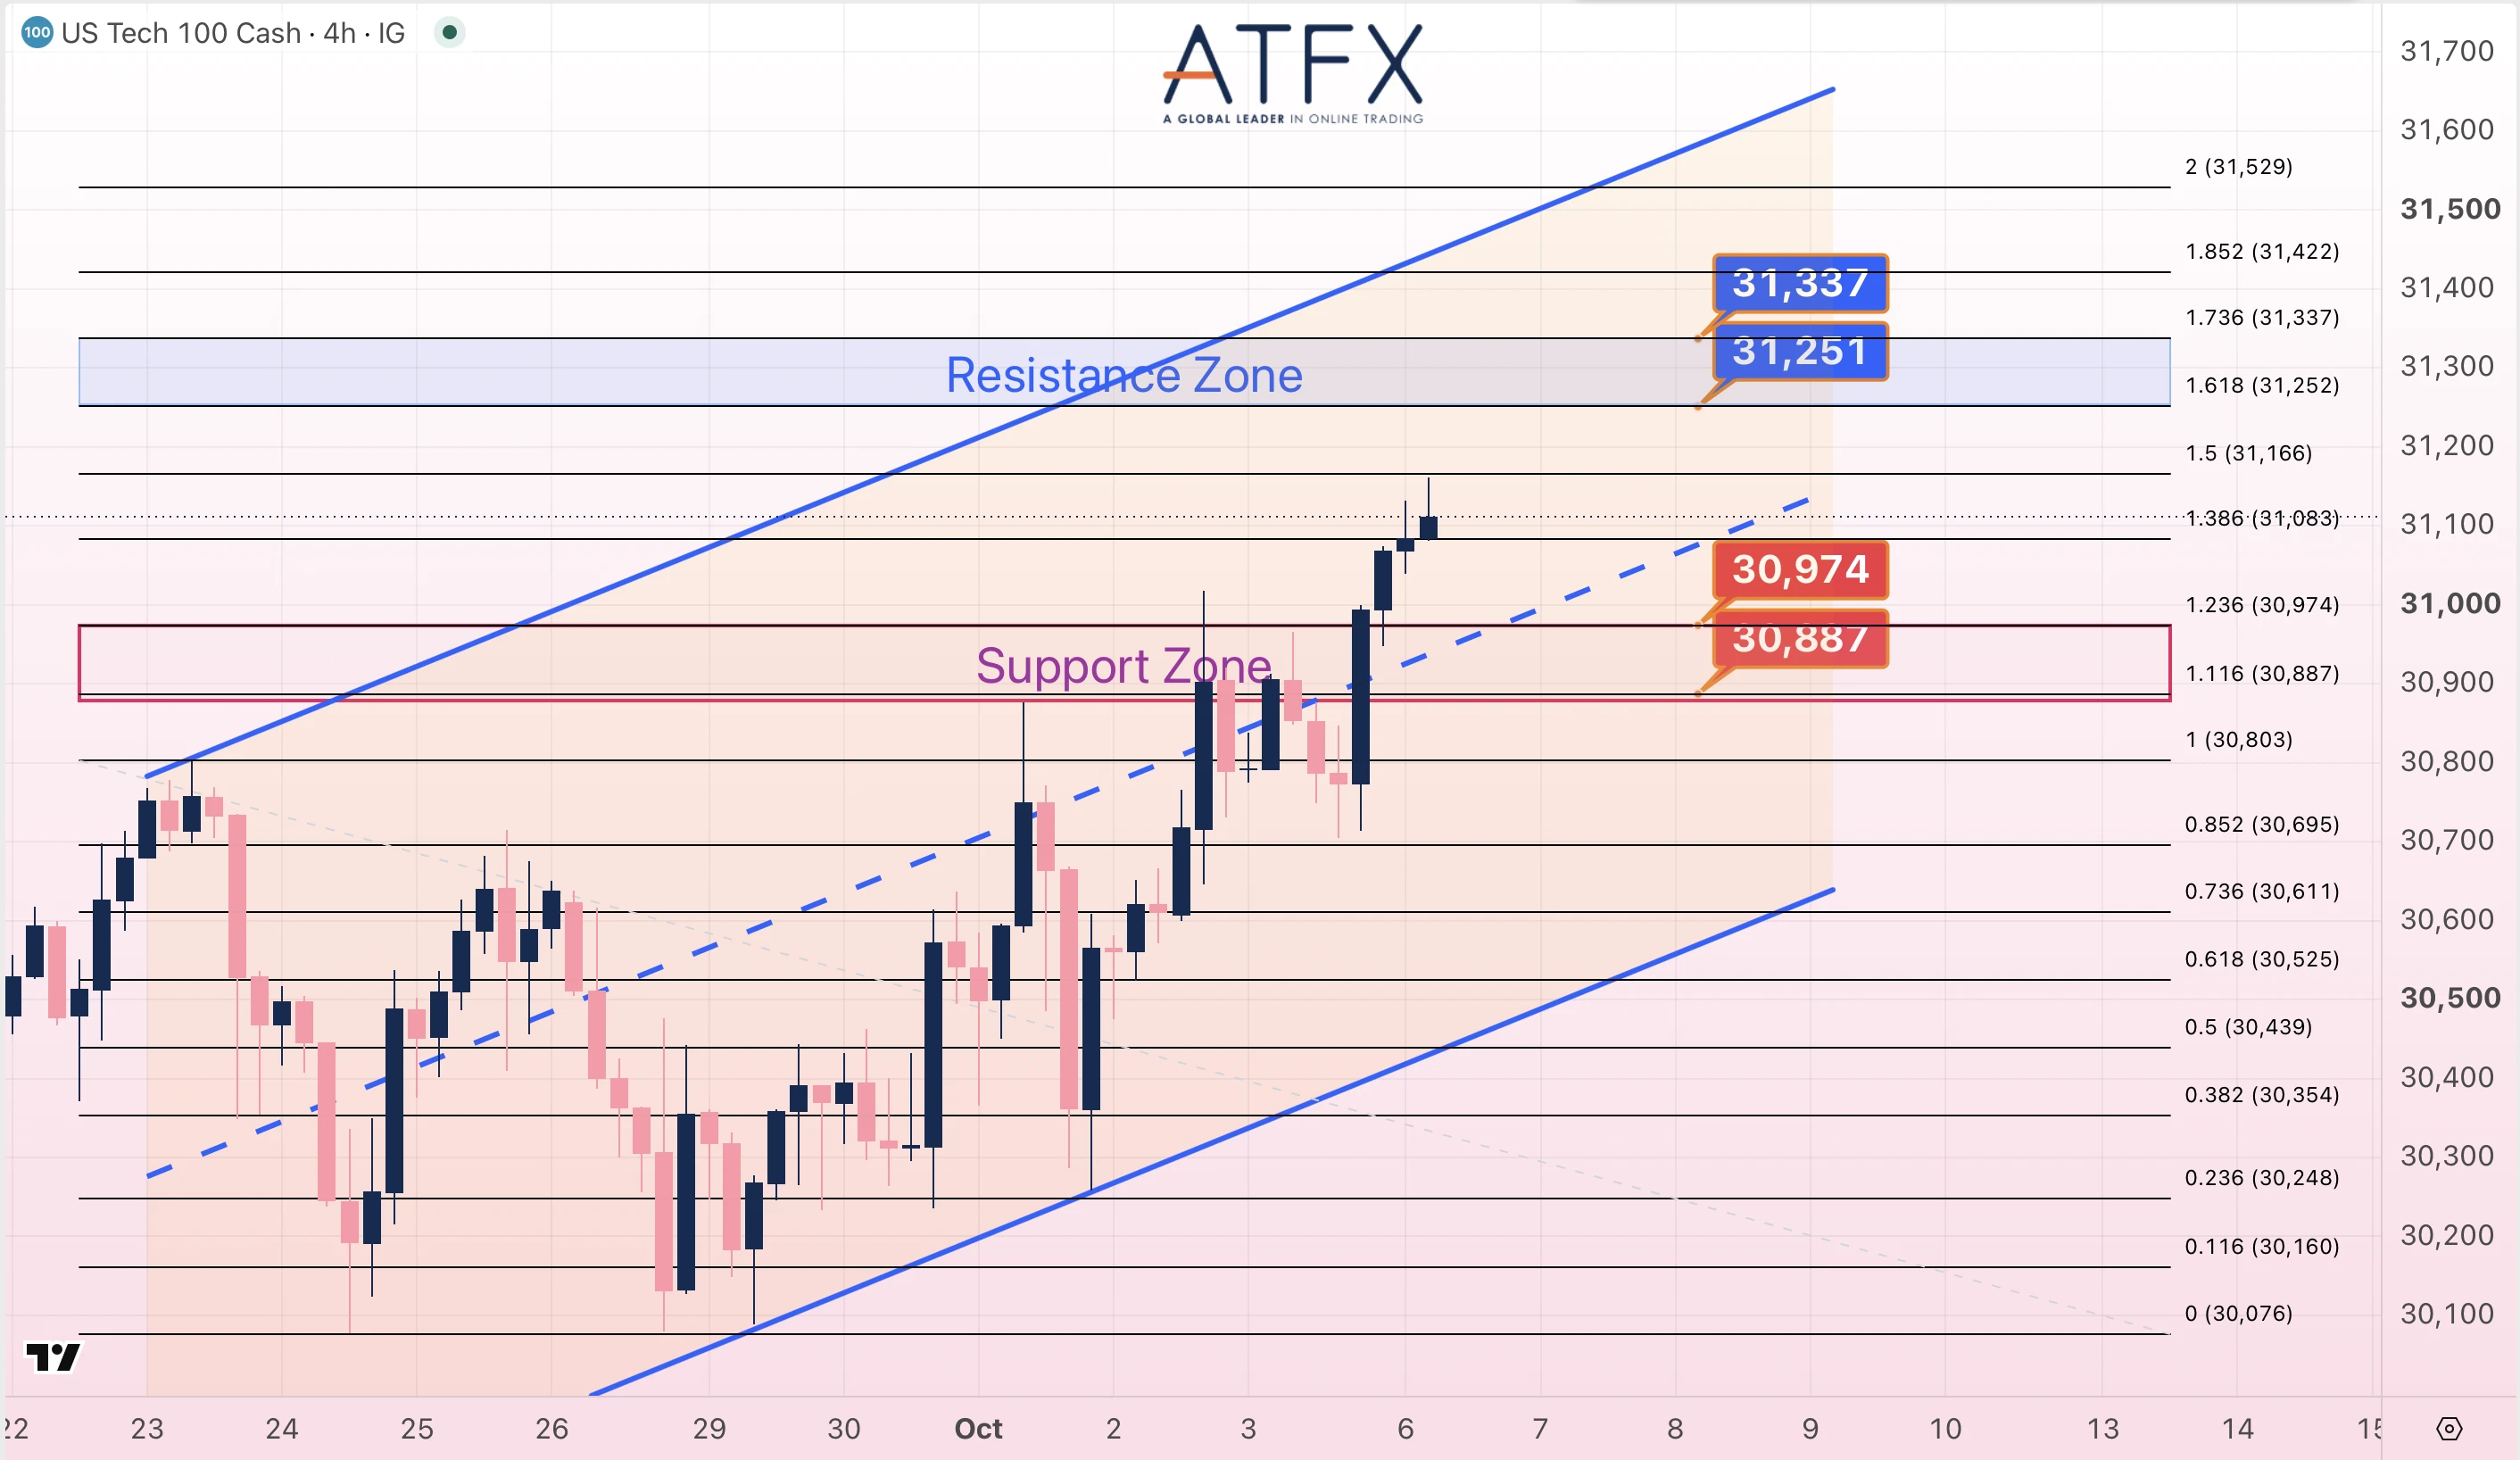
- Resistance: 31251 / 31337
- Support: 30974 / 30887
Analyst View: The 1H chart shows price holding above 30,974, with the 10MA above the 20MA and RSI near 61, signaling strong bullish momentum. On the 4H chart, RSI is near 55, and momentum is supportive, though price remains capped below the 31,251 resistance. Analysts expect tech-led strength to persist, with tonight’s U.S. trade balance extending the rally.
Bias: Mild rebound.
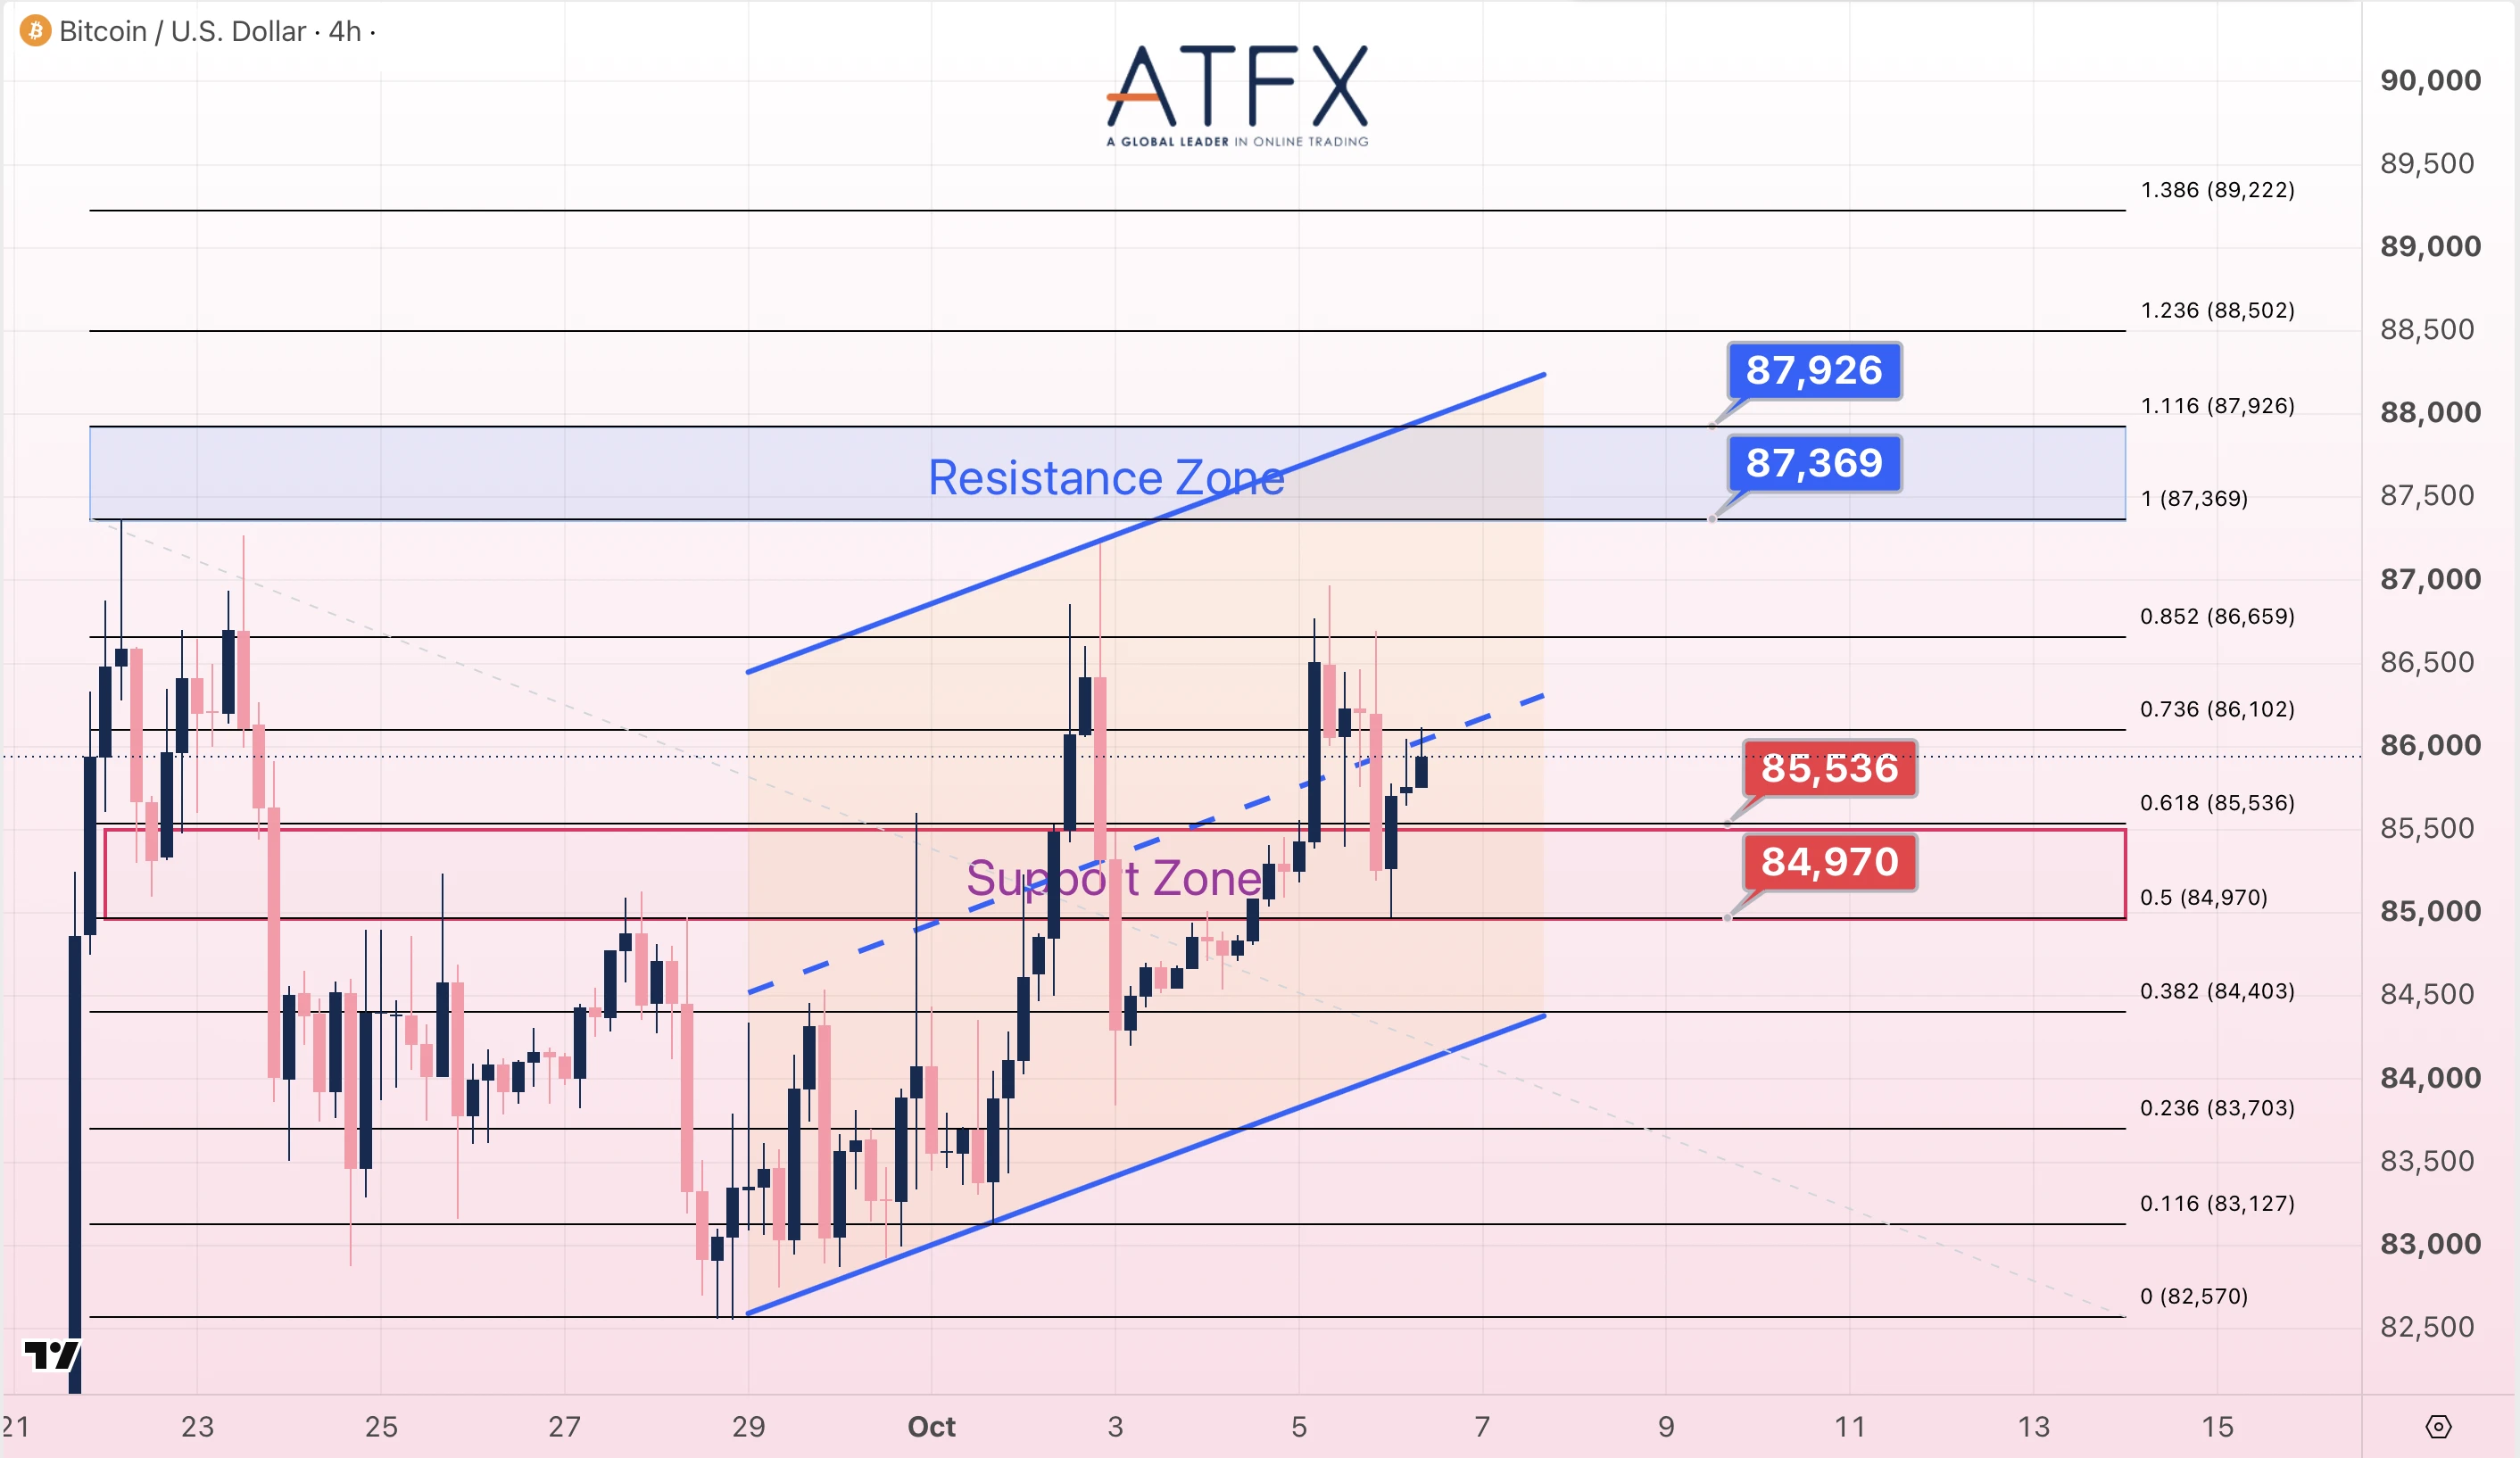
- Resistance: 87369 / 87926
- Support: 85536 / 84970
Analyst View: Bitcoin is consolidating around $86,000, with the 10MA above the 20MA and RSI near 59, indicating a bullish bias on the 1H chart. On the 4H chart, RSI is neutral around 52, and price remains capped below the $87,926 resistance level. Analysts note ETF inflows are supportive, but a correction is possible if $85,536 breaks.
Bias: Short-term bullish, medium-term cautious.
Disclaimer: This analysis is for reference only and does not constitute investment advice.