

(By ATFX Analyst Team)
Key Takeaways
Suspension of crude loading operations at Saudi Arabia’s Yanbu export hub and the cancellation of shipments to Europe have heightened concerns about prolonged disruptions to a critical oil export route, exacerbating supply constraints. The Federal Reserve is widely expected to raise its policy rate by 25 basis points to 3.75%–4.00%, the first such move since 2023. Market participants will focus on the updated dot plot and revised economic and inflation projections for signals about future policy direction. A more hawkish tone could heighten downside risks for U.S. equities and gold. |
Global Market Review 16/09/2026
- U.S. equities retreated as rising oil prices and higher Treasury yields intensified market pressures.
- The U.S. 10-year yield reached its highest level since 2007, while the dollar strengthened against major currencies, approaching a two-week high.
- Gold prices eased amid higher yields and a stronger dollar.
- Heightened concerns about Middle East supply disruptions pushed crude oil (WTI) higher by more than 3%, marking its highest level since May.
Key Events Today:
| Time (GMT+8) | Event | Importance |
|---|---|---|
| 14:00 | GB CPI & PPI YoY AUG | *** |
| 17:00 | EU Industrial Production JUL | ** |
| 20:30 | US Retail Sales AUG | *** |
| 22:30 | EIA Crude Oil Stocks Change | ** |
Key Events on Sep 17 (GMT+8)
| Time (GMT+8) | Event | Importance |
|---|---|---|
| 02:00 | Fed Interest Rate Decision | *** |
| 02:30 | Fed Press Conference | *** |
| 06:45 | NZ GDP Q2 | ** |
| 17:00 | EU CPI Final AUG | ** |
| 19:00 | BoE Interest Rate Decision & Meeting Minutes | *** |
| 20:30 | US Housing Starts & Building Permits AUG | ** |
| 20:30 | US Initial Jobless Claims | *** |
| 22:00 | US Pending Home Sales AUG | ** |
Markets Analysis 16/09/2026
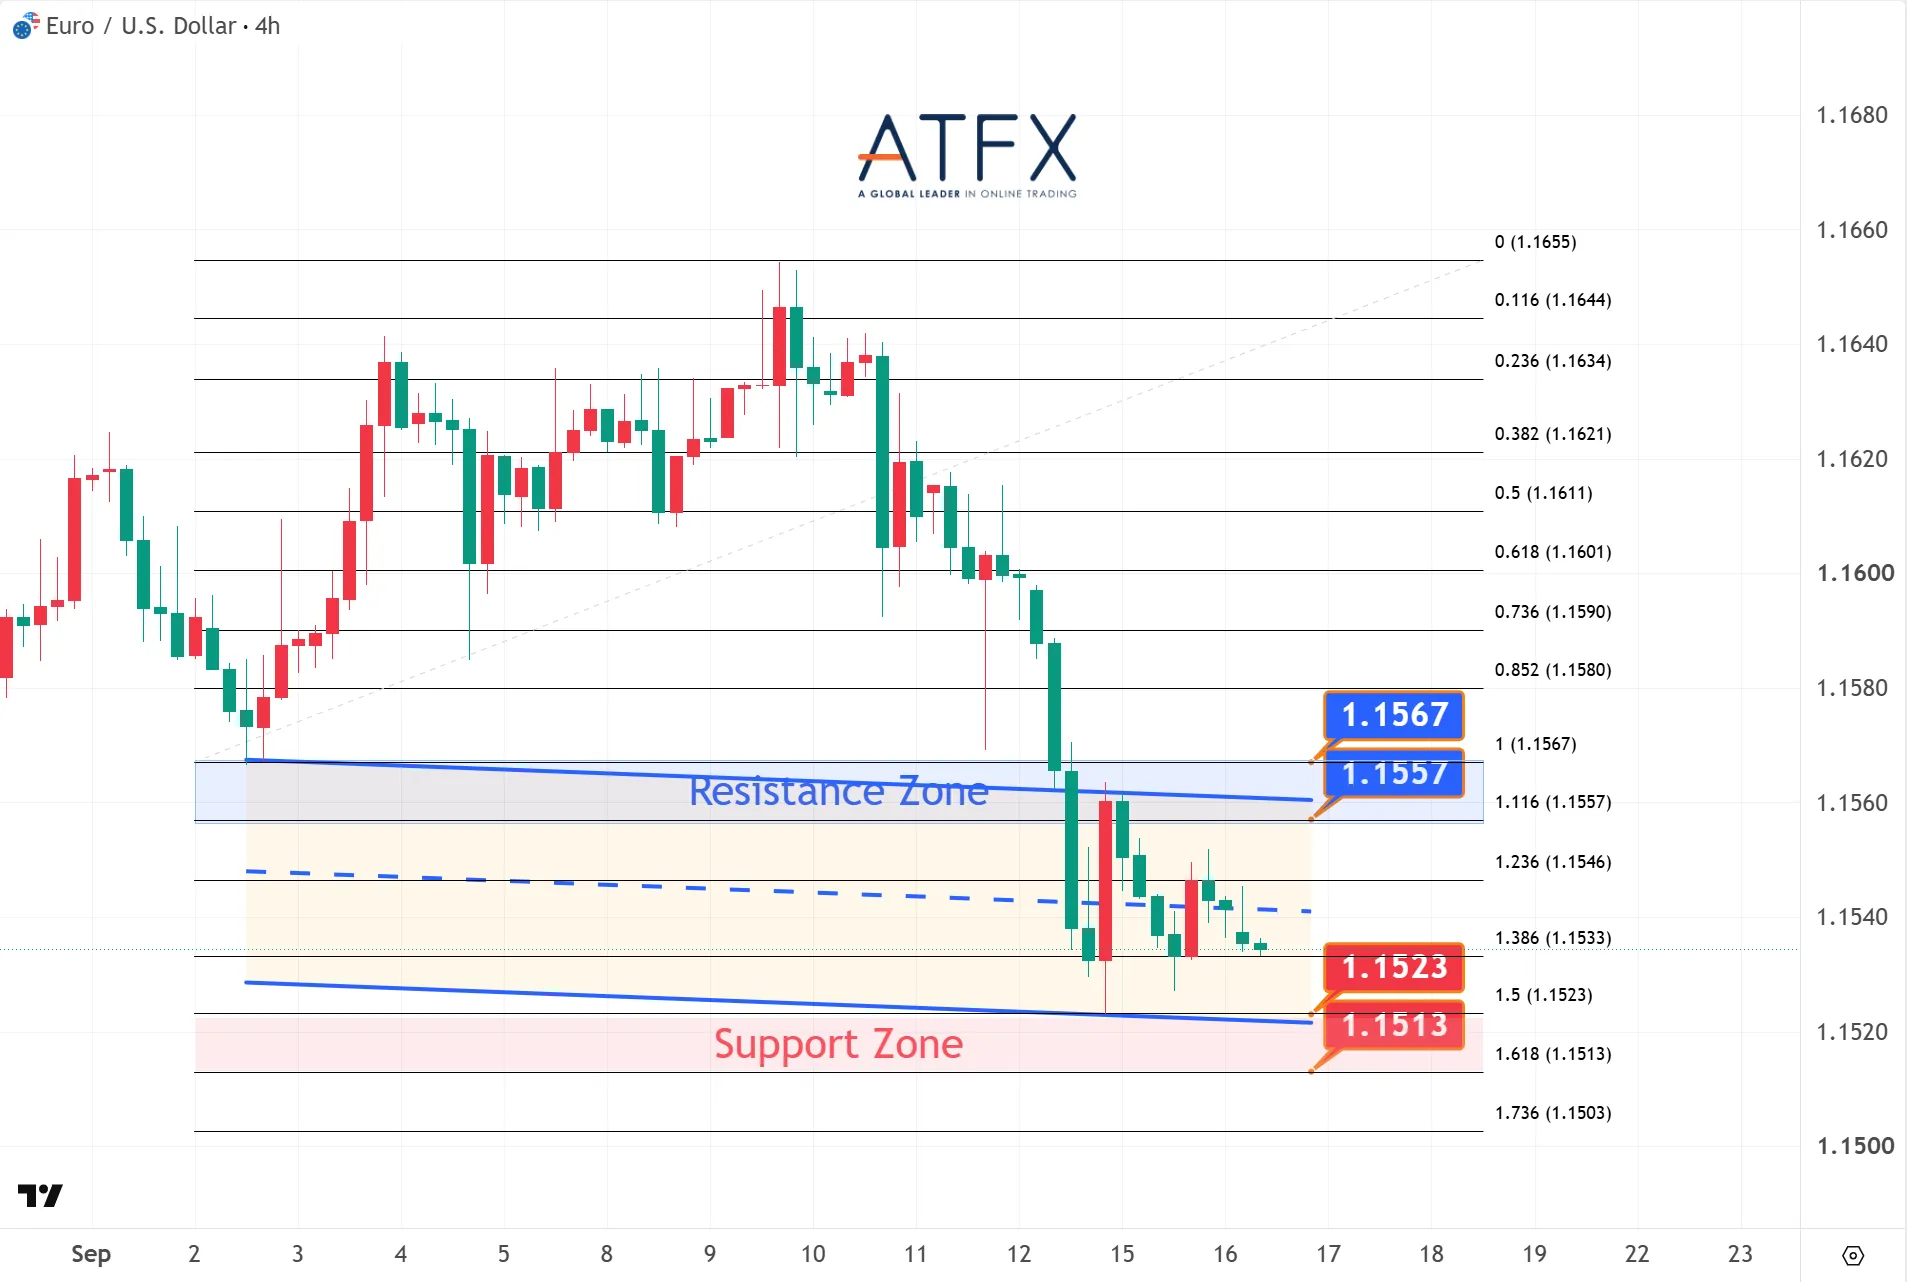
- Resistance: 1.1557 / 1.1567
- Support: 1.1523 / 1.1513
EUR/USD remained confined to a narrow range near recent lows, recording a fourth consecutive daily decline as the dollar held firm ahead of the Fed decision.
Analyst View: The pair remains under pressure. A hawkish Fed outcome could reinforce dollar strength and increase the likelihood of a move towards the 1.1500 area.
Bias: Wait-and-see
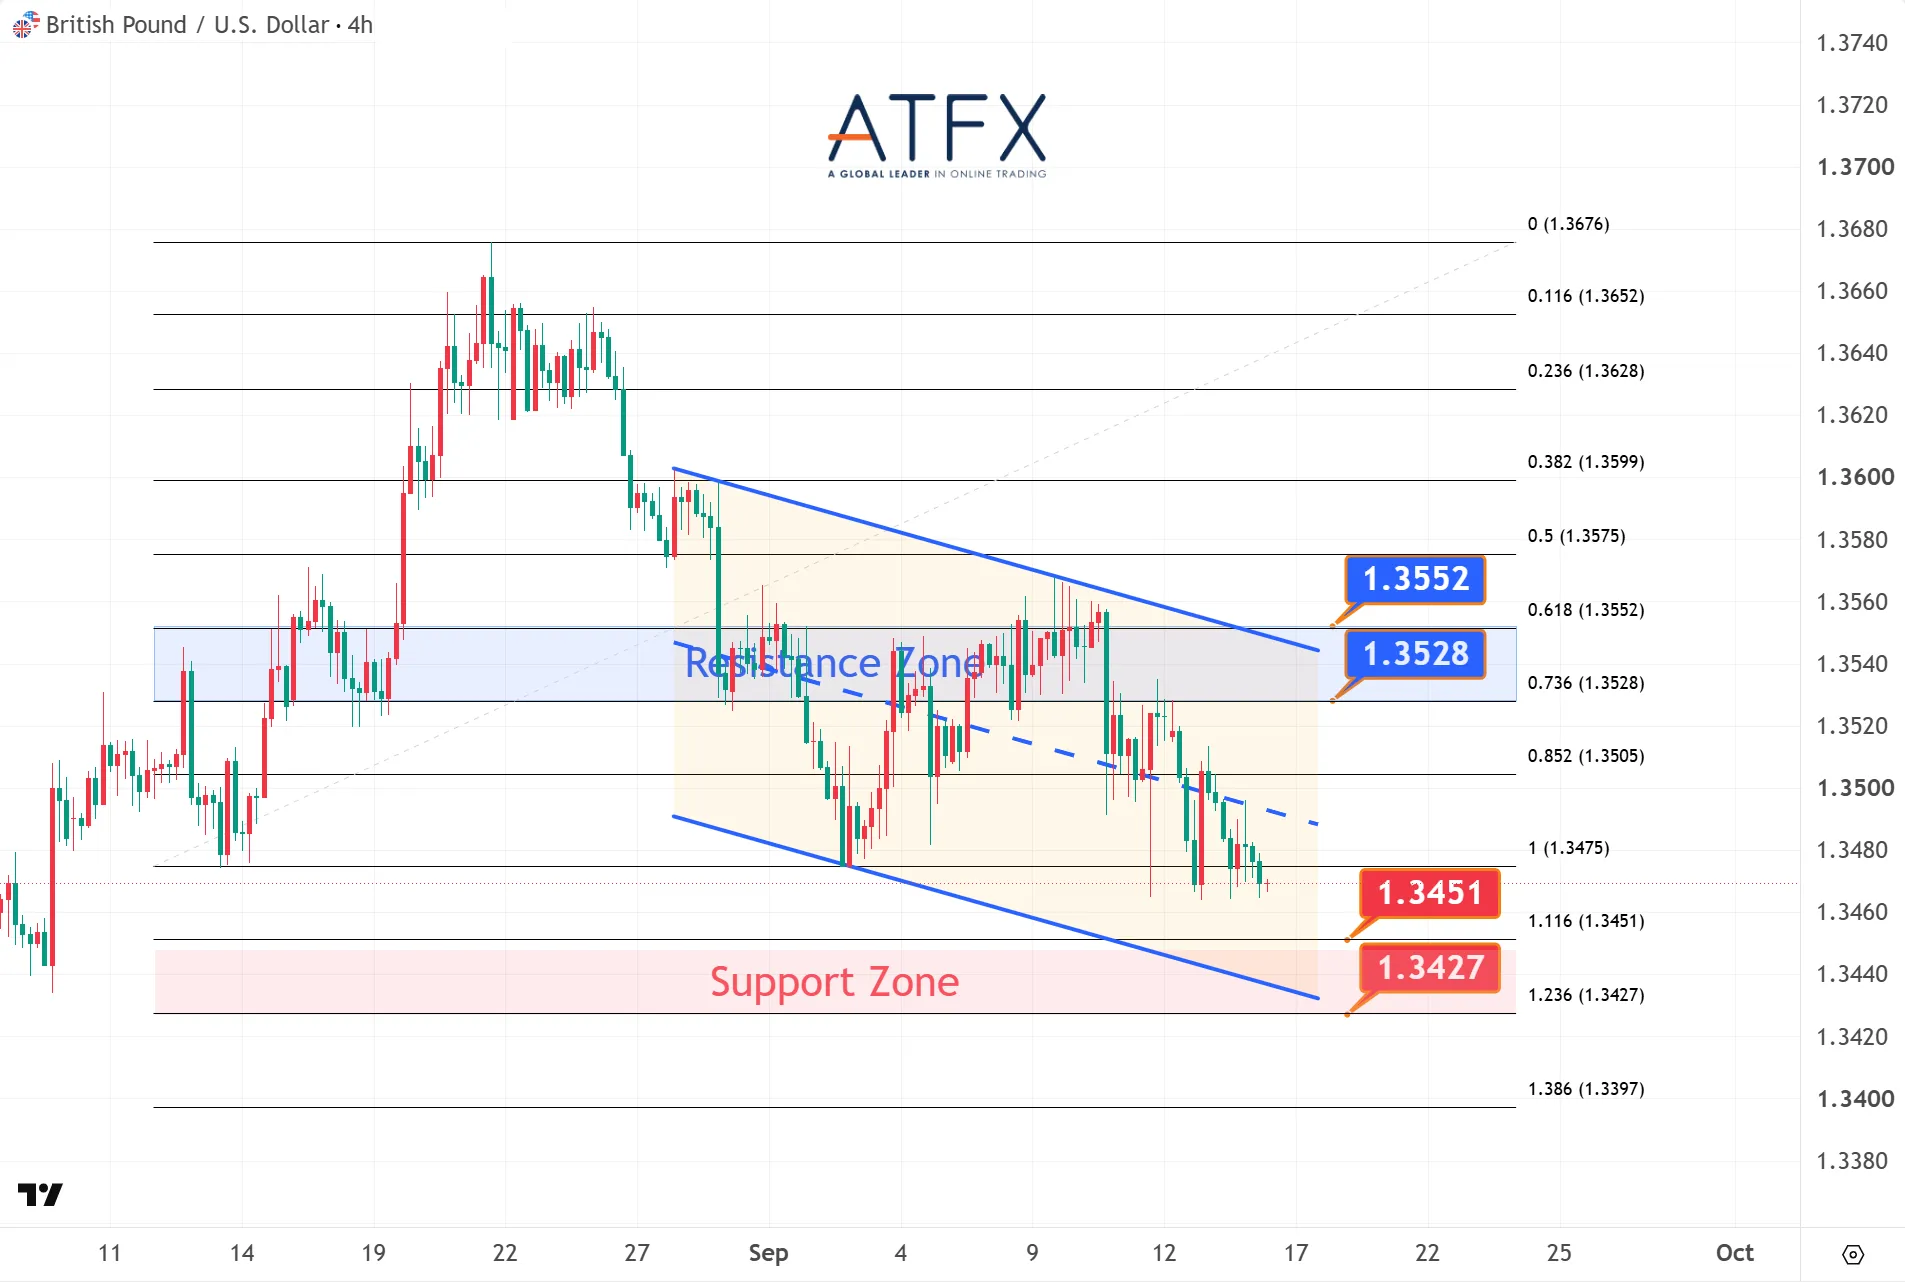
- Resistance: 1.3528 / 1.3552
- Support: 1.3451 / 1.3427
Sterling remained weak on expectations of tighter U.S. monetary policy and anticipation of forthcoming UK inflation data ahead of the Bank of England’s policy decision.
Analyst View: A break below current levels could expose support at 1.3451 and 1.3427. Conversely, a dovish interpretation of the Fed decision may allow the pair to recover above 1.3500.
Bias: Wait-and-see
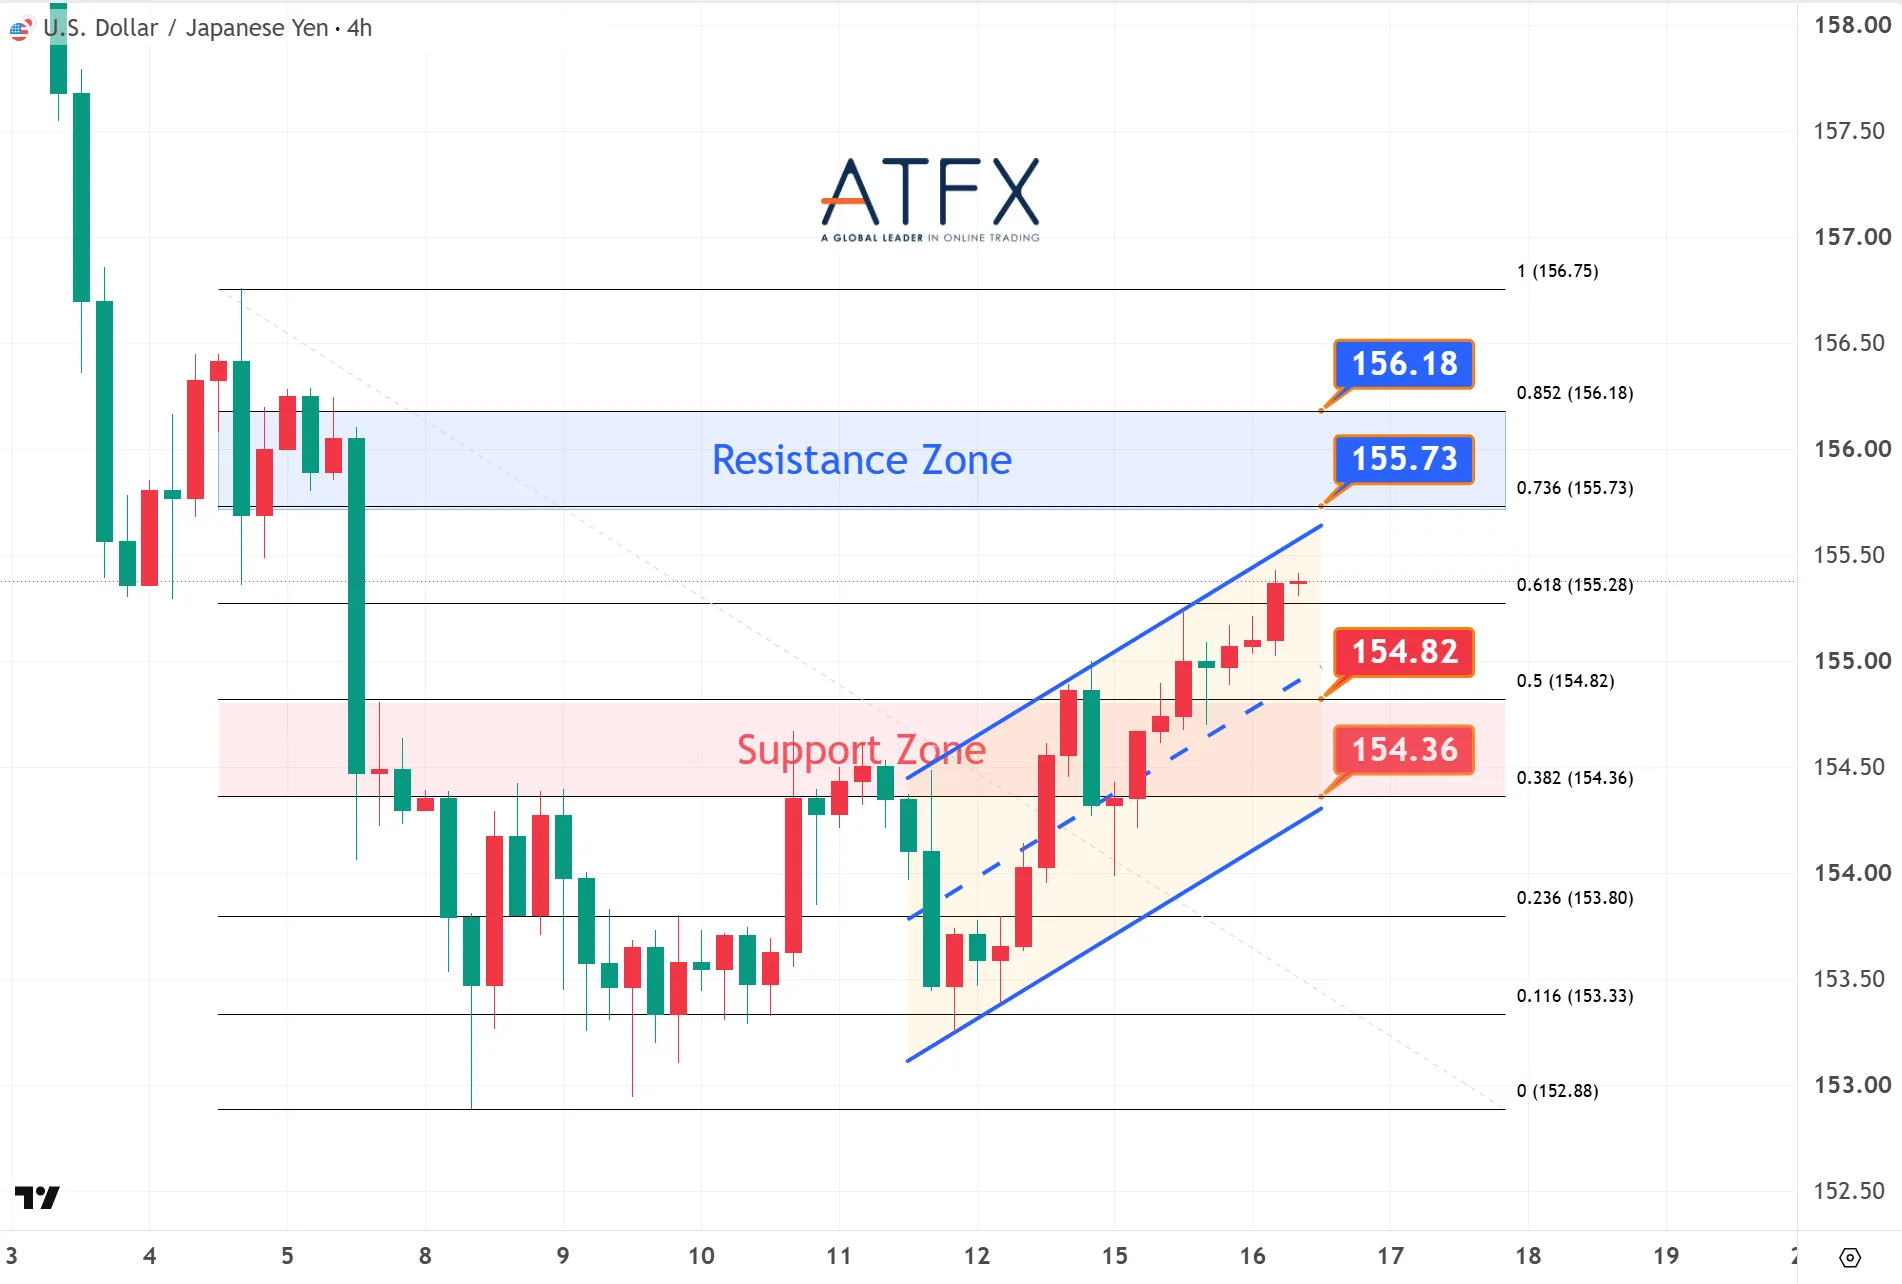
- Resistance: 155.73 / 156.18
- Support: 154.82 / 154.36
Market participants expected a Fed hike of over 90% tonight; USD/JPY rebounded from 154 to 155 as investors awaited the Fed decision ahead of the Bank of Japan meeting later.
Analyst View: The pair has regained traction above its 10-day moving average. Sustained momentum could support a test of 156.00, provided the Fed maintains a hiking-path outlook for the dollar.
Bias: Moderately bullish
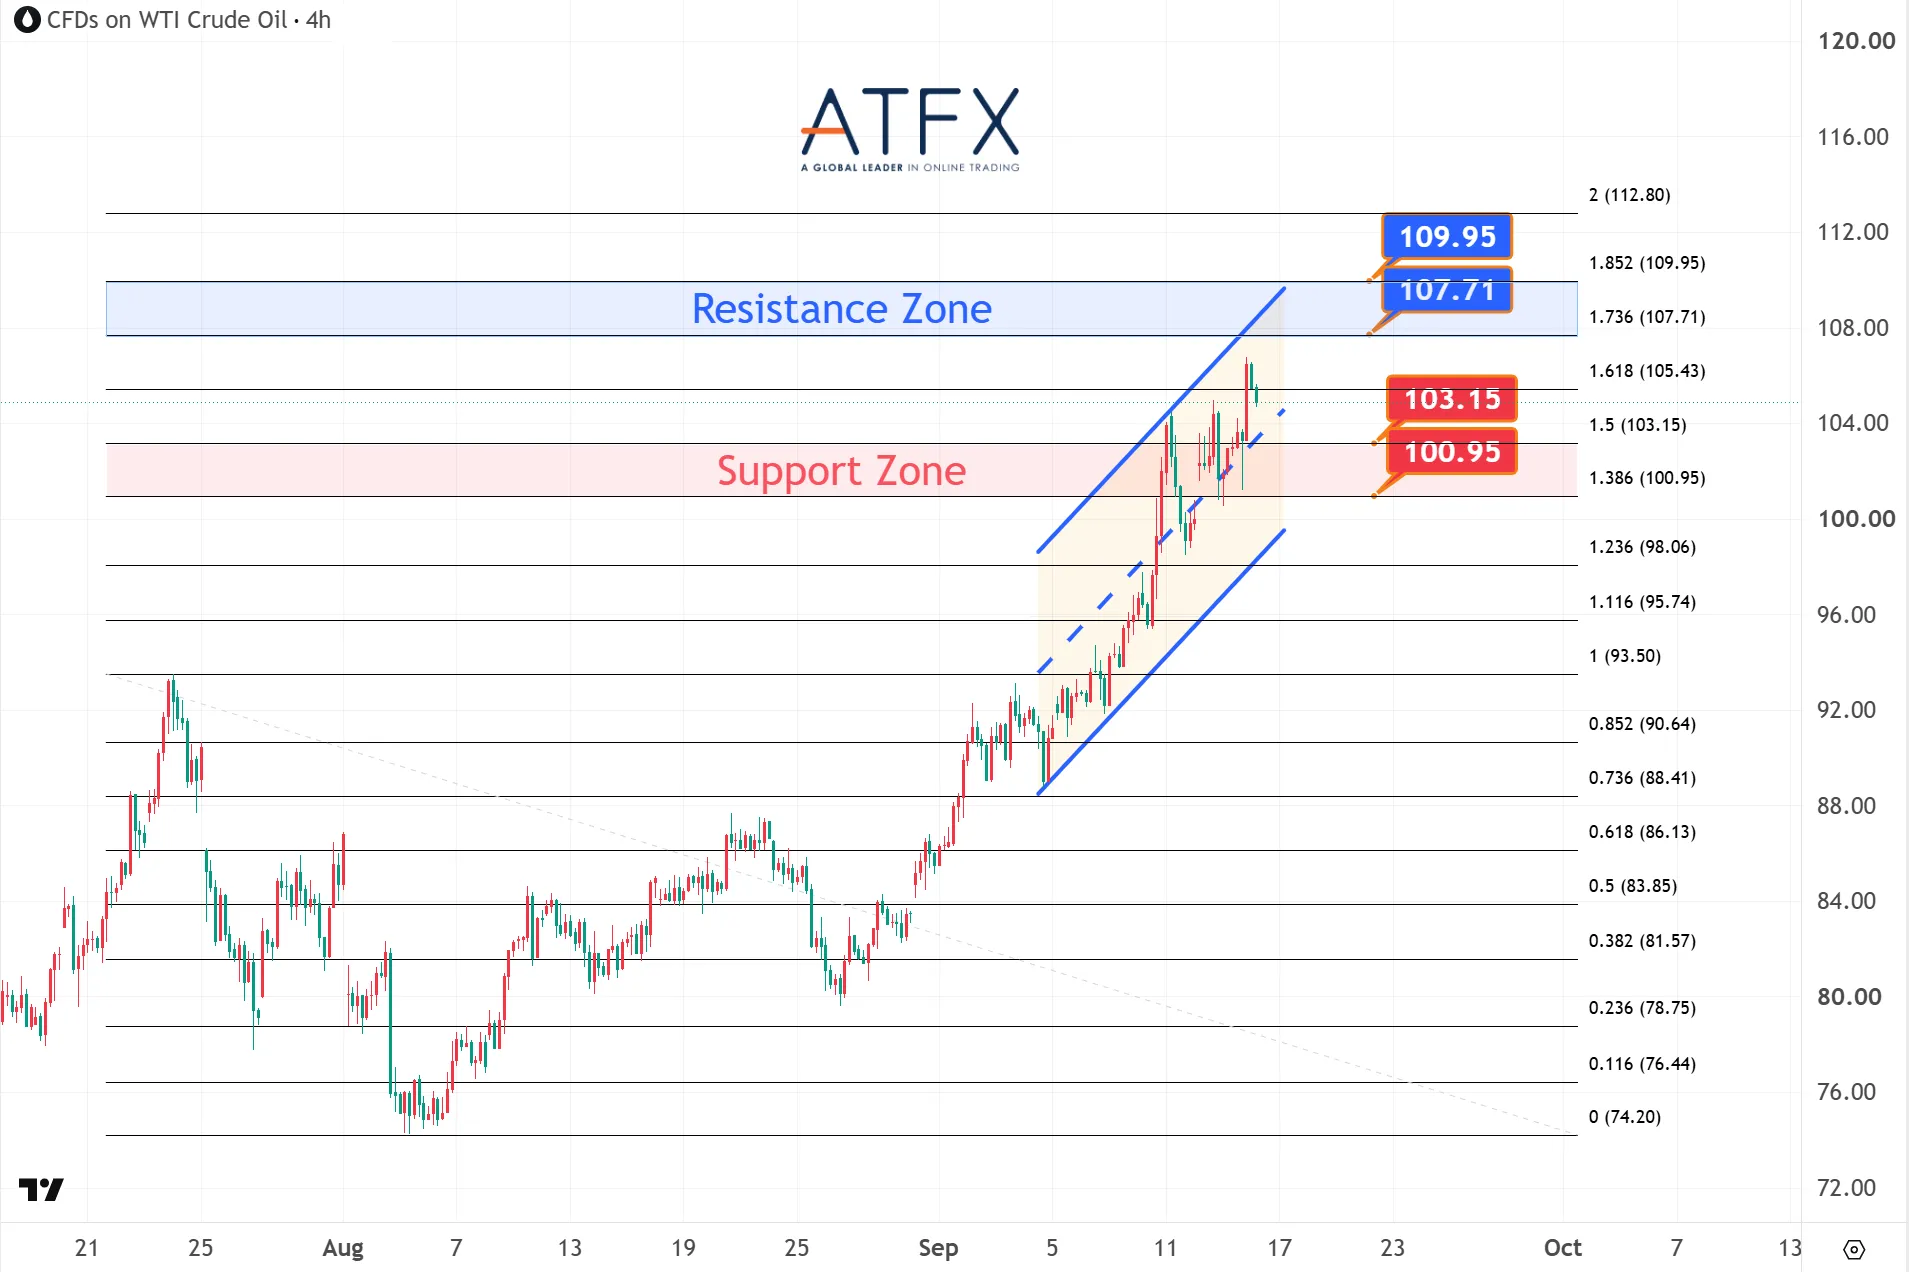
- Resistance: 107.71 / 109.95
- Support: 103.15 / 100.95
Oil prices advanced further as concerns over supply disruptions persisted due to operational interruptions in Saudi Arabia and Libya.
Analyst View: Fundamental support remains strong. Attention is on whether prices can hold above $105 ahead of the Fed meeting. If the Fed hikes rates and delivers a hike path, it would put pressure on prices.
Bias: Bullish
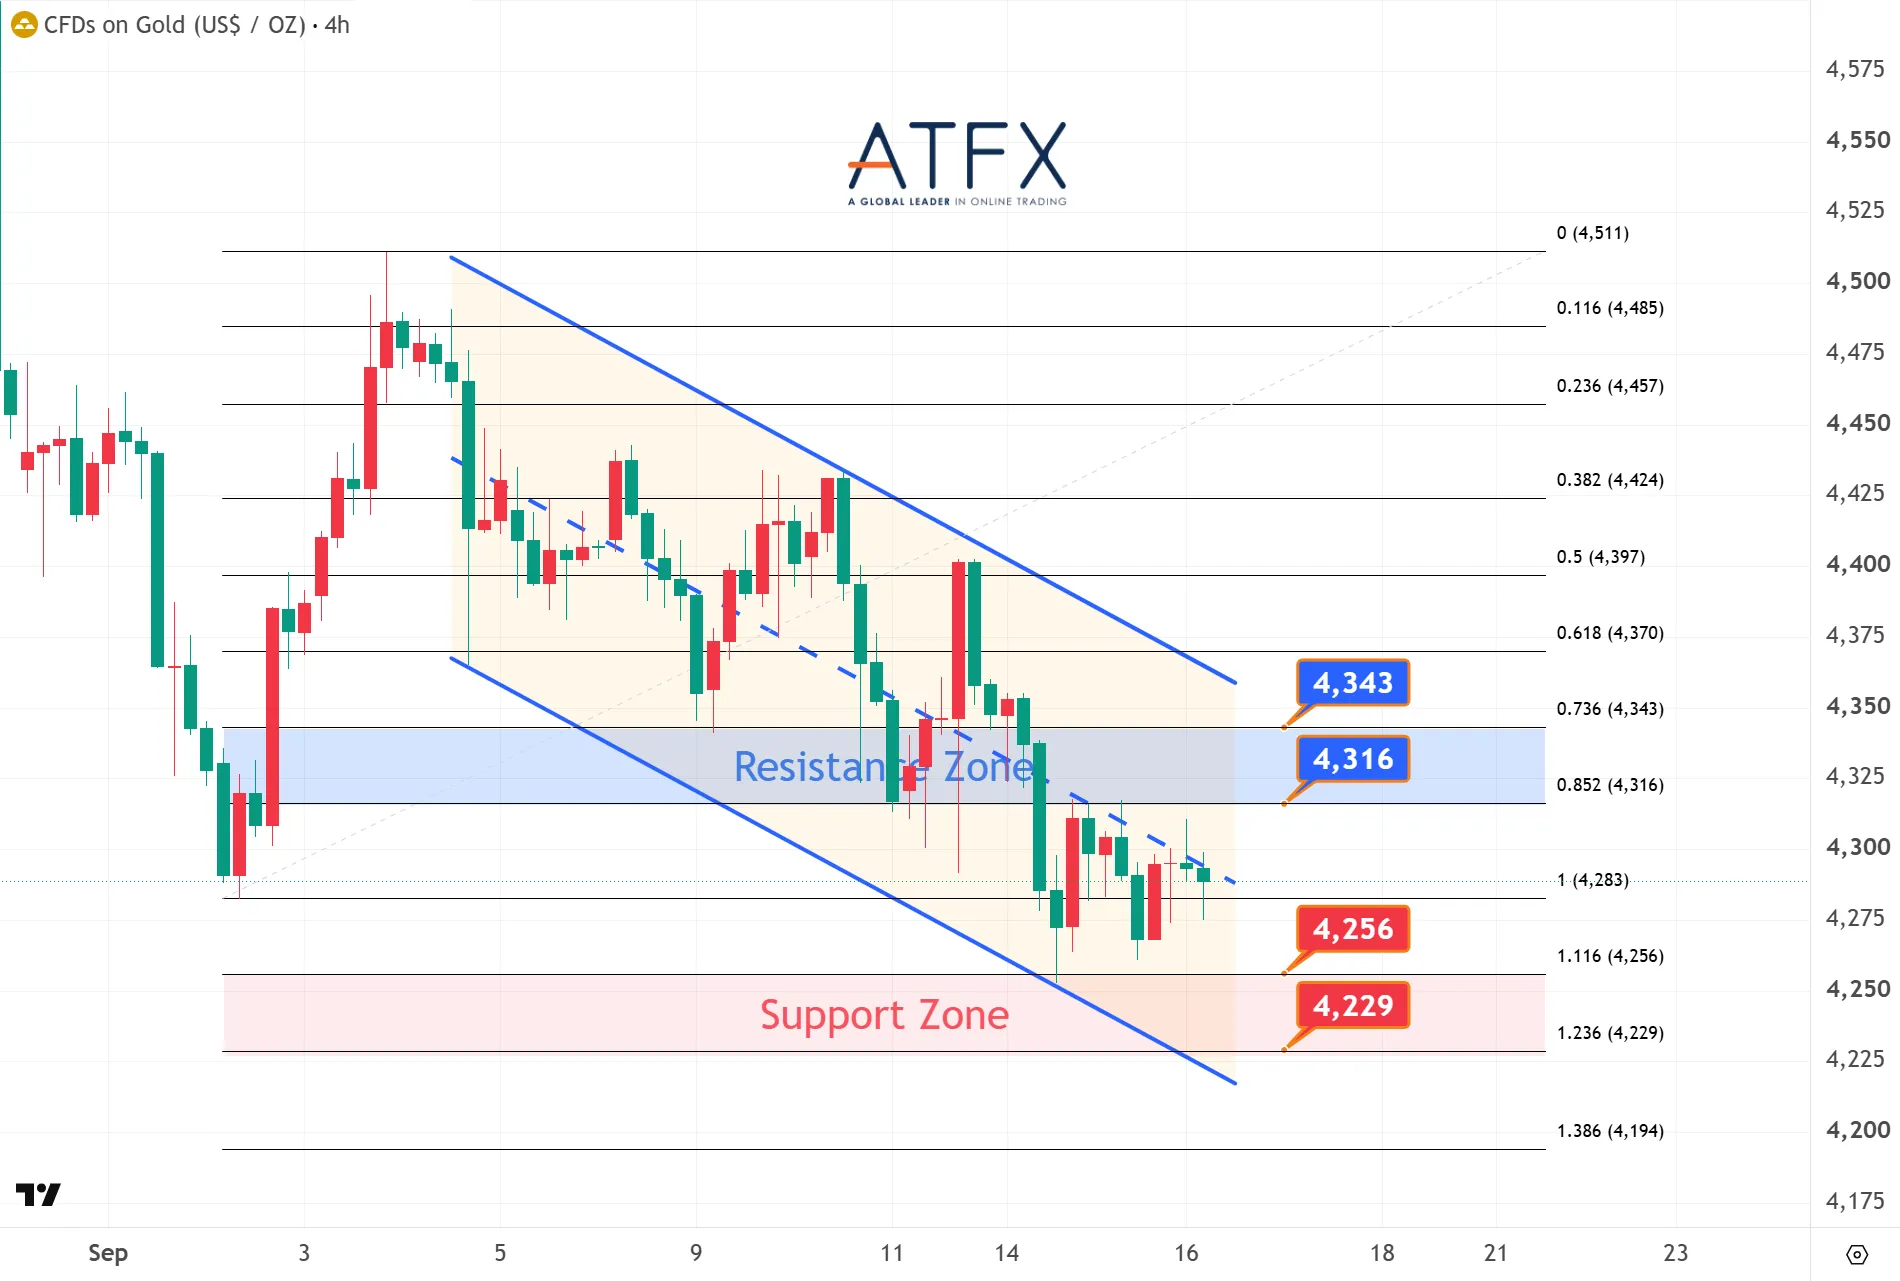
- Resistance: 4316 / 4343
- Support: 4256 / 4229
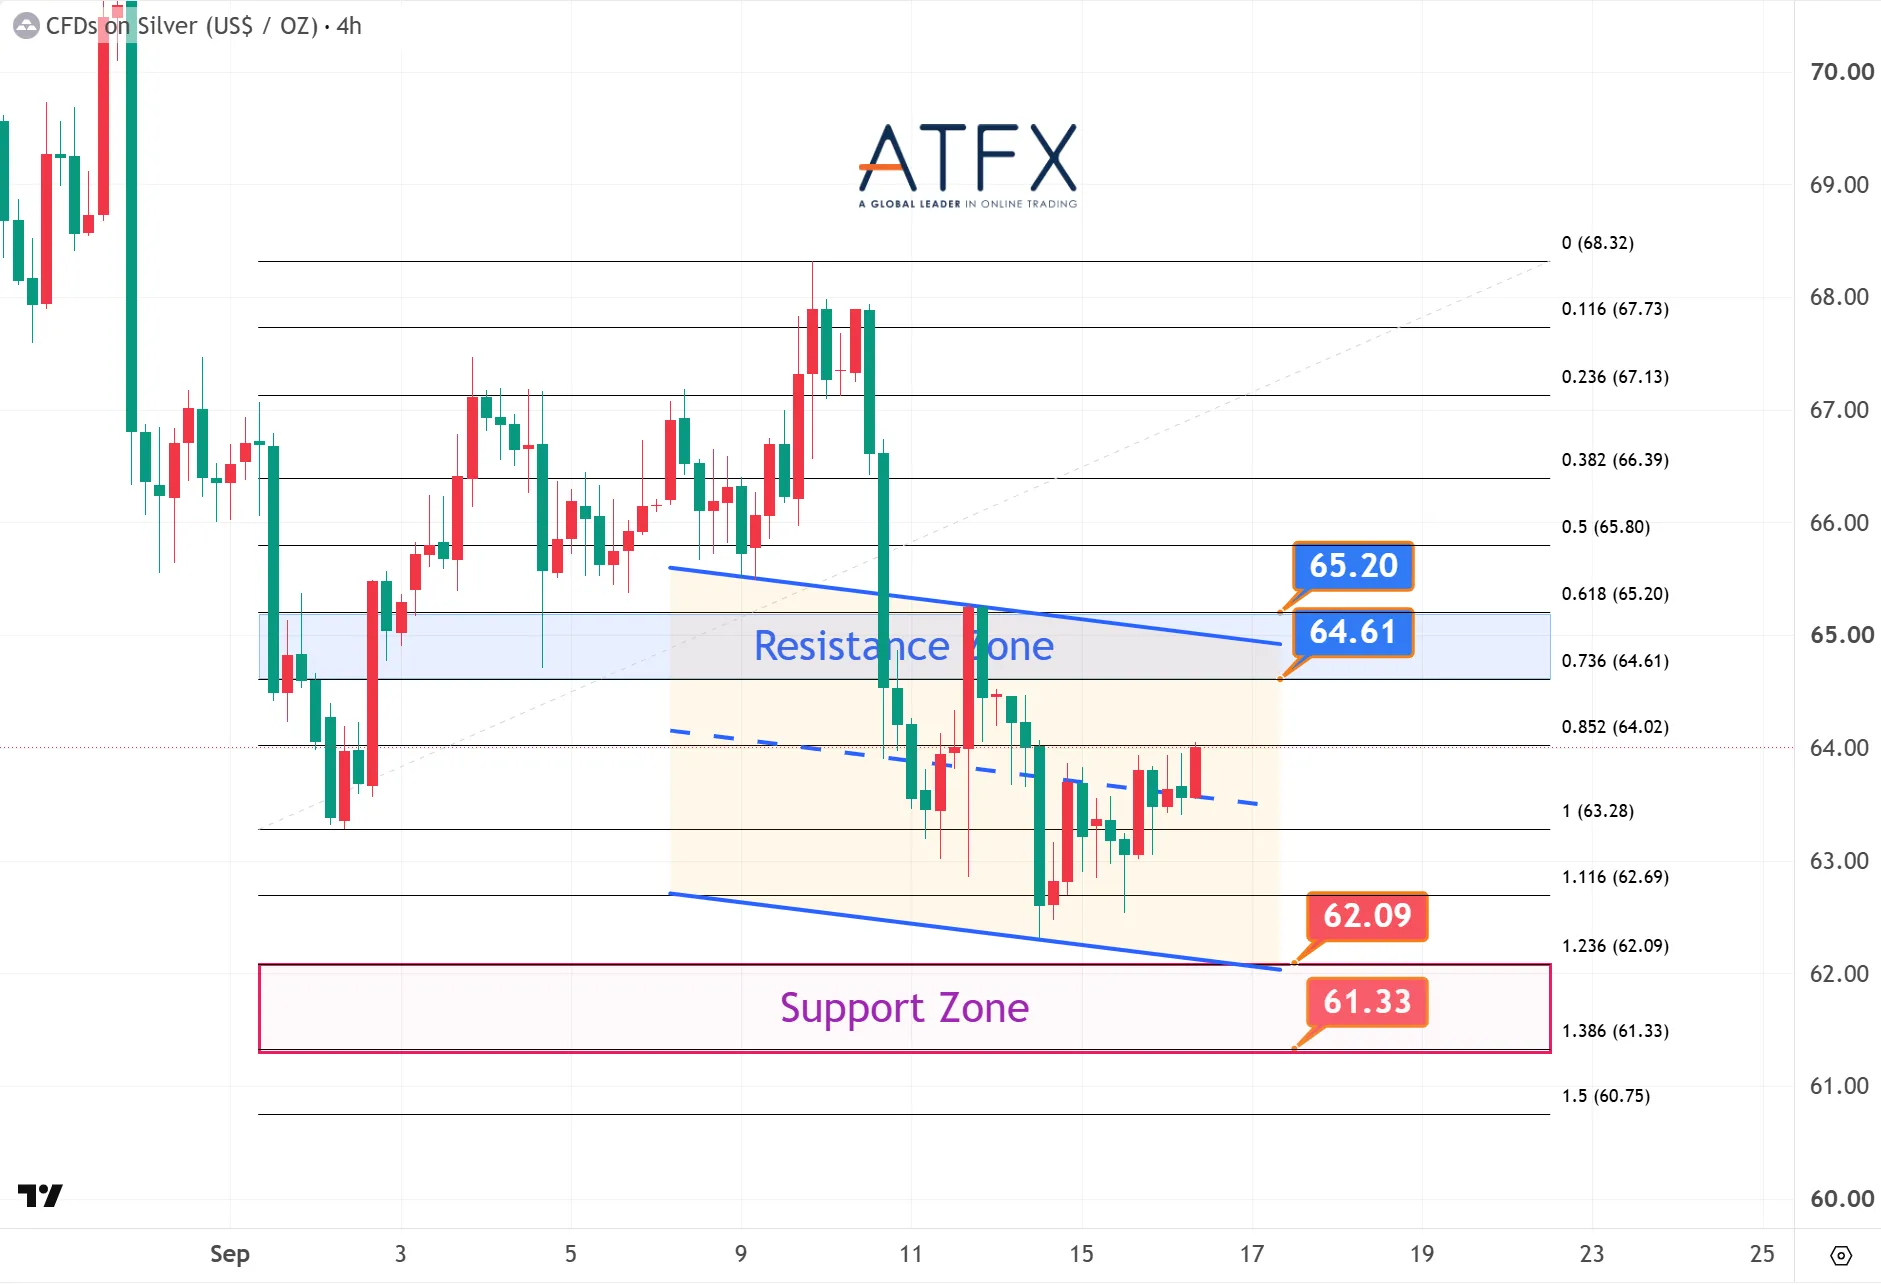
- Resistance: 64.61 / 65.20
- Support: 62.09 / 61.33
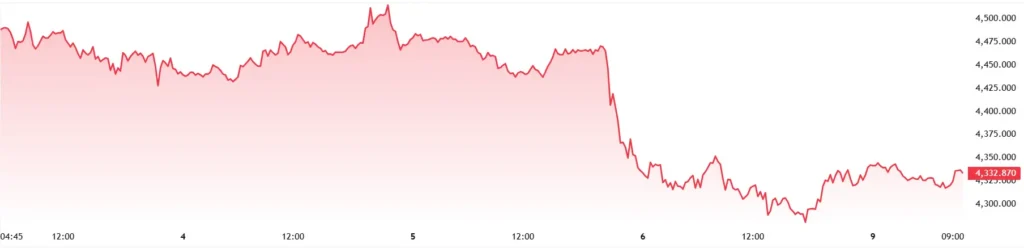
Gold consolidated, losing $4,300 as investors awaited the Federal Reserve’s policy announcement. Elevated Treasury yields and rising oil prices continued to weigh on sentiment for precious metals.
Analyst View: A hawkish rate hike could push gold prices lower towards the $4,200 region. However, if the Fed signals a more cautious, data-dependent approach, gold may regain upside momentum.
Bias: Wait-and-see
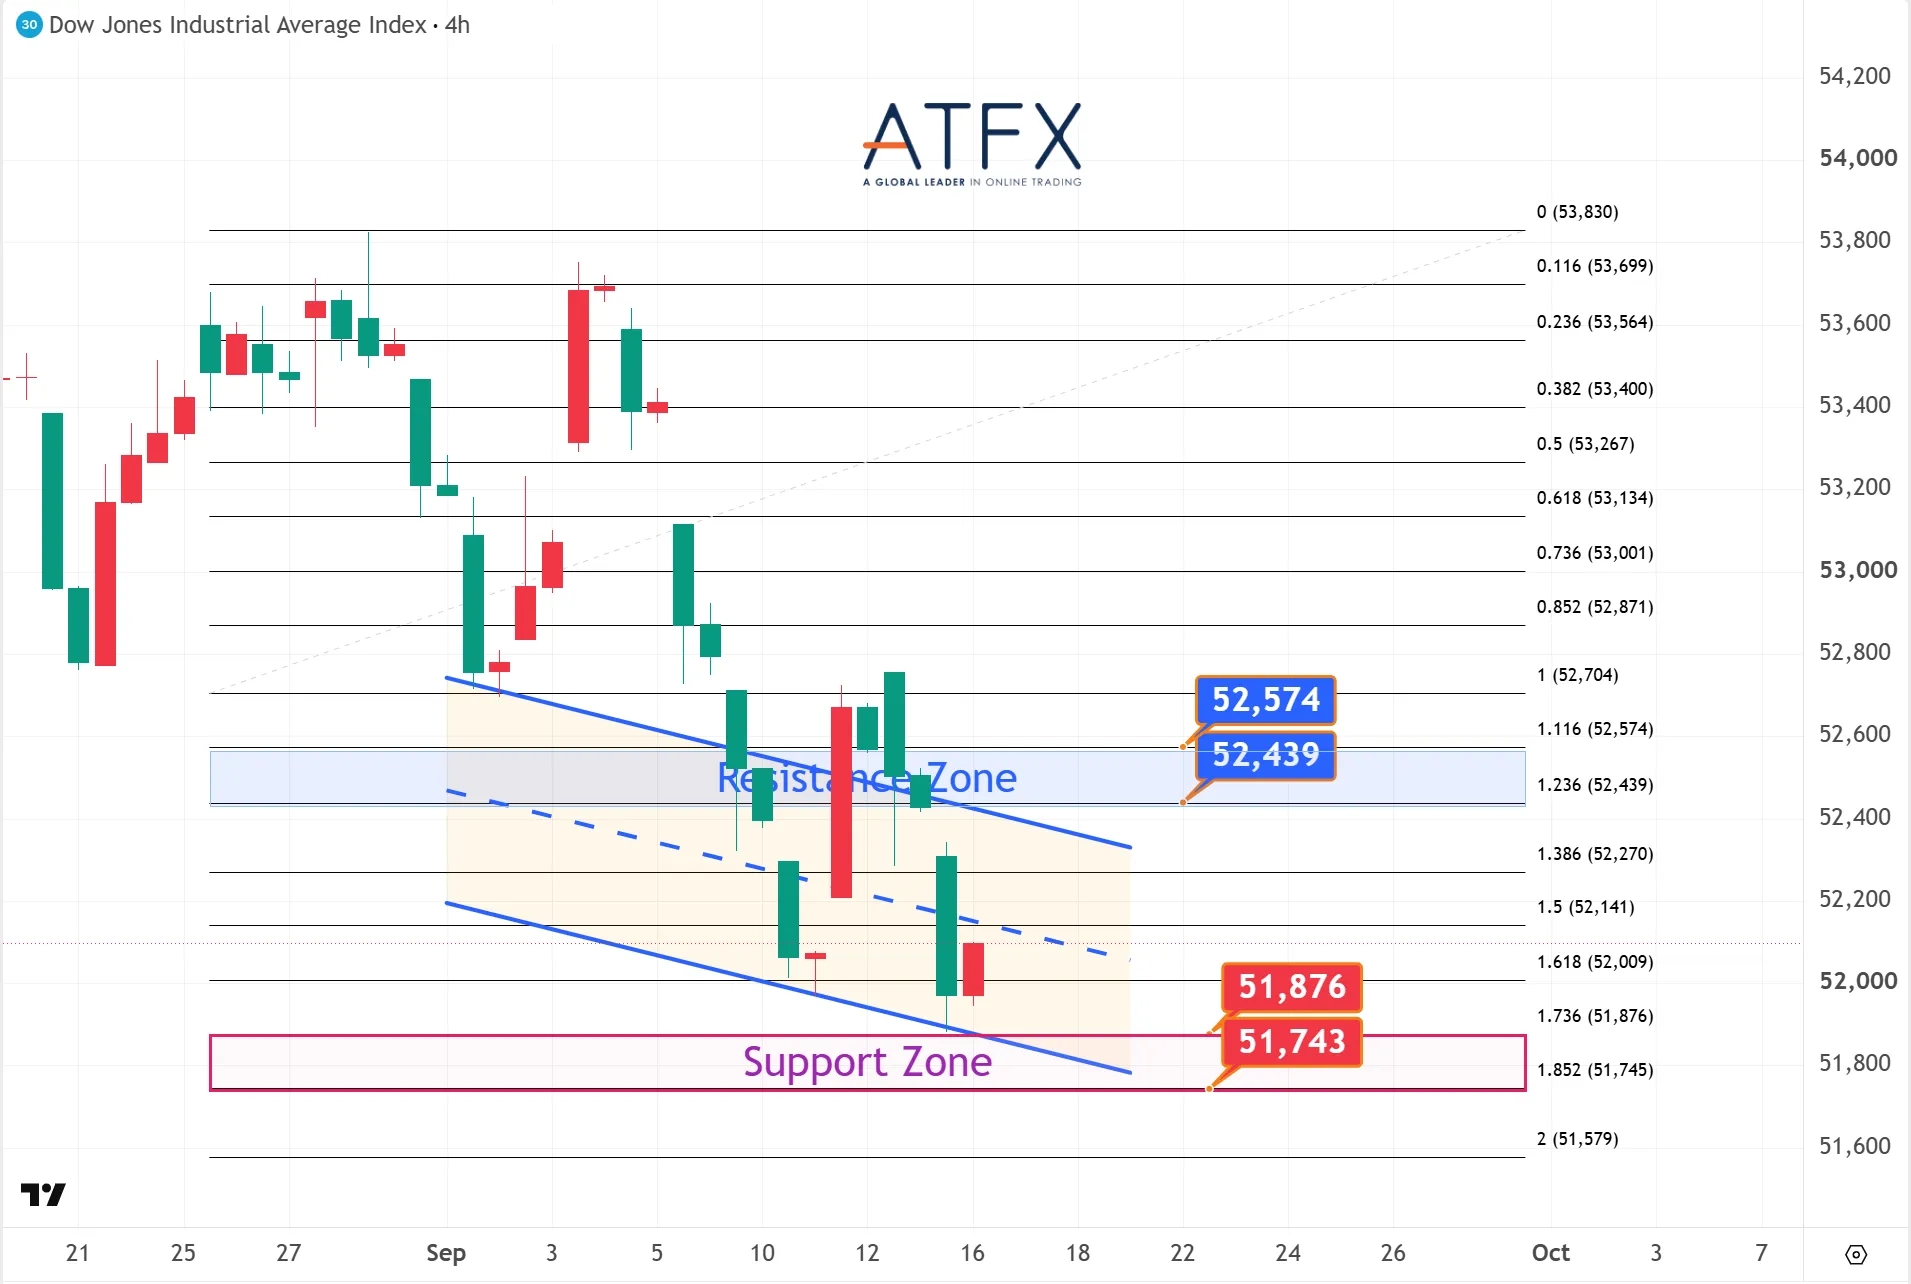
- Resistance: 52,439 / 52,574
- Support: 51,876 / 51,743
Treasury yields continue to surge, and policy uncertainty continues to weigh on equity sentiment, with the Dow briefly reaching its lowest level since late July.
Analyst View: The Fed’s guidance will be pivotal. Holding above 52,000 may support a rebound towards 52,400, while a break lower could expose the late-July lows.
Bias: Under pressure
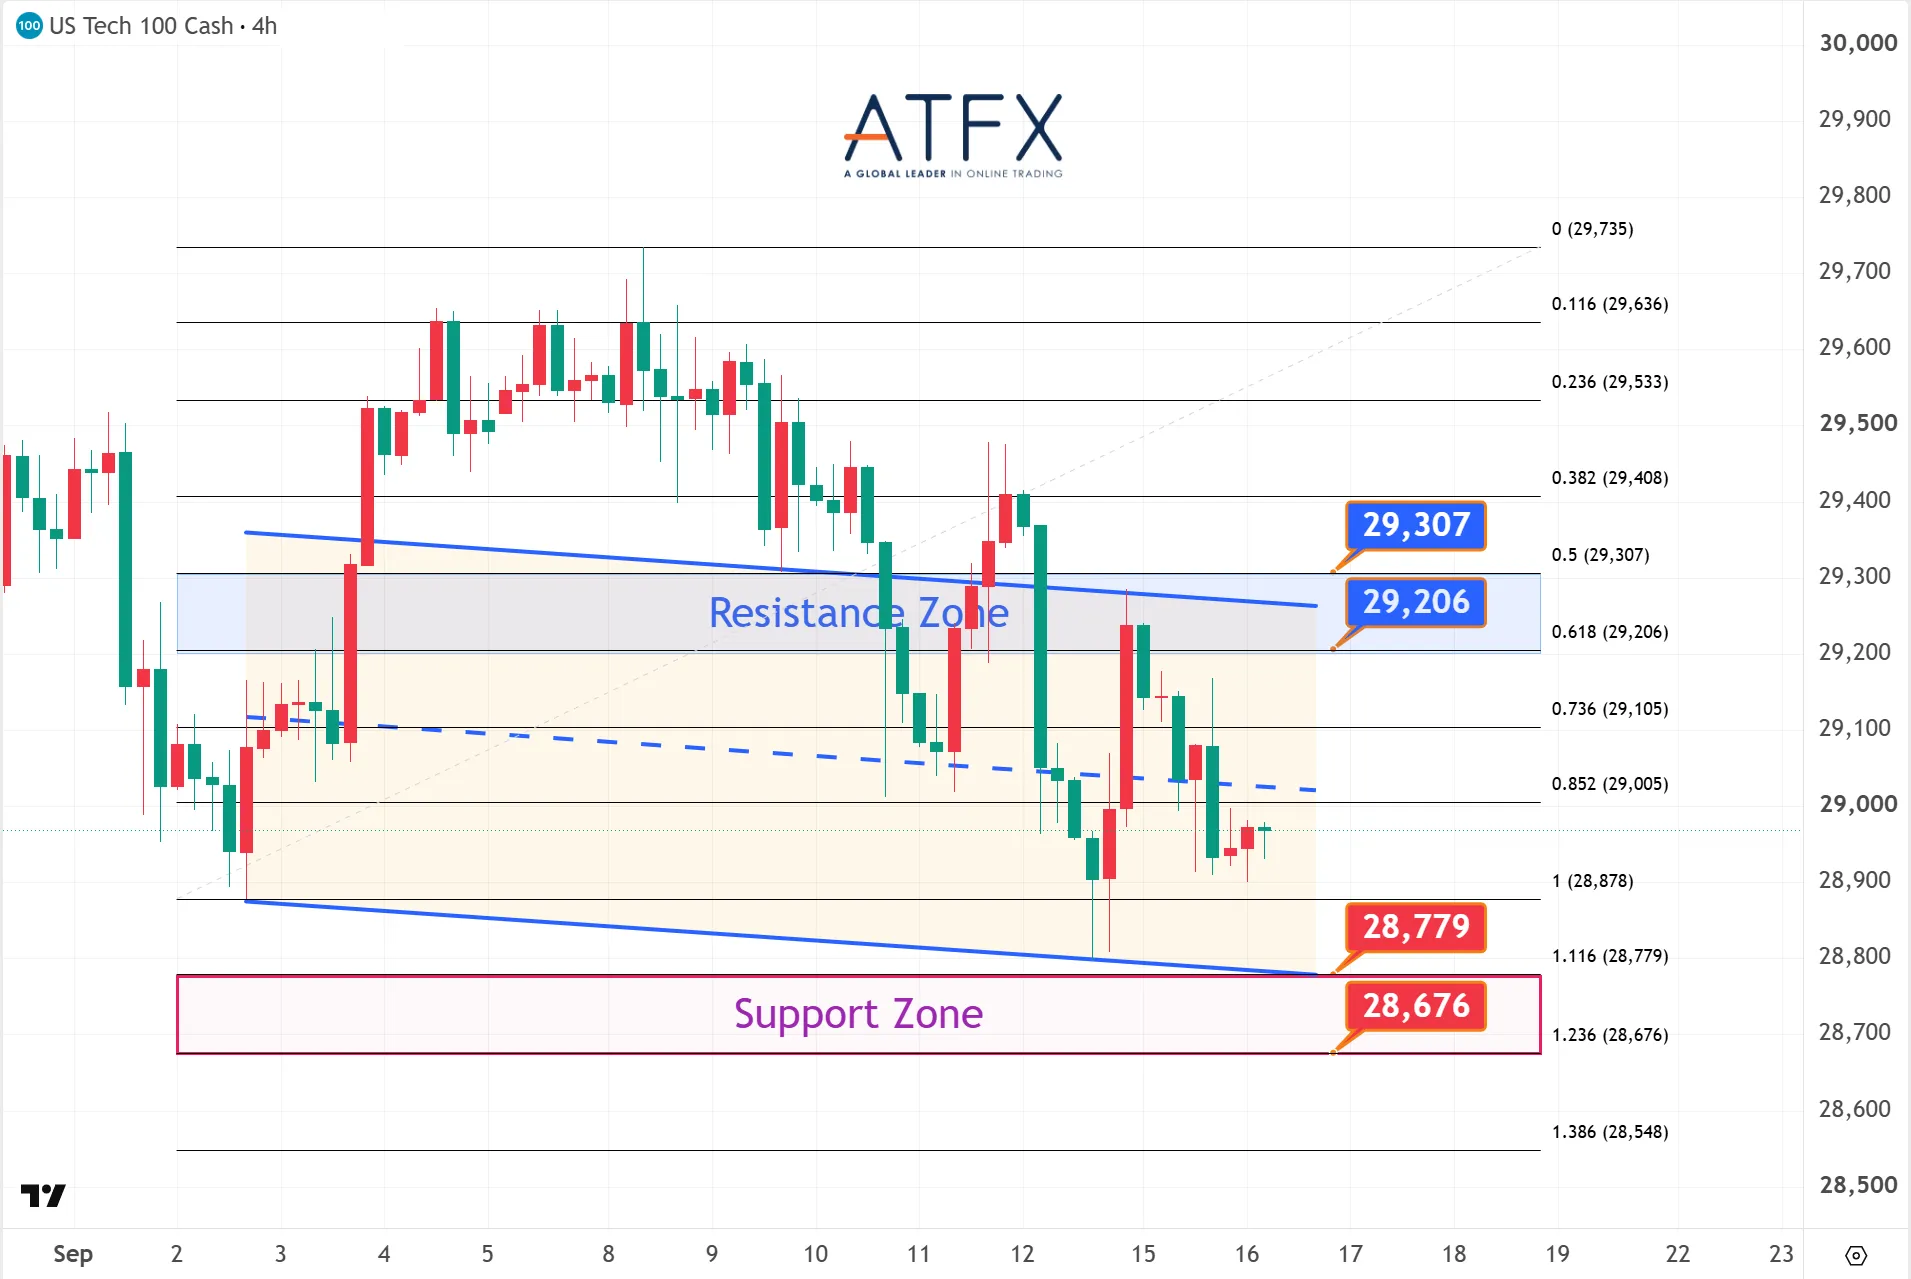
- Resistance: 29,206 / 29,307
- Support: 28,779 / 28,676
Technology and growth stocks remained under pressure as rising yields and energy prices dampened appetite for higher-valuation sectors.
Analyst View: The Fed’s forward guidance will be critical. A hawkish stance may prolong weakness in technology shares, whereas a less aggressive tone could offer relief.
Bias: Under pressure
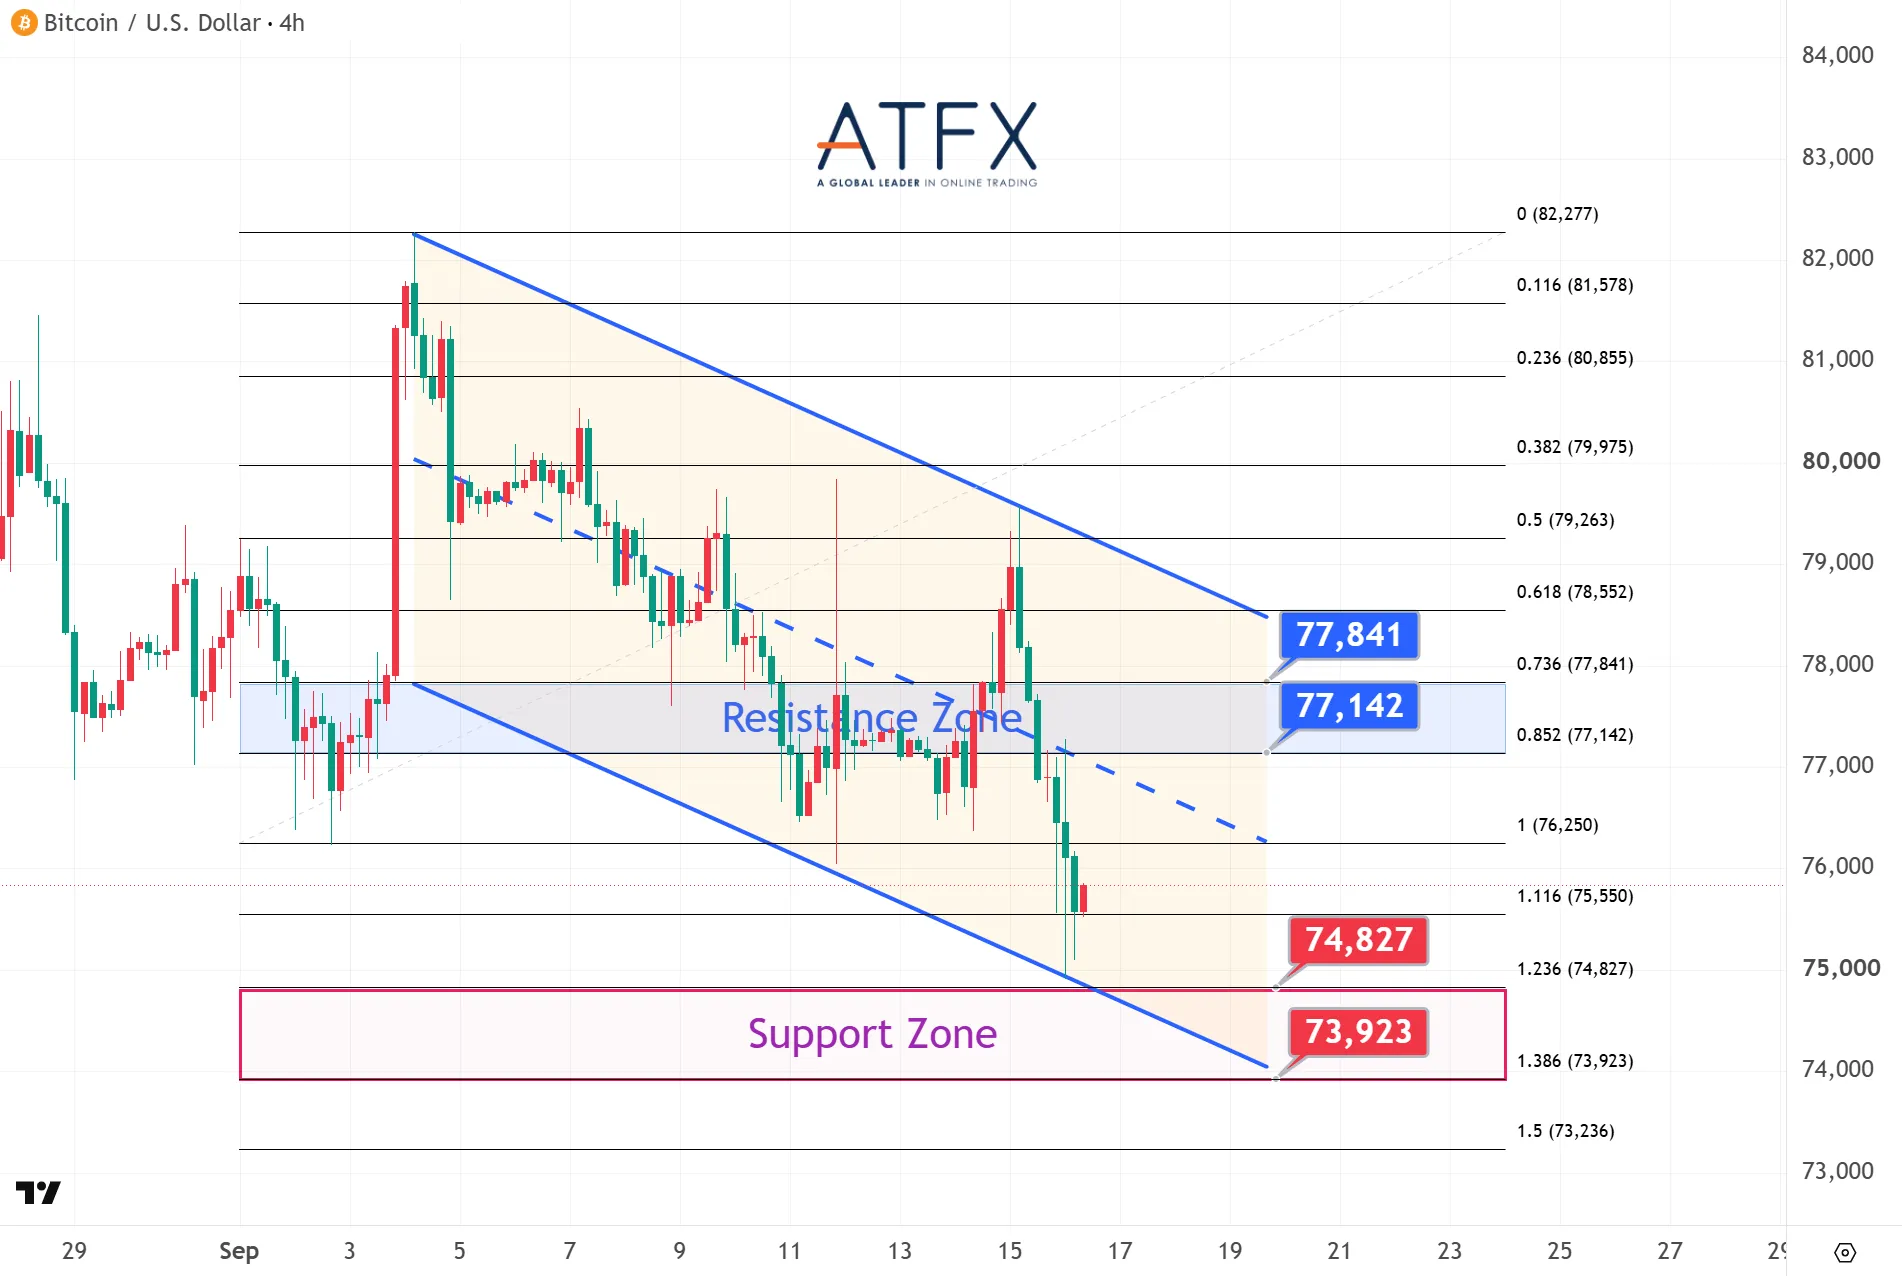
- Resistance: 77,142 / 77,841
- Support: 74,827 / 73,923
Bitcoin continued to decline ahead of the Fed decision, underpinned by subdued risk sentiment and ongoing disappointment with U.S. cryptocurrency regulatory developments.
Analyst View: Repeated rejections near the 10-day moving average indicate that near-term downside risks remain. The Fed decision will likely determine whether the correction extends towards the $74,827-73,923 support zone.
Bias: Under pressure
Enjoy trading! The content is for reference only. Please ensure that you understand the risk.