

(By ATFX Analyst Team)
Key Takeaways
Key data includes the UK’s ILO unemployment rate and Eurozone ZEW sentiment, both critical for assessing policy outlook and economic recovery. |
Global Market Review 15/09/2026
- U.S. stocks sink amid AI slowdown warnings.
- The U.S. dollar advanced alongside Treasury yields, while gold fell 1.1% to its lowest level in over a month.
- Oil prices rose after renewed attacks linked to regional tensions heightened concerns over potential disruptions to global energy supplies.
Key Events Today:
| Time (GMT+8) | Event | Importance |
|---|---|---|
| 10:00 | CN Retail Sales & Fixed Asset Investment AUG | ** |
| 14:00 | GB Unemployment Rate JUL | ** |
| 17:00 | EU ZEW Economic Sentiment Index SEP | ** |
| 20:30 | US NY Empire State Manufacturing Index SEP | ** |
Key Events on Sep 16 (GMT+8)
| Time (GMT+8) | Event | Importance |
|---|---|---|
| 04:30 | API Crude Oil Stock Change | *** |
| 14:00 | GB CPI & PPI YoY AUG | *** |
| 17:00 | EU Industrial Production JUL | ** |
| 20:30 | US Retail Sales AUG | *** |
| 22:30 | EIA Crude Oil Stocks Change | ** |
Markets Analysis 15/09/2026
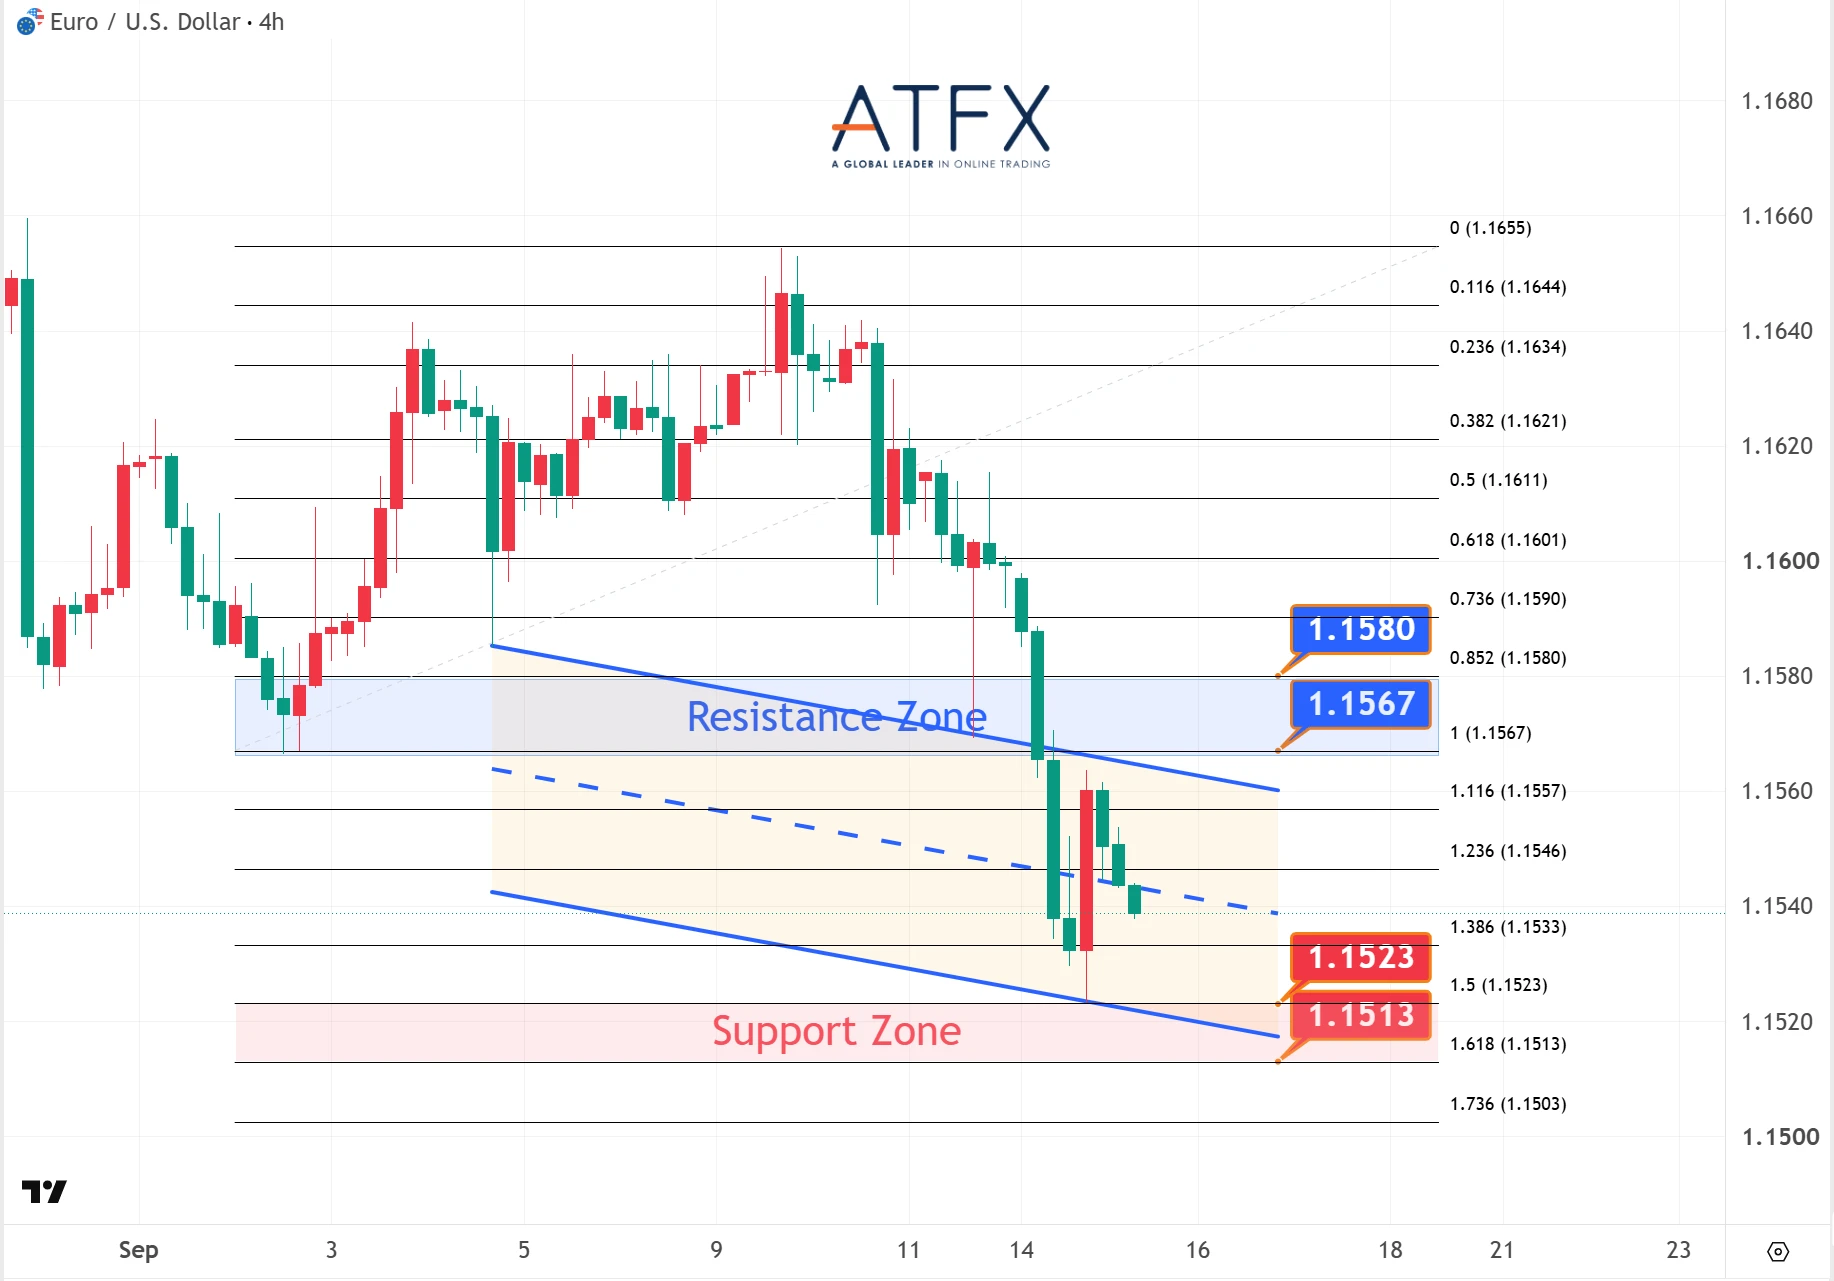
- Resistance: 1.1567 / 1.1580
- Support: 1.1523 / 1.1513
The pair fell to a one-month low as rising expectations of a hawkish Fed boosted the dollar, outweighing growing speculation about further ECB tightening.
Analyst View: EUR/USD recorded a third consecutive decline and remains under pressure below 1.1550, with risks skewed towards a test of 1.1500.
Bias: Bearish
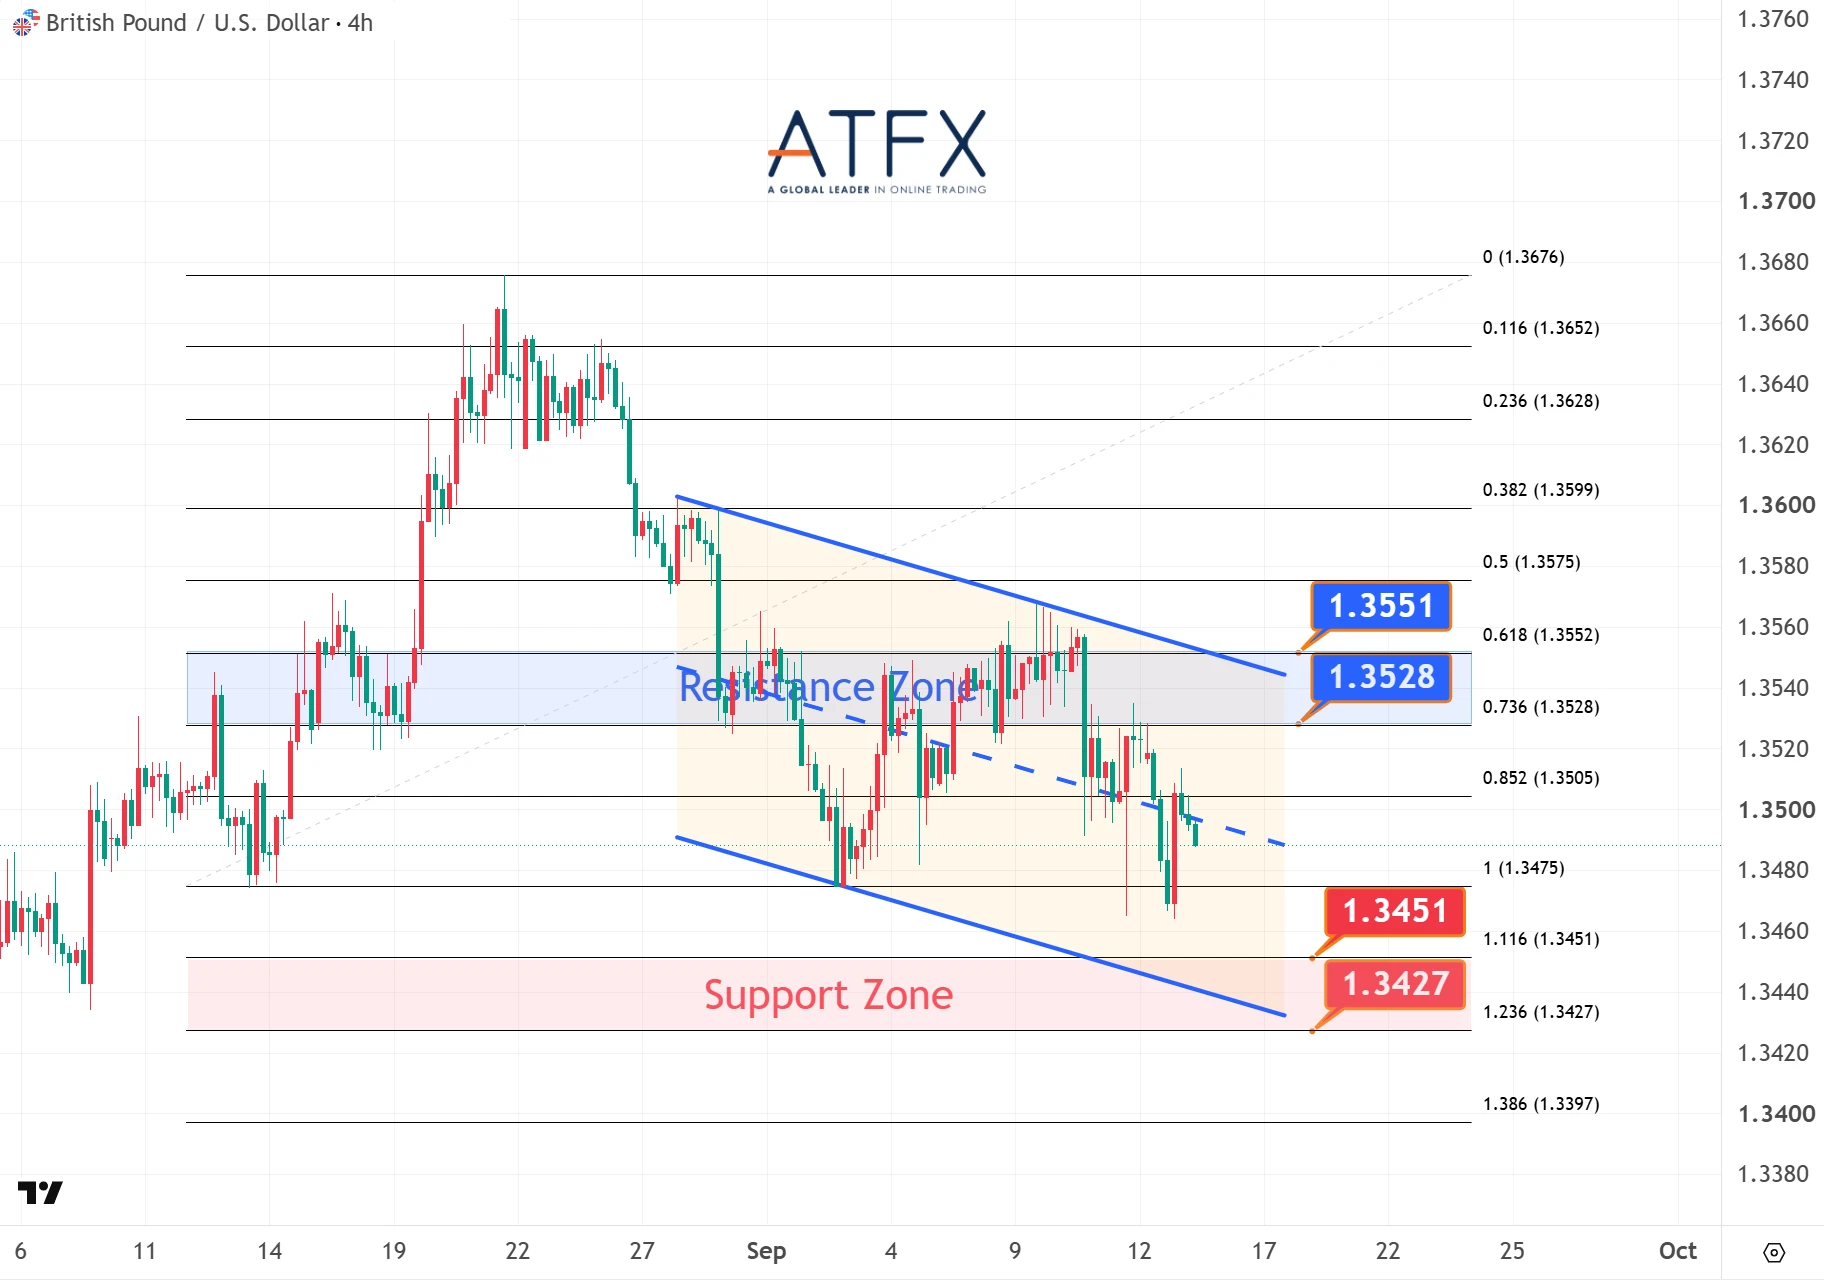
- Resistance: 1.3528 / 1.3551
- Support: 1.3451 / 1.3427
Sterling ended below 1.3500 as broad dollar strength persisted ahead of policy decisions by both the Fed and the BoE.
Analyst View: A break below the 10-day moving average has reinforced near-term downside momentum, with focus on support at 1.3451 and 1.3427.
Bias: Bearish
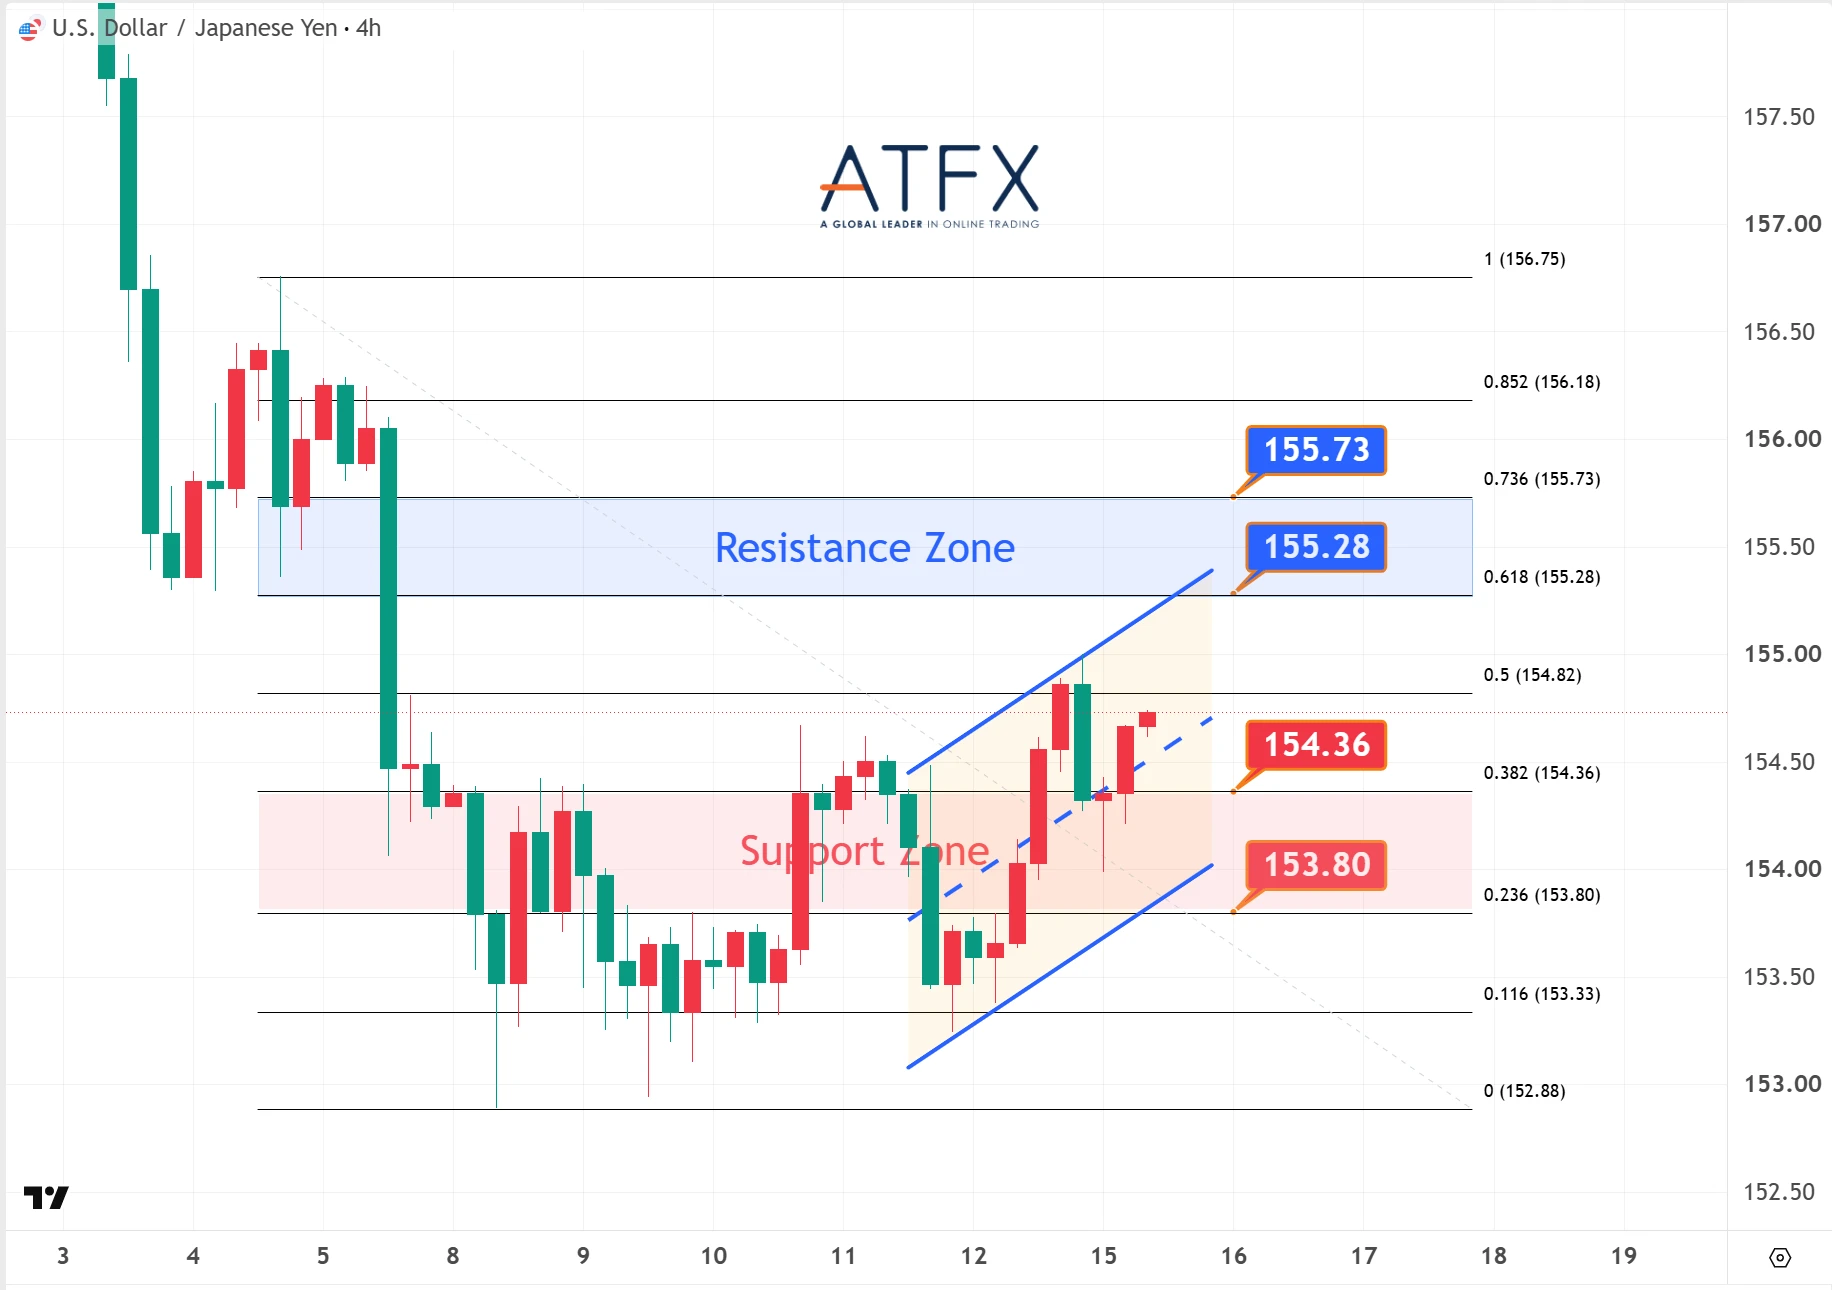
- Resistance: 155.28 / 155.73
- Support: 154.36 / 153.80
USD/JPY reached a one-week high as the dollar strengthened, with markets awaiting policy decisions from the Fed and the BoJ.
Analyst View: The 155.00 level remains key resistance. Failure to break higher may keep the pair consolidating within its recent range.
Bias: Range-Bound
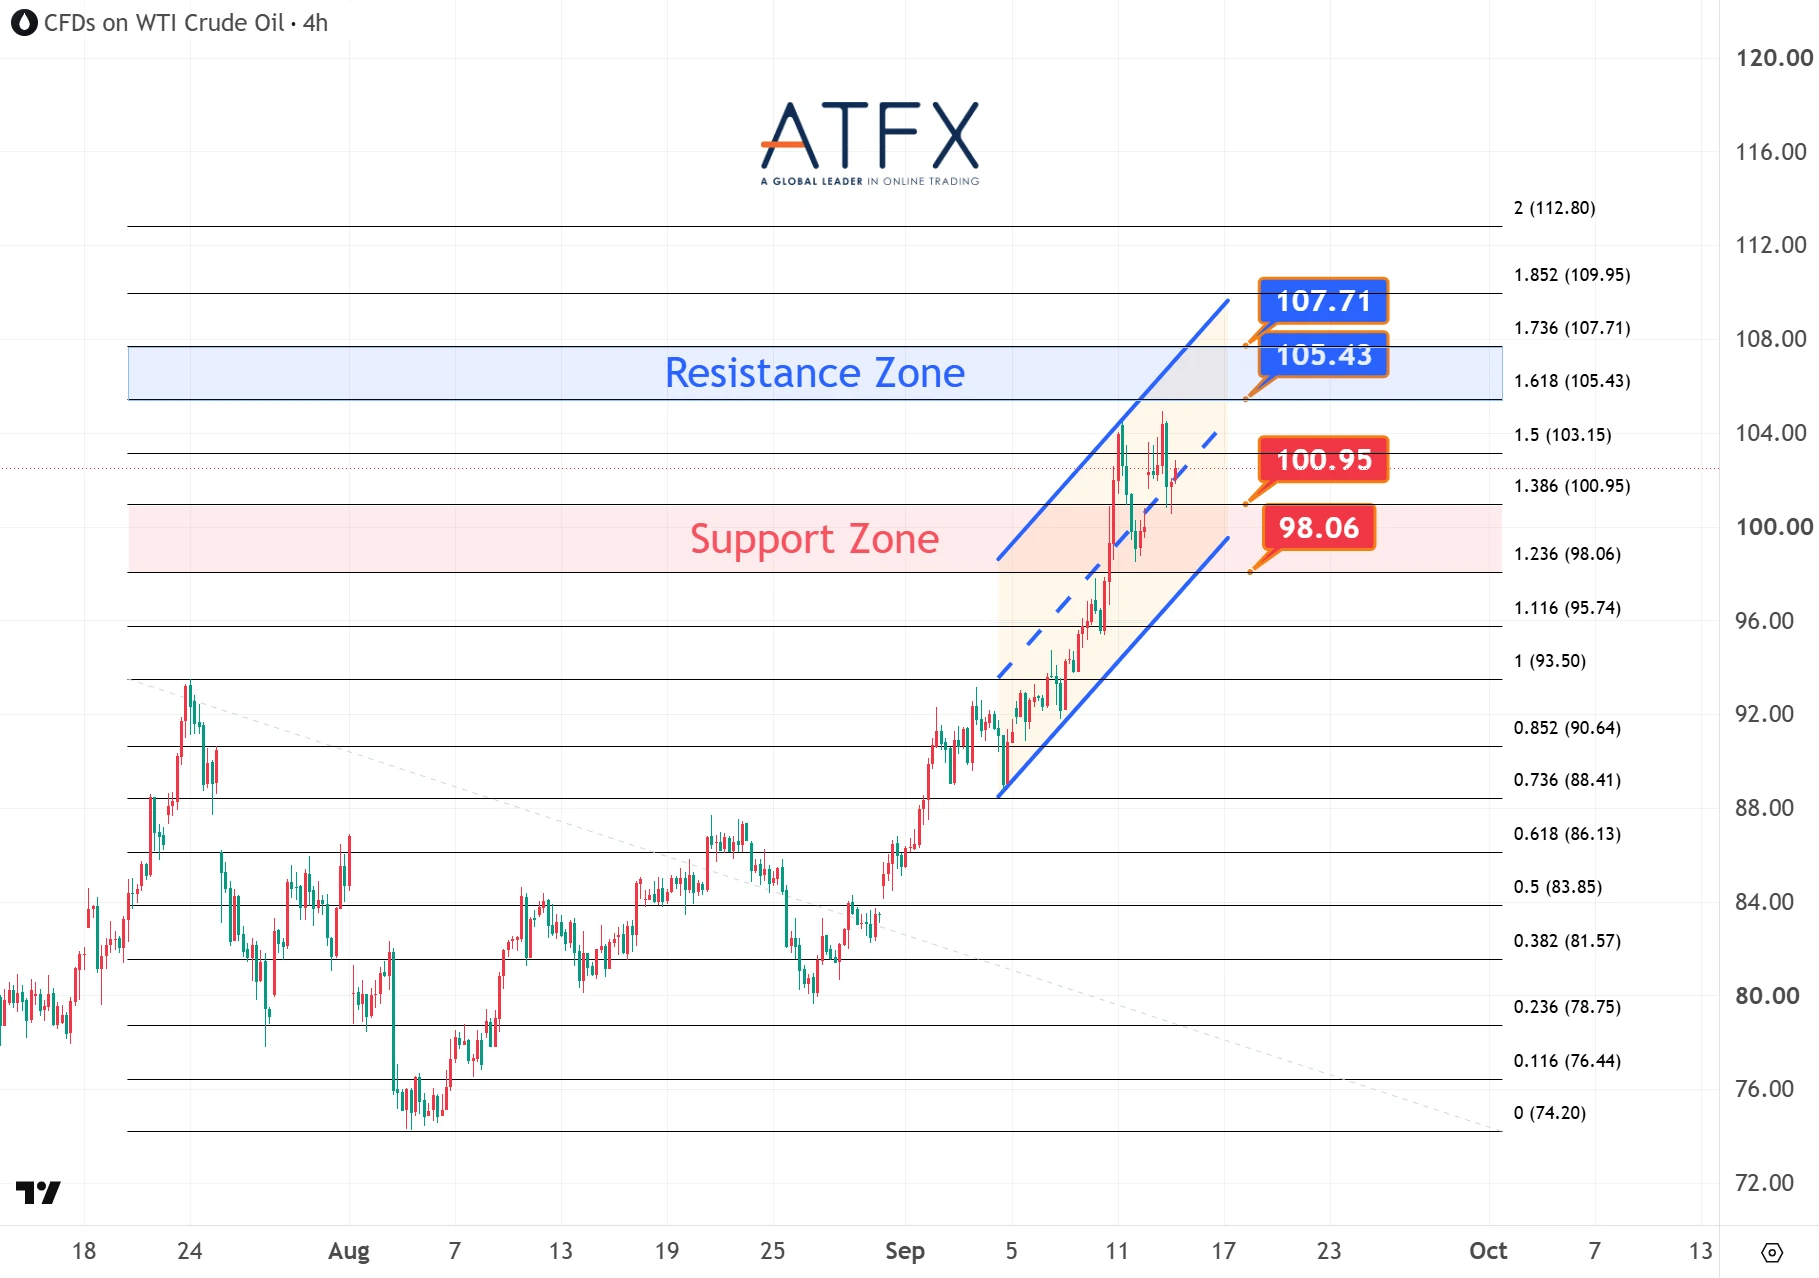
- Resistance: 105.43 / 107.71
- Support: 100.95 / 98.06
Oil prices climbed above $100 per barrel amid renewed supply concerns.
Analyst View: Although gains moderated towards the close, prices remain supported and are likely to remain elevated in the near term.
Bias: Trading near the highs

- Resistance: 4316 / 4343
- Support: 4256 / 4229
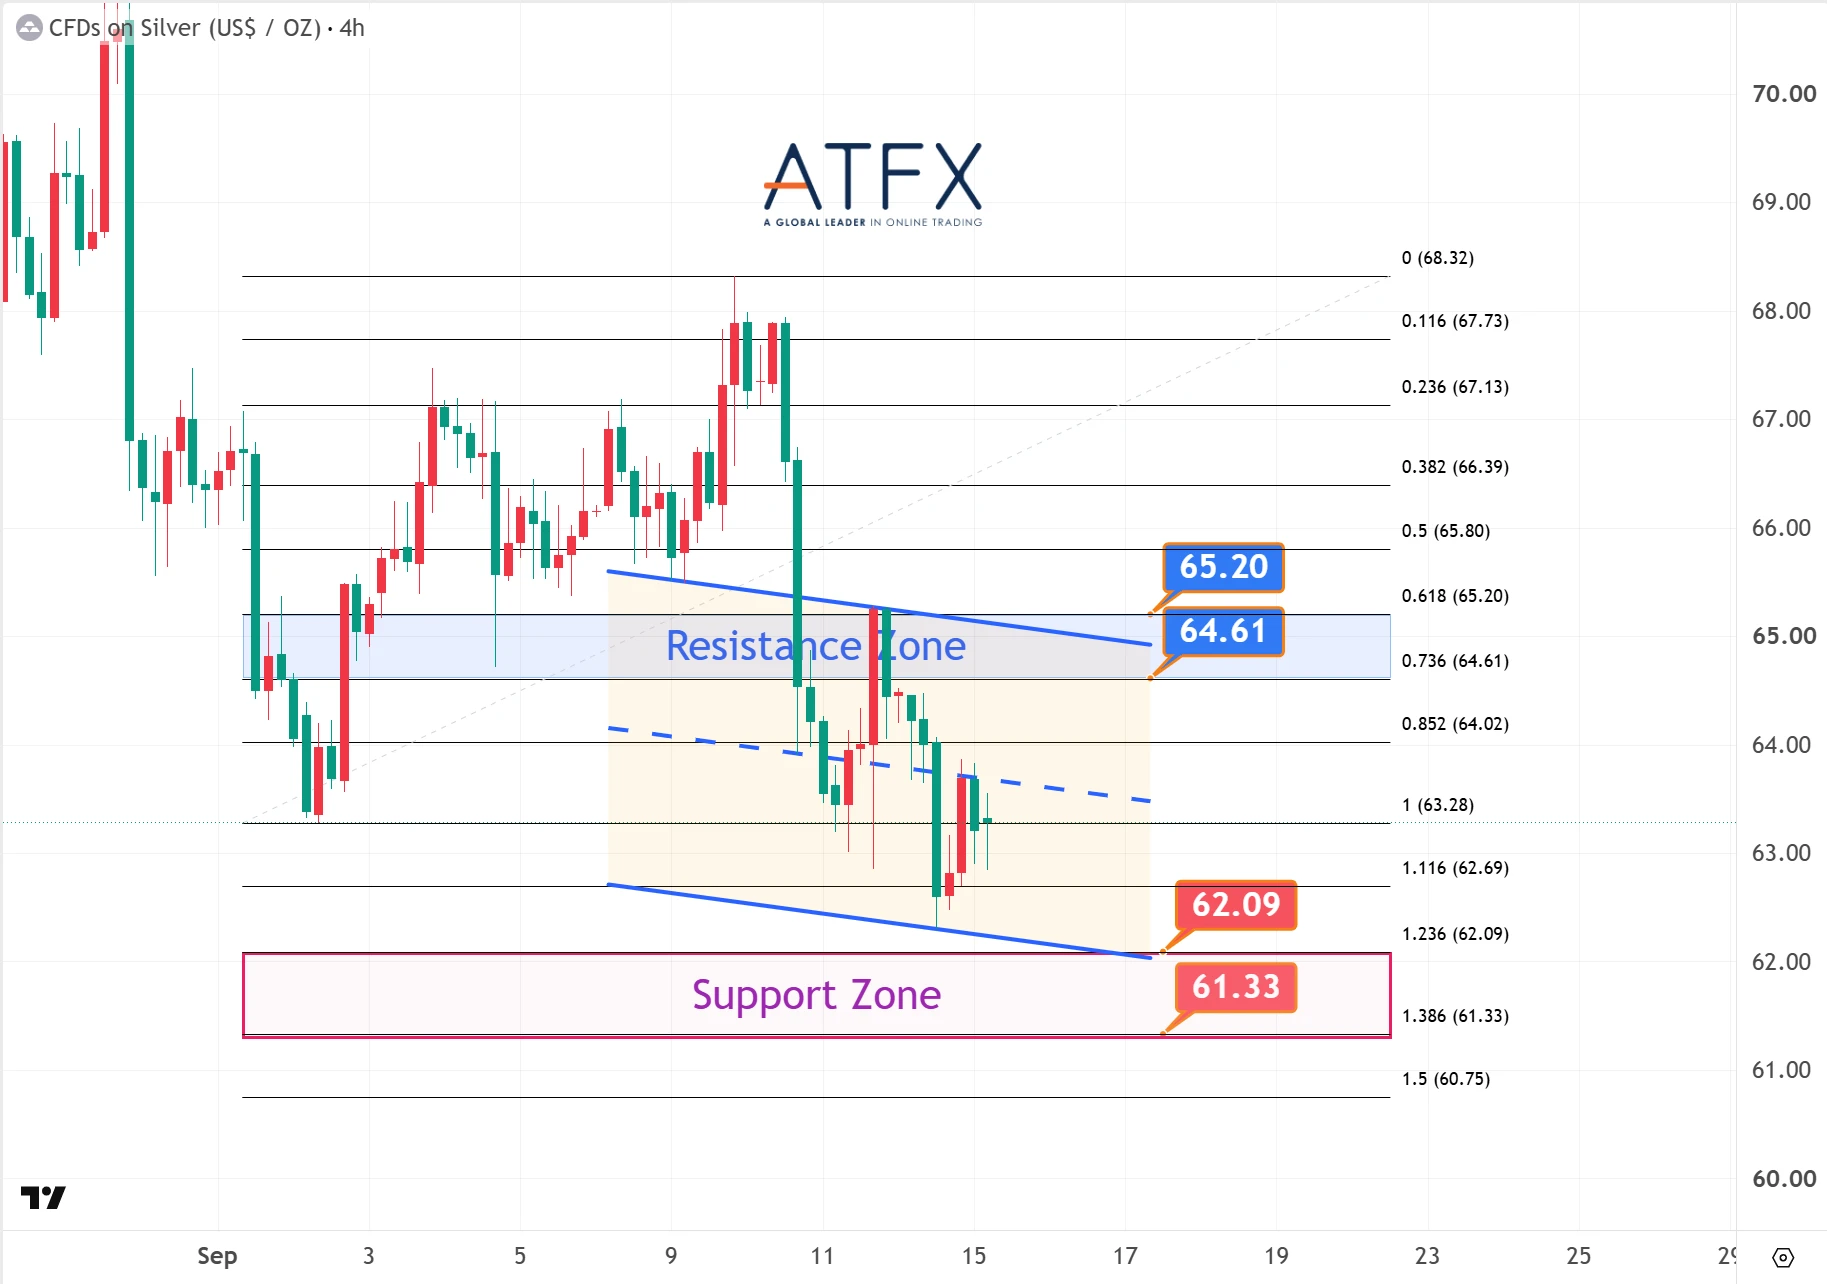
- Resistance: 64.61 / 65.20
- Support: 62.09 / 61.33
Precious metals weakened as the dollar strengthened and higher US bond yields weighed on sentiment. Gold fell below $4,300, its lowest level since early August.
Analyst View: Cautious positioning ahead of the Fed may keep gold within its current downward channel, with attention on the trendline support.
Bias: Bearish
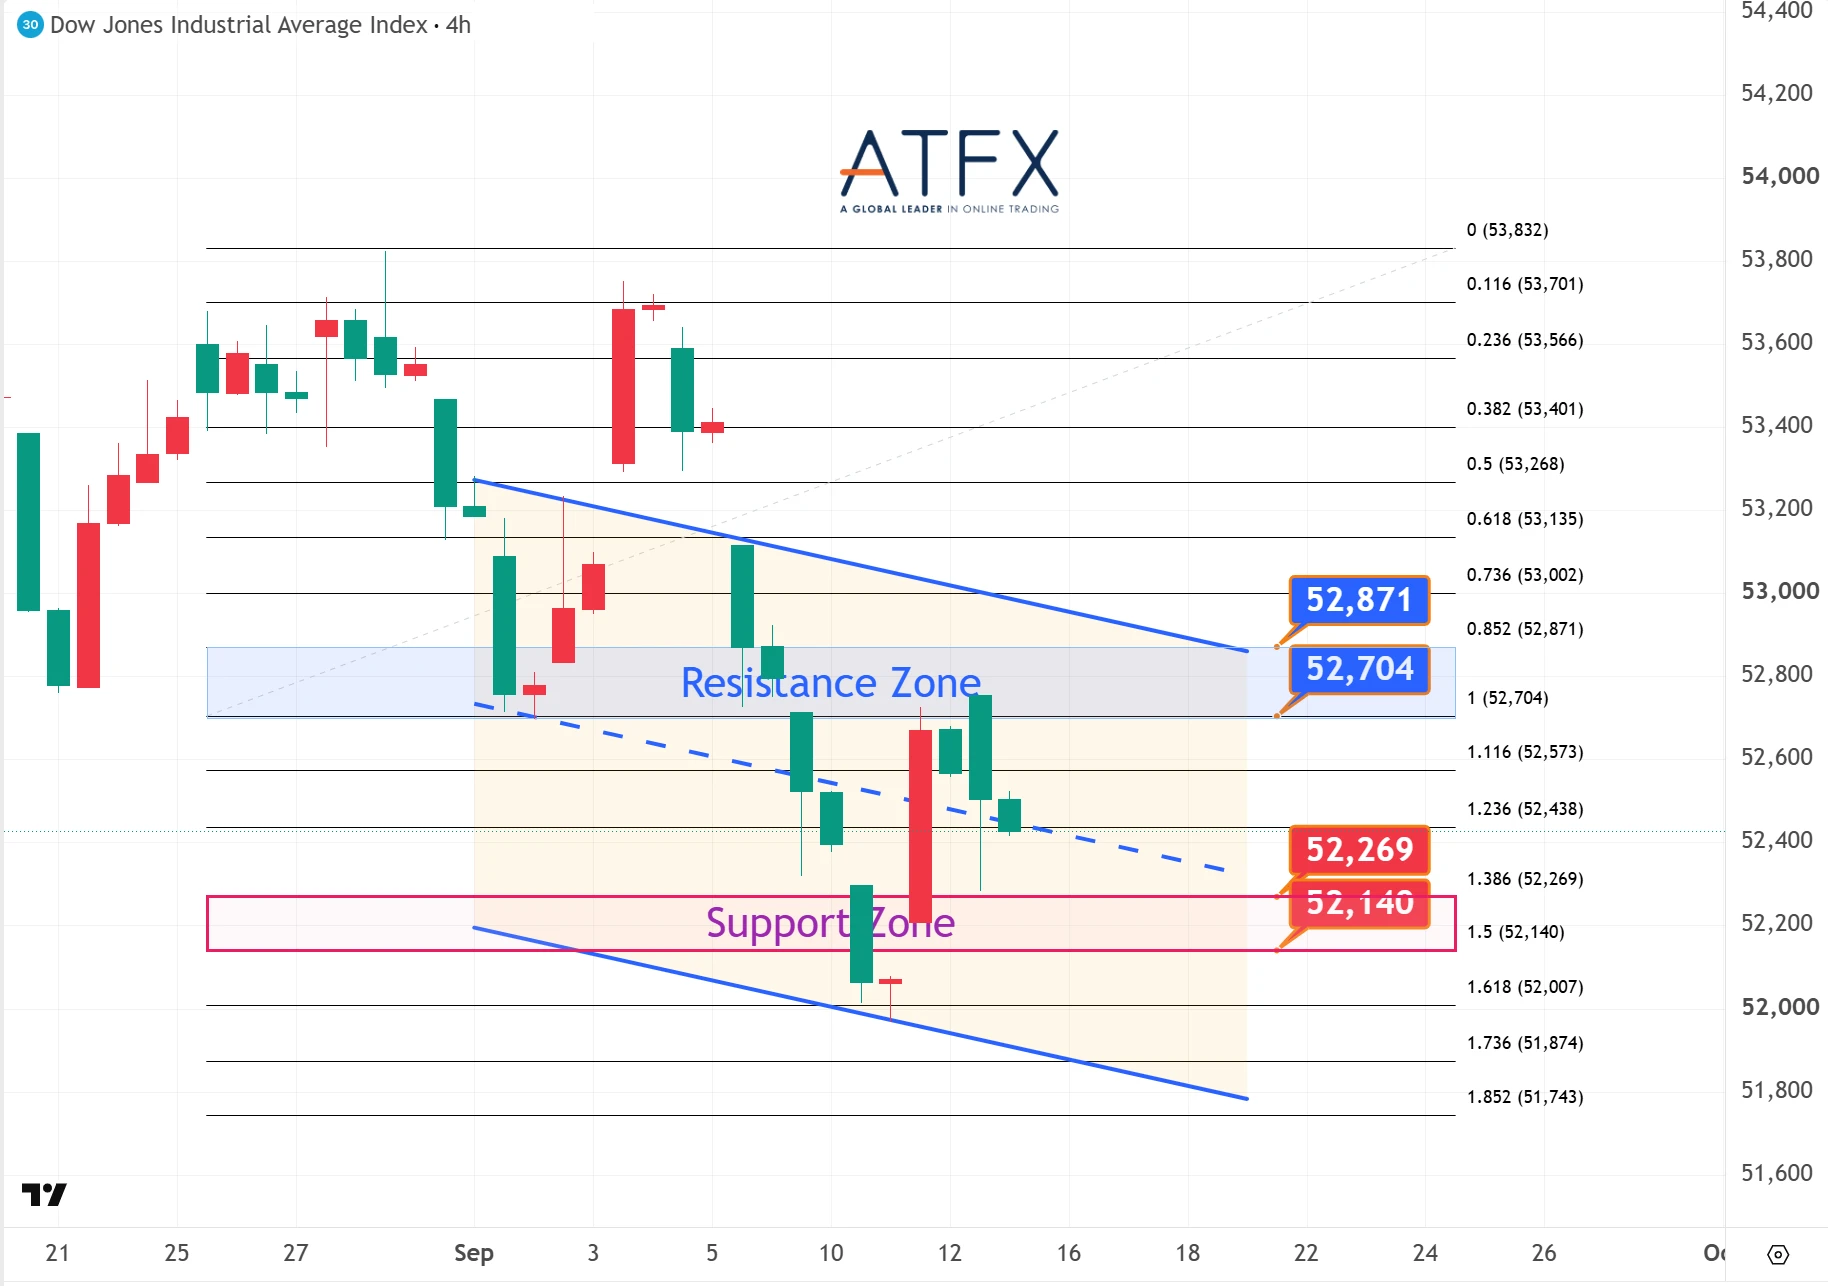
- Resistance: 52704 / 52871
- Support: 52269 / 52140
U.S. equities closed lower, led by weakness in industrials, materials, and utilities sectors.
Analyst View: With the Fed decision approaching, the index is likely to remain under pressure within its recent range. Key support levels are at 52269 and 52140.
Bias: Bearish

- Resistance: 29307 / 29408
- Support: 29005 / 28878
Technology stocks declined after AI industry leaders called for a more cautious pace of AI development, which dragged Nasdaq lower.
Analyst View: A break below last week’s low has reinforced downside risks, although pre-Fed caution may temporarily curb selling pressure.
Bias: Bearish
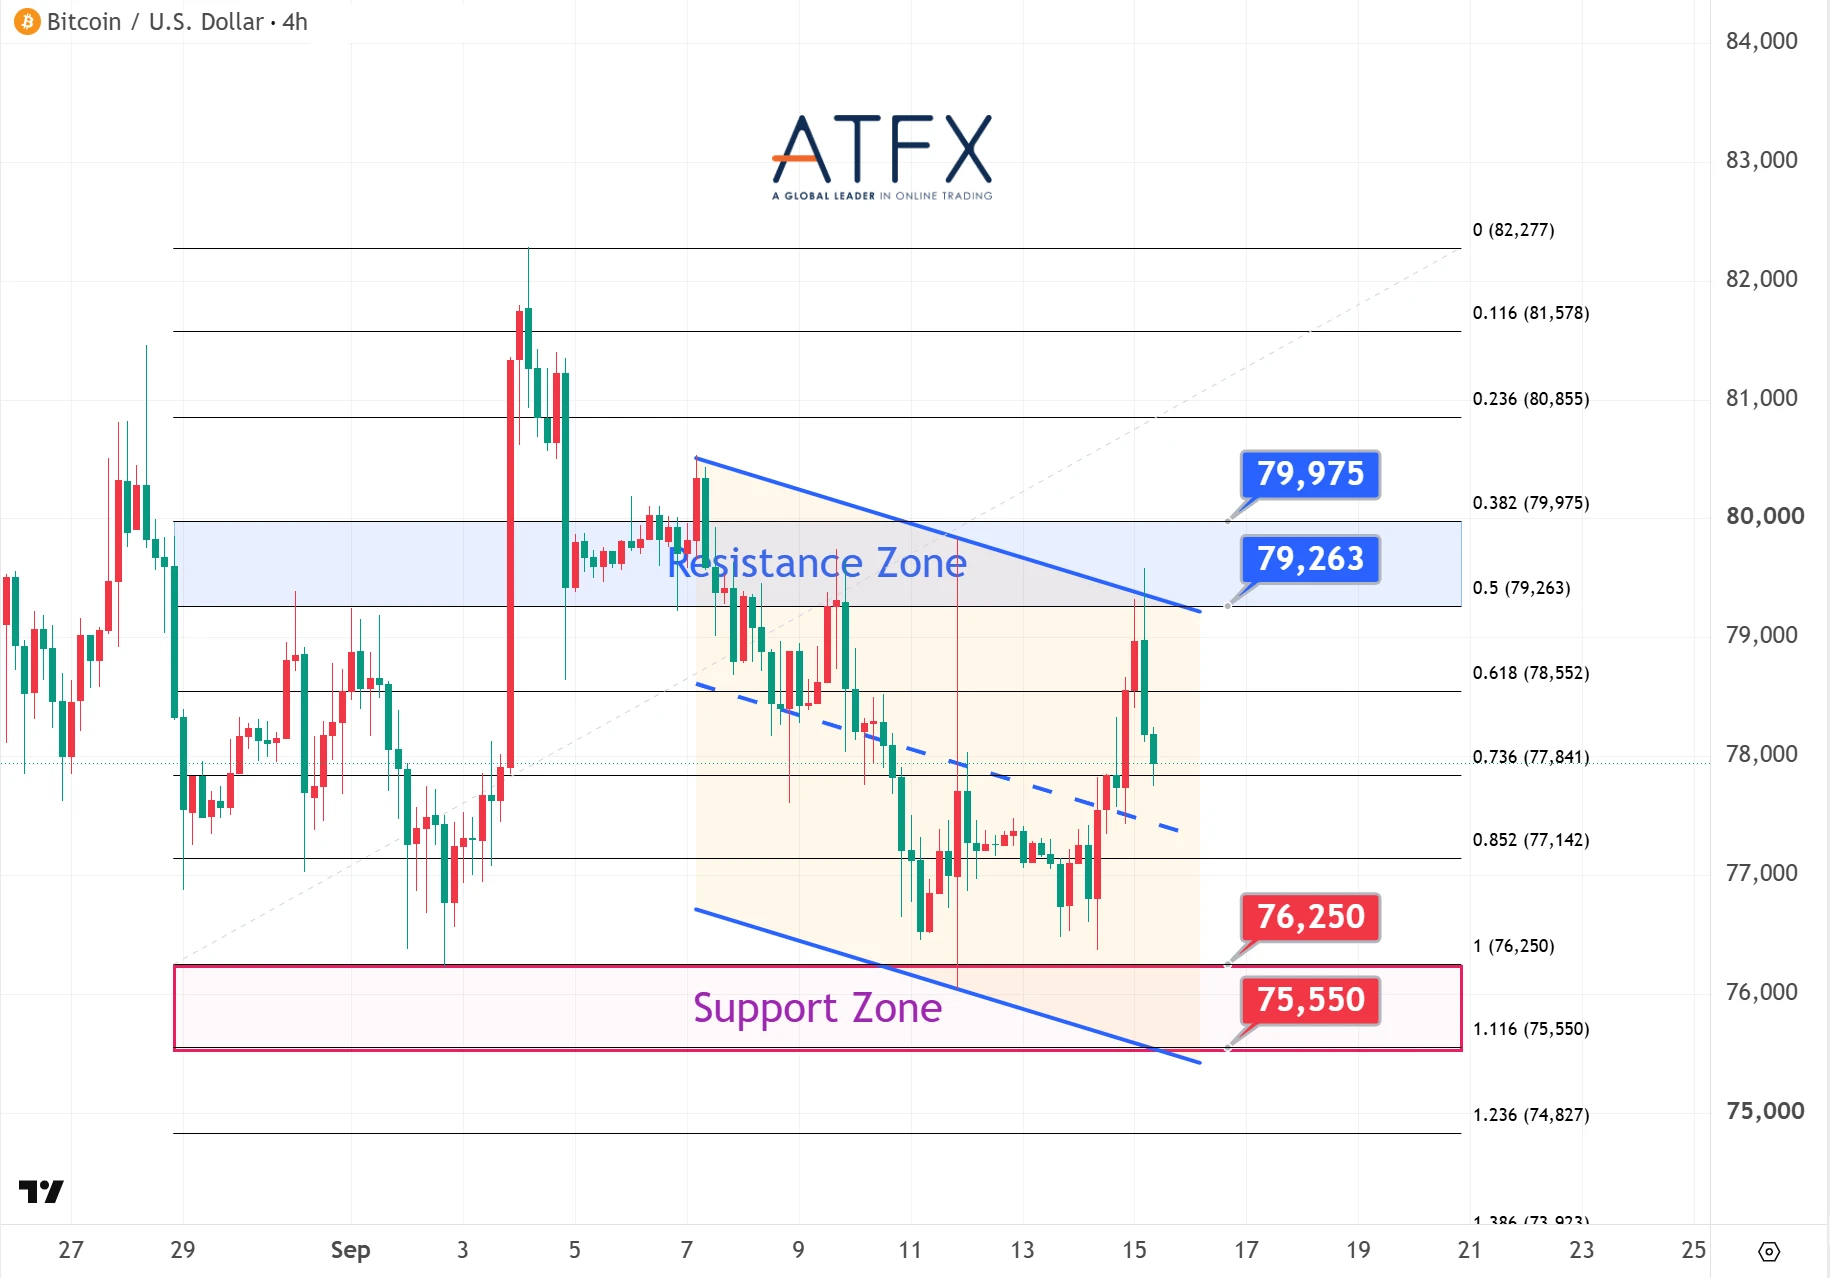
- Resistance: 79,263 / 79,975
- Support: 76,250 / 75,550
Bitcoin rose above $77,000, posting its strongest gain since early September.
Analyst View: The recovery lost momentum near the 10-day moving average. A sustained break above this level is required to confirm a broader rebound.
Bias: Rebound Facing Resistance
Enjoy trading! The content is for reference only. Please ensure that you understand the risk.