


Key Takeaways
Today’s Focus: US September CPI is scheduled for 20:30 (GMT+8), with annual inflation forecast at 3.7%, compared with 3.4% previously. The difference between the actual reading and expectations may affect market pricing of the Fed’s interest-rate path, with implications for the Dollar, Treasury yields, gold and equities. Other scheduled events include China’s inflation release and a speech by ECB President Christine Lagarde. |
Global Market Review 14/10/2026
- US stocks closed lower.
- The Dow declined 0.35% to 51,671, the S&P 500 declined 0.02% to 7,805, and the Nasdaq declined 0.15% to 27,204.
- The Dollar Index declined 0.35% to 102.22.
- The 2-year Treasury yield increased 0.2 basis points to 4.789%, while the 10-year yield declined 2.9 basis points to 5.209%.
- Brent declined 0.34% to $106.29, WTI increased 0.43% to $94.41, and gold declined 0.34% to $4,156.75.
- Bitcoin subsequently traded near $83,397 after rising from approximately $81,055.
Economic Calendar
Key Events on October 14 (GMT+8)
| Time (GMT+8) | Event | Importance |
|---|---|---|
| 09:30 | CN CPI & PPI SEP | ** |
| 16:30 | EU ECB President Lagarde Speech | *** |
| 20:30 | US CPI YoY SEP | *** |
Key Events on October 15 (GMT+8)
| Time (GMT+8) | Event | Importance |
|---|---|---|
| 02:00 | US Fed Beige Book | *** |
| 04:30 | US API Crude Oil Stock Change | *** |
| 08:30 | AU Employment Change SEP | ** |
| 14:00 | UK GDP MoM AUG | ** |
| 17:00 | EU Industrial Production MoM AUG | ** |
| 20:30 | US PPI MoM SEP | *** |
| 20:30 | US Retail Sales MoM SEP | *** |
| 20:30 | US Initial Jobless Claims | *** |
Markets Analysis 14/10/2026
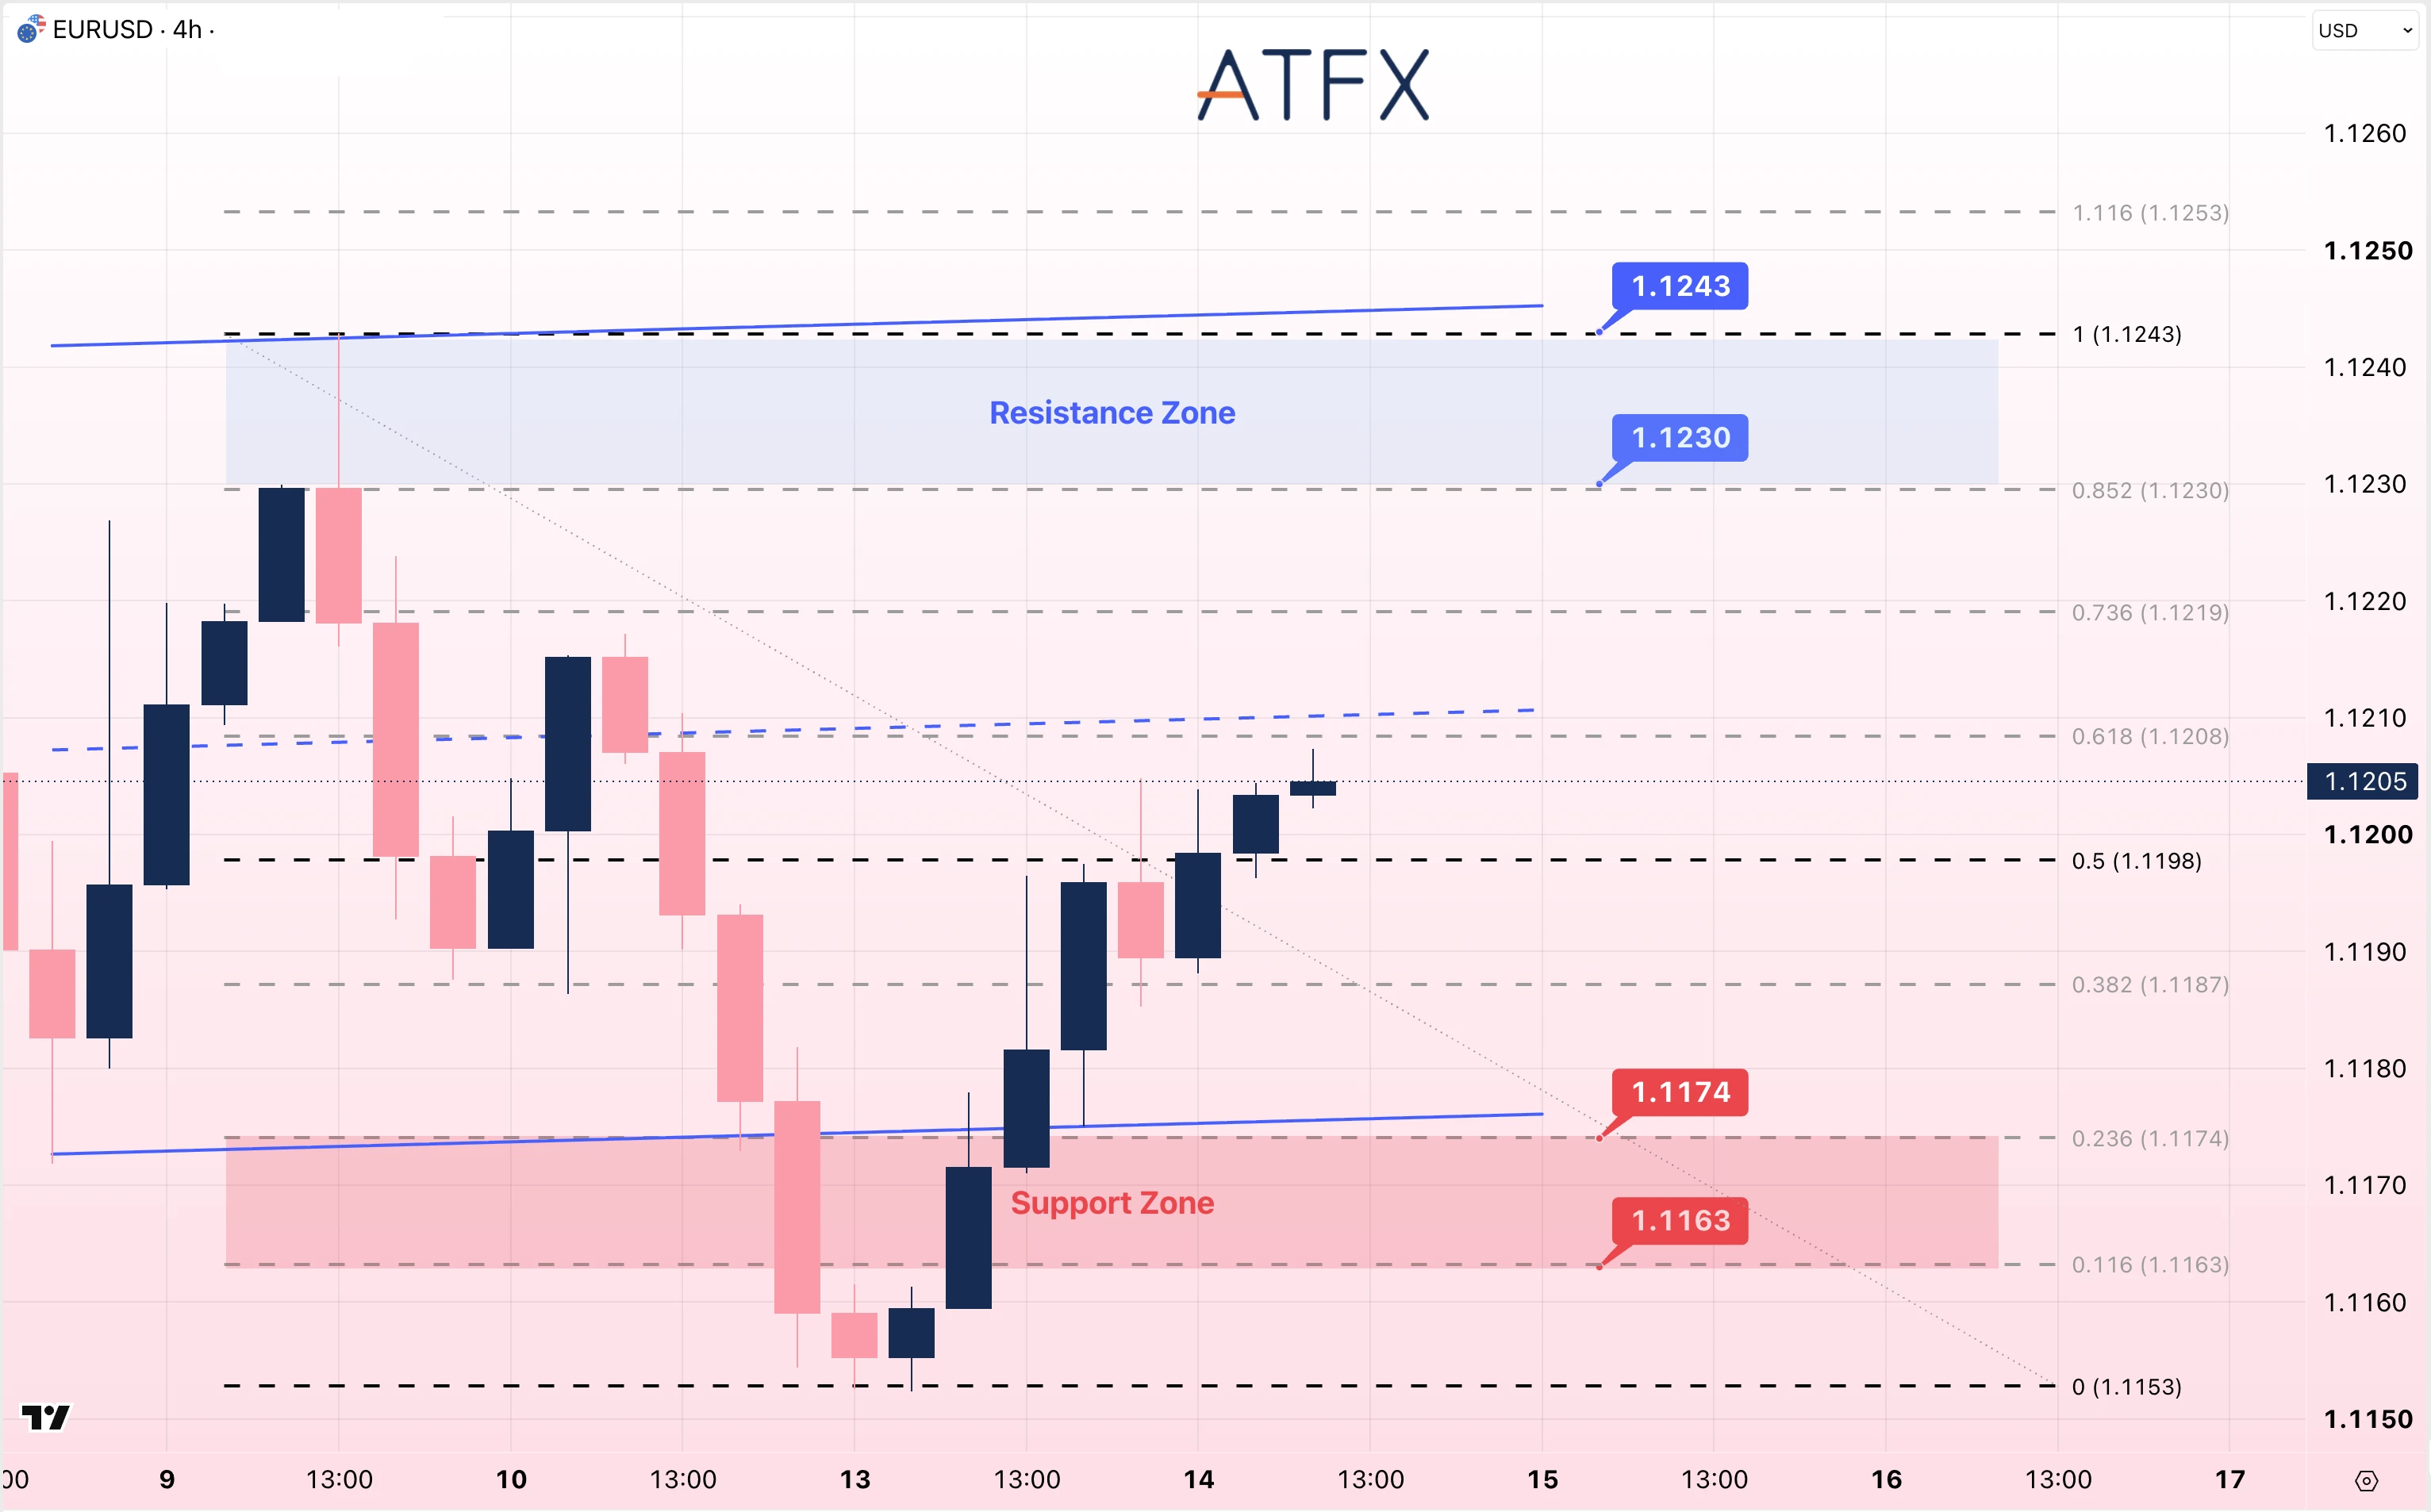
- Resistance: 1.1230/1.1243
- Support: 1.1174/1.1163
Technical Overview: EUR/USD traded around 1.1205 after rising from 1.1153. On the 4-hour chart, price remains within a slightly rising range and is approaching the midline near 1.1208–1.1210. A move above 1.1230 could be followed by a test of 1.1243; below 1.1174, the next marked support is 1.1163.
Technical Structure: Rebound within a short-term rising range.
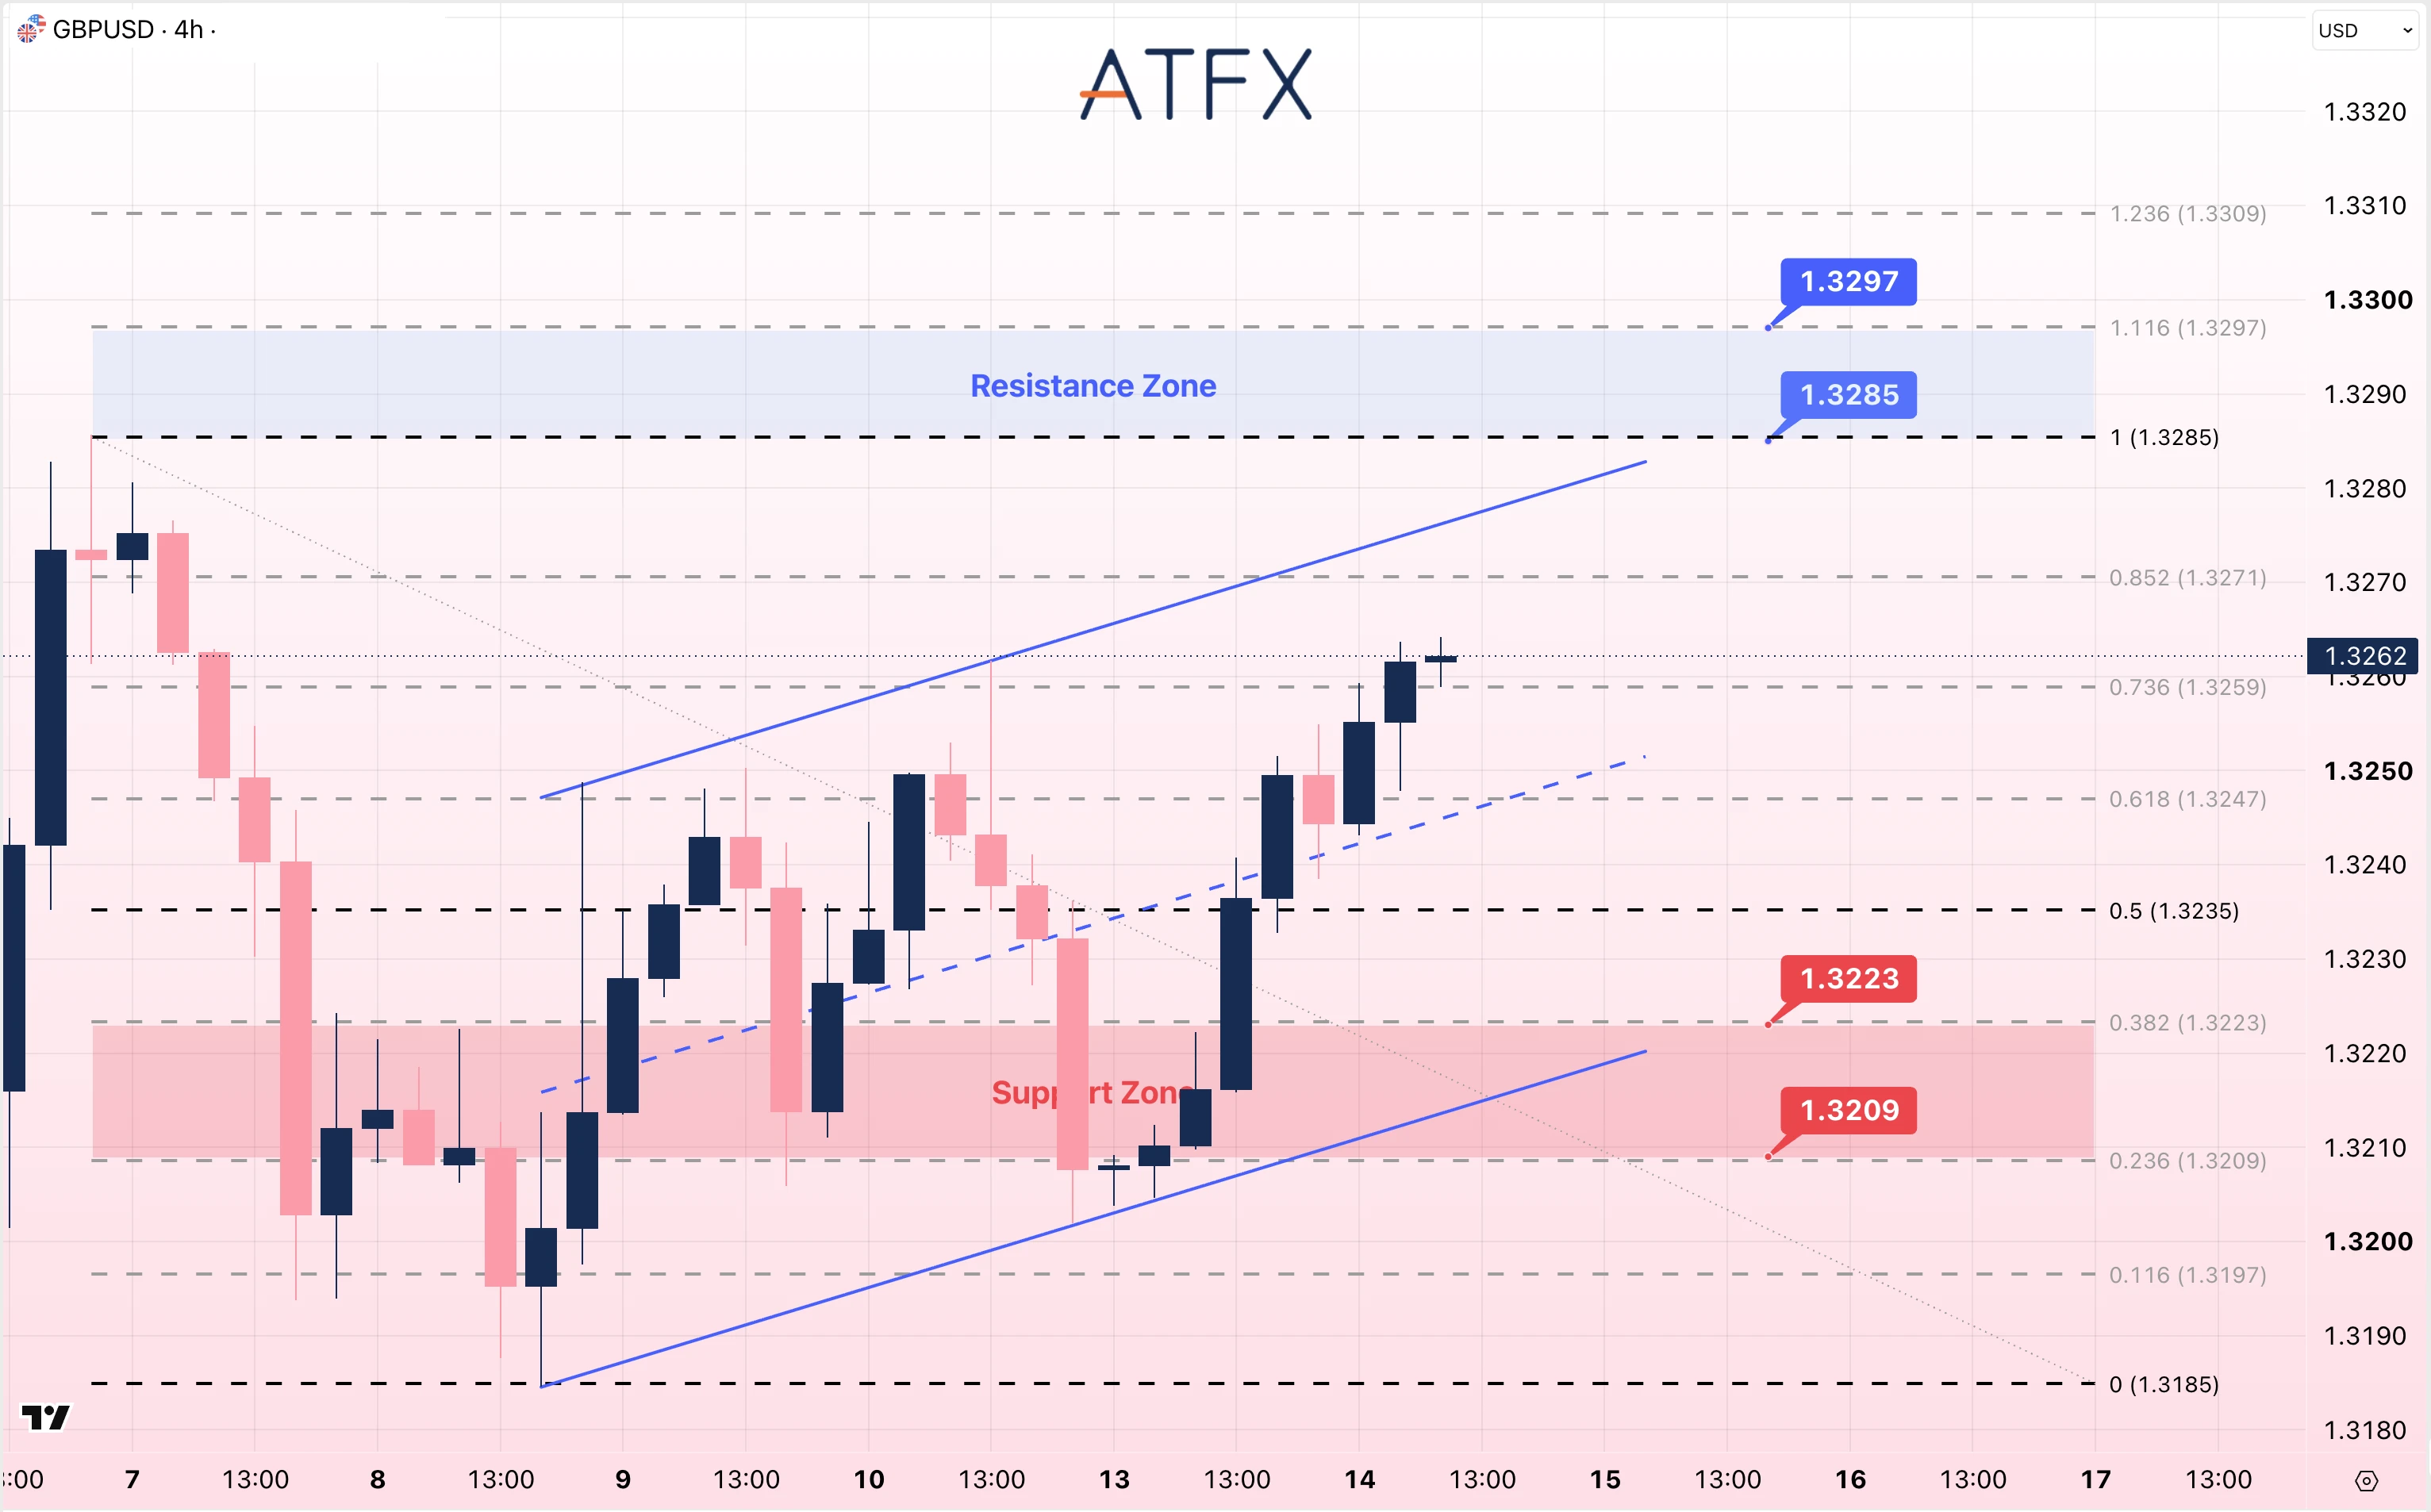
- Resistance: 1.3285/1.3297
- Support: 1.3223/1.3209
Technical Overview: GBP/USD traded around 1.3262 within the broader 1.3200–1.3300 range. Price is above the rising channel’s midline near 1.3250. UK GDP is scheduled for Thursday. A move above 1.3285 could bring 1.3297 into consideration; below 1.3223, the next marked support is 1.3209.
Technical Structure: Range trading, with price above the rising channel’s midline.
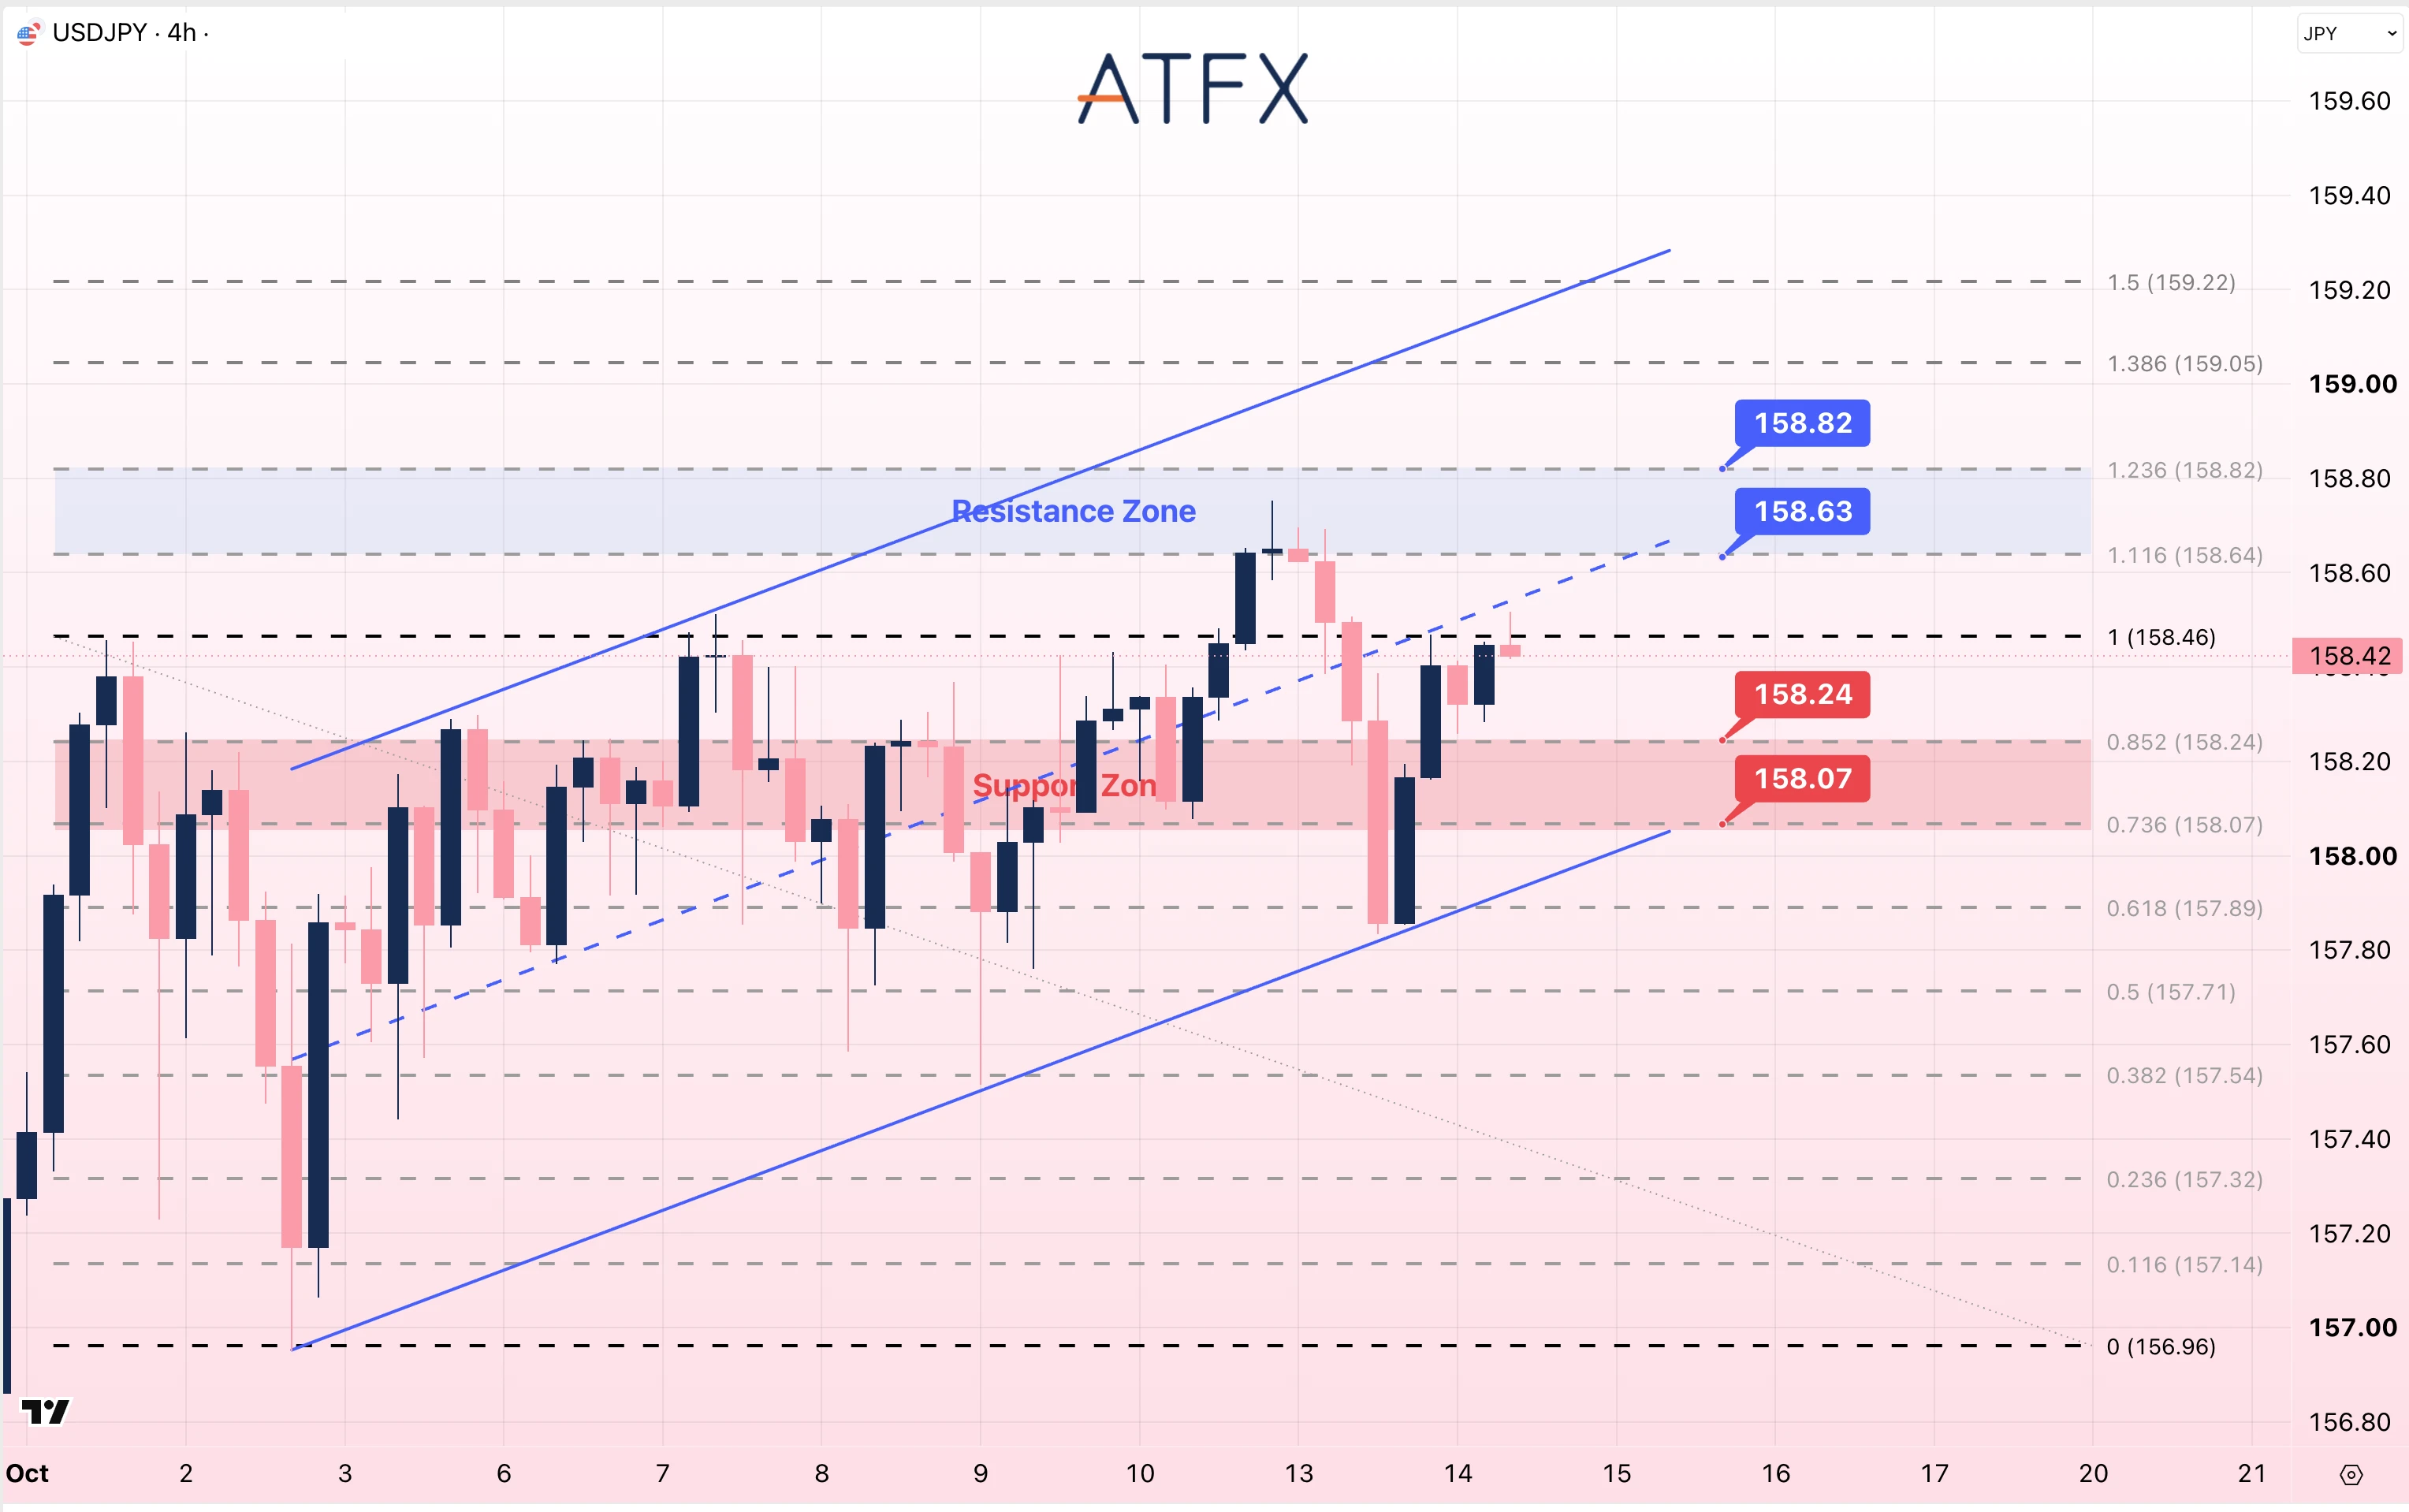
- Resistance: 158.63/158.82
- Support: 158.24/158.07
Technical Overview: USD/JPY traded near 158.42 after declining from the 158.63 resistance area. Reports indicated that the BoJ may wait until December before raising rates. On the chart, price remains below the rising channel’s midline near 158.50. Above 158.63, the next marked resistance is 158.82; below 158.24, the next support is 158.07.
Technical Structure: Rising channel, with price below the midline.
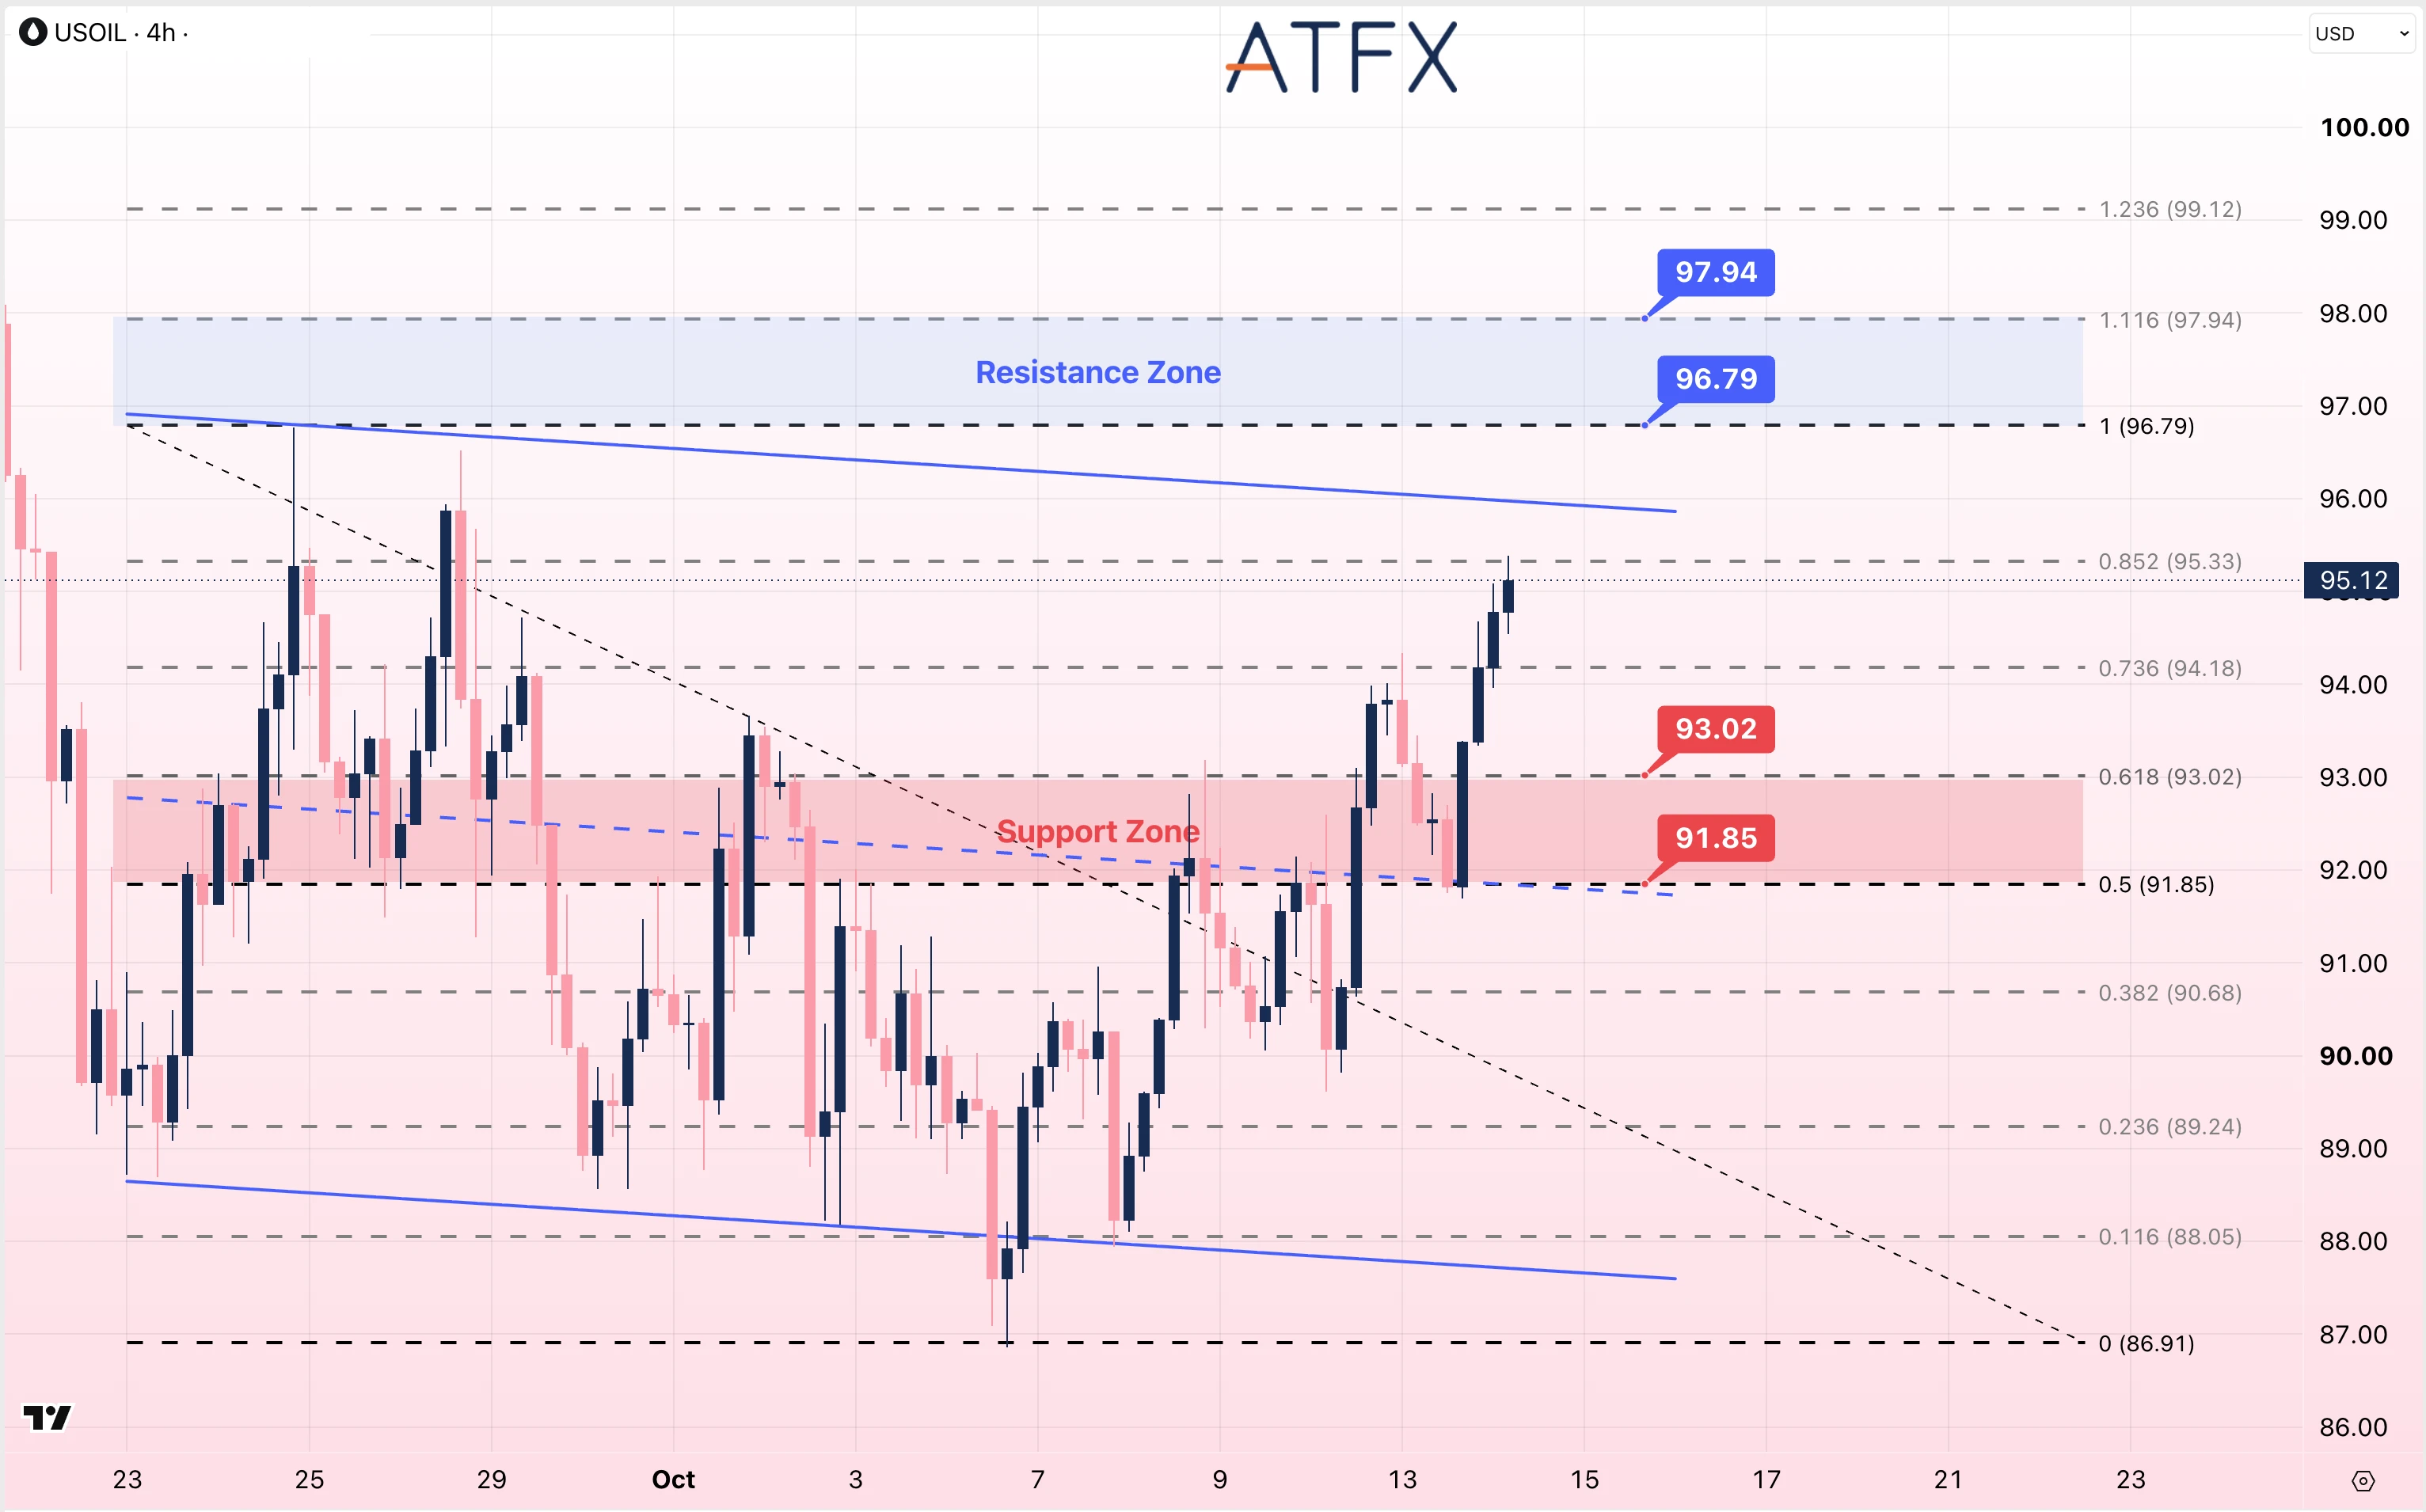
- Resistance: 96.79/97.94
- Support: 93.02/91.85
Technical Overview: Oil-market developments include Houthi attacks, restrictions on Hormuz shipping and hurricane-related production outages. USOIL traded near $95.12 on the 4-hour chart after moving above $94.18. The broader descending channel’s upper boundary is near $96. The marked resistance levels are $96.79 and $97.94, with support at $93.02 and $91.85.
Technical Structure: Rebound within a broader descending channel.
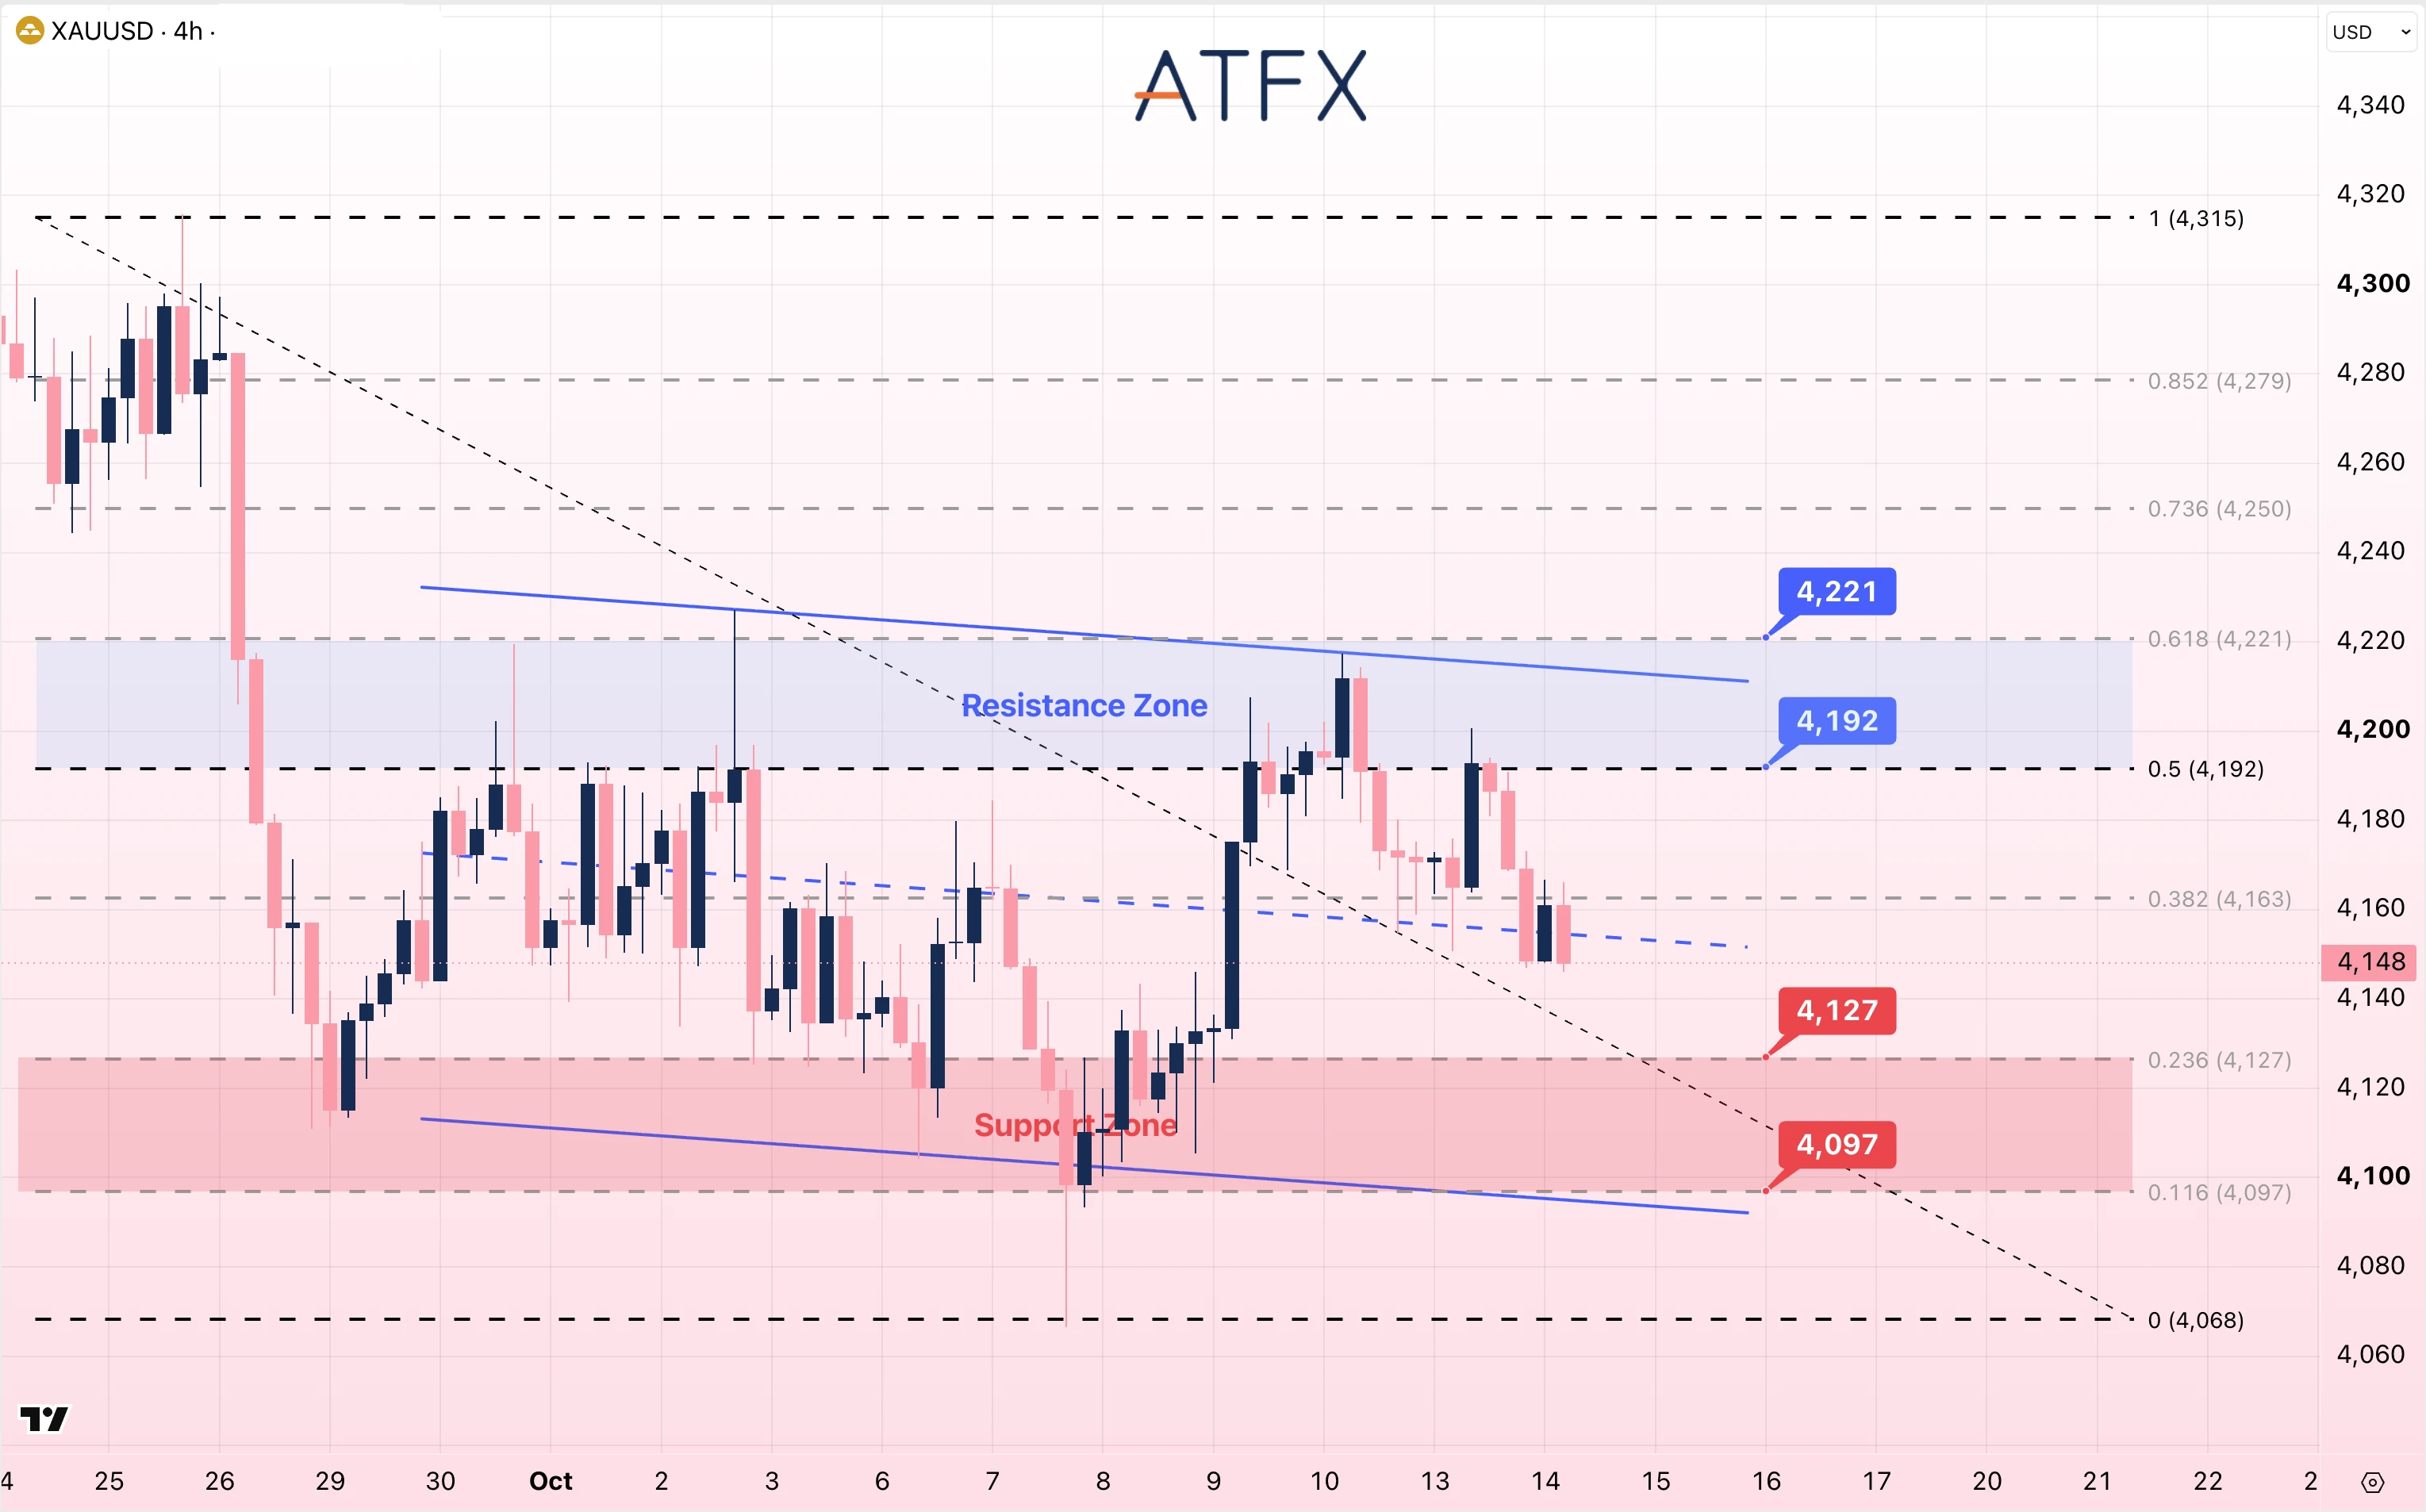
- Resistance: 4192/4221
- Support: 4127/4097
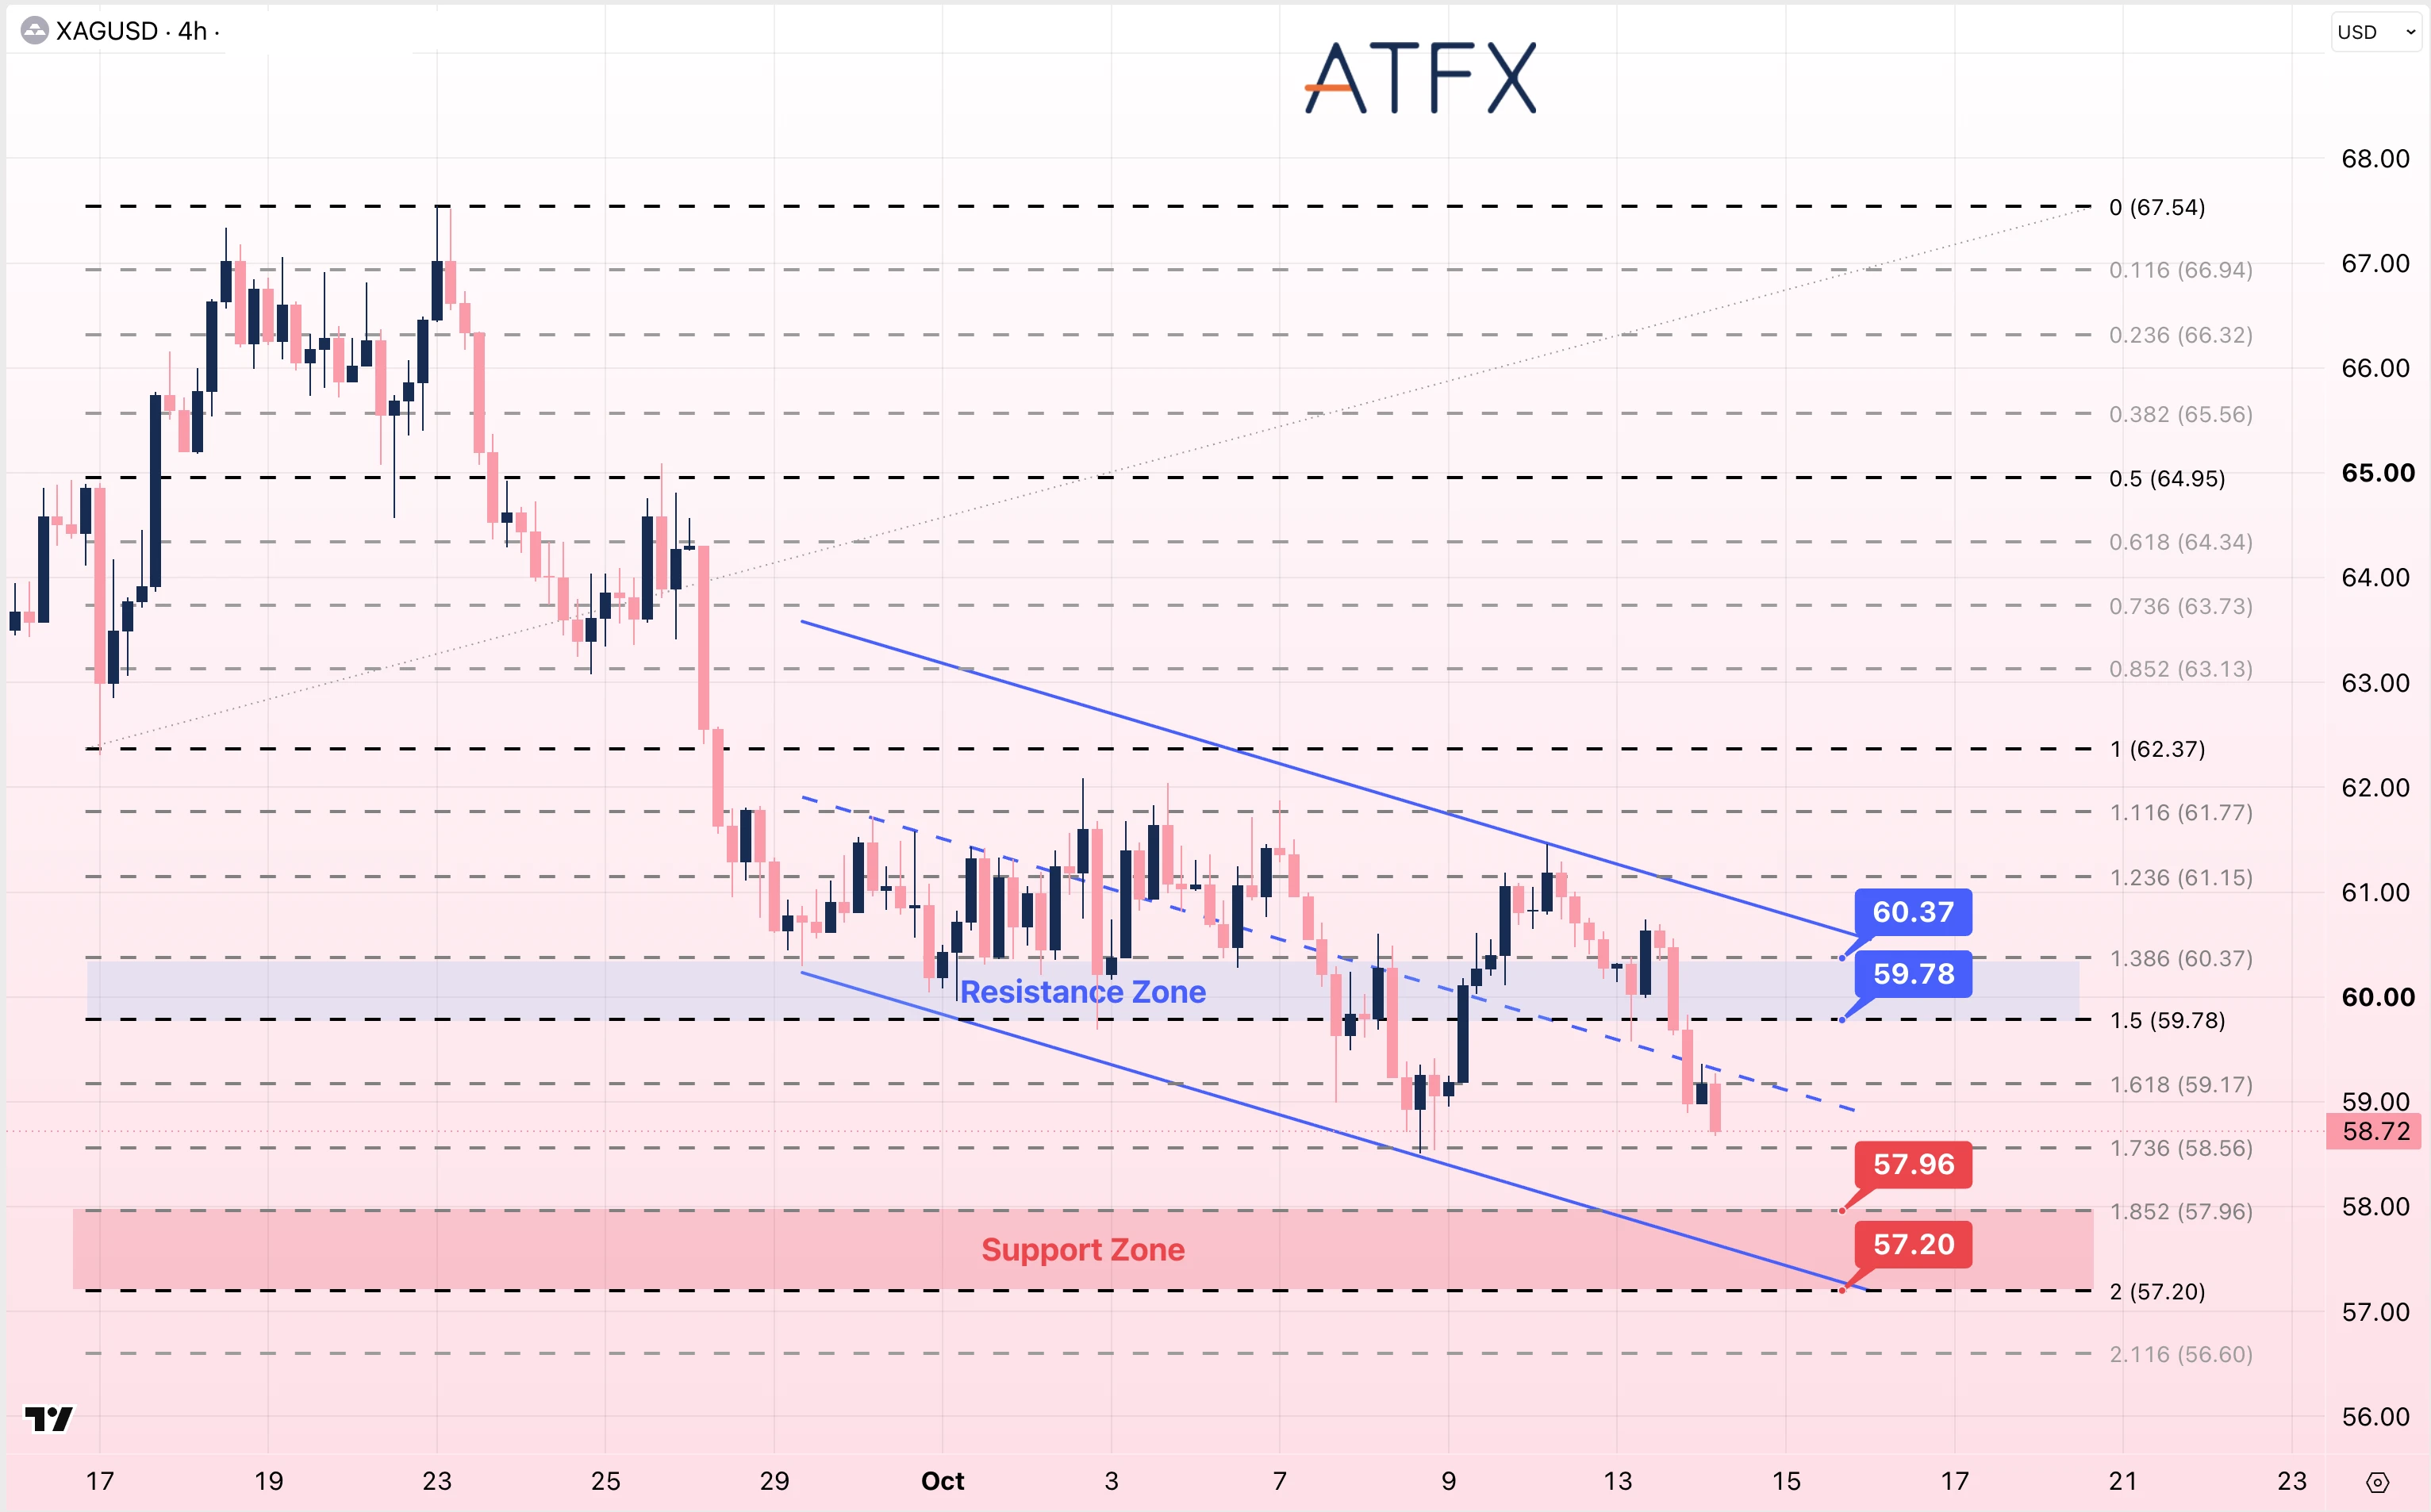
- Resistance: 59.78/60.37
- Support: 57.96/57.20
Technical Overview: Gold traded near $4,148 after declining from approximately $4,192 and remains below the descending channel’s midline. Resistance is marked at $4,192 and $4,221. Below $4,127, the next marked support is $4,097.
Silver traded near $58.72 within a descending channel. Resistance is marked at $59.78 and $60.37. Below $57.96, the next marked support is $57.20.
Technical Structure: Gold and silver remain within descending channels.
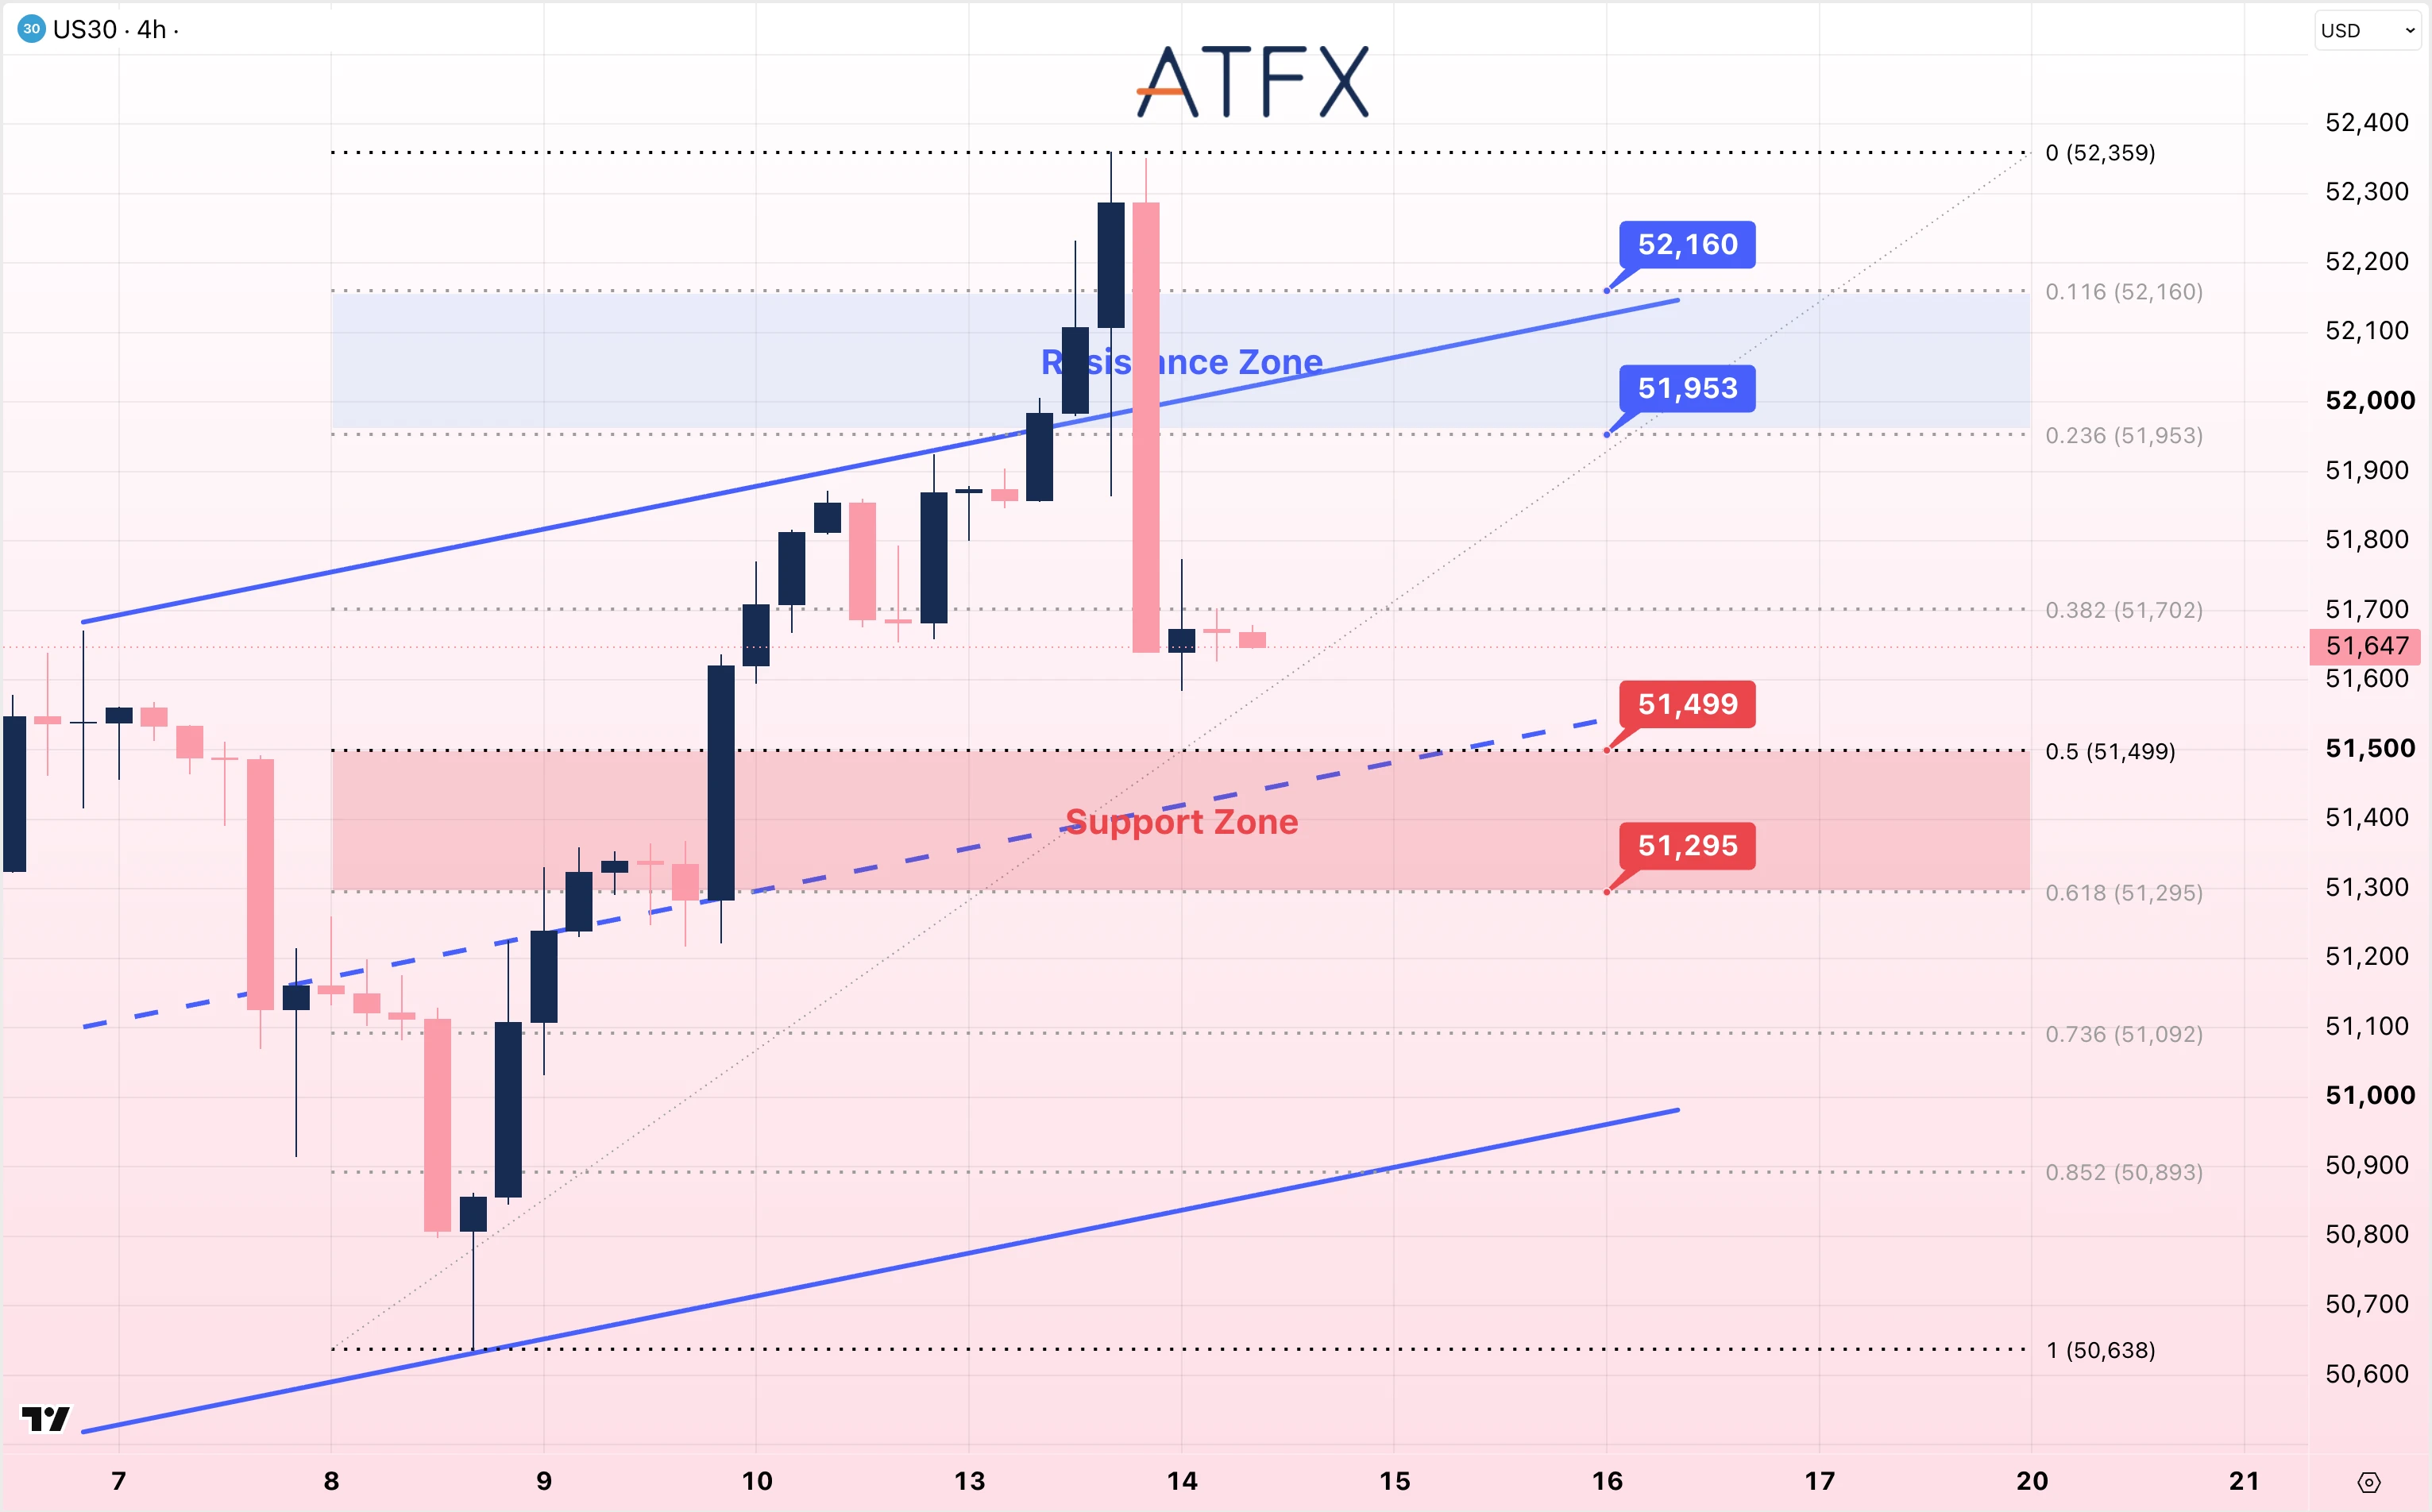
- Resistance: 51953/52160
- Support: 51499/51295
Technical Overview: The US30 chart shows a decline from 52,359 to approximately 51,647. Price has moved below 51,702 but remains within the broader rising channel. Resistance is marked at 51953 and 52160. The 51499–51295 support area is near the channel midline; a move below this area would place price in the channel’s lower half.
Technical Structure: Pullback within a broader rising channel.
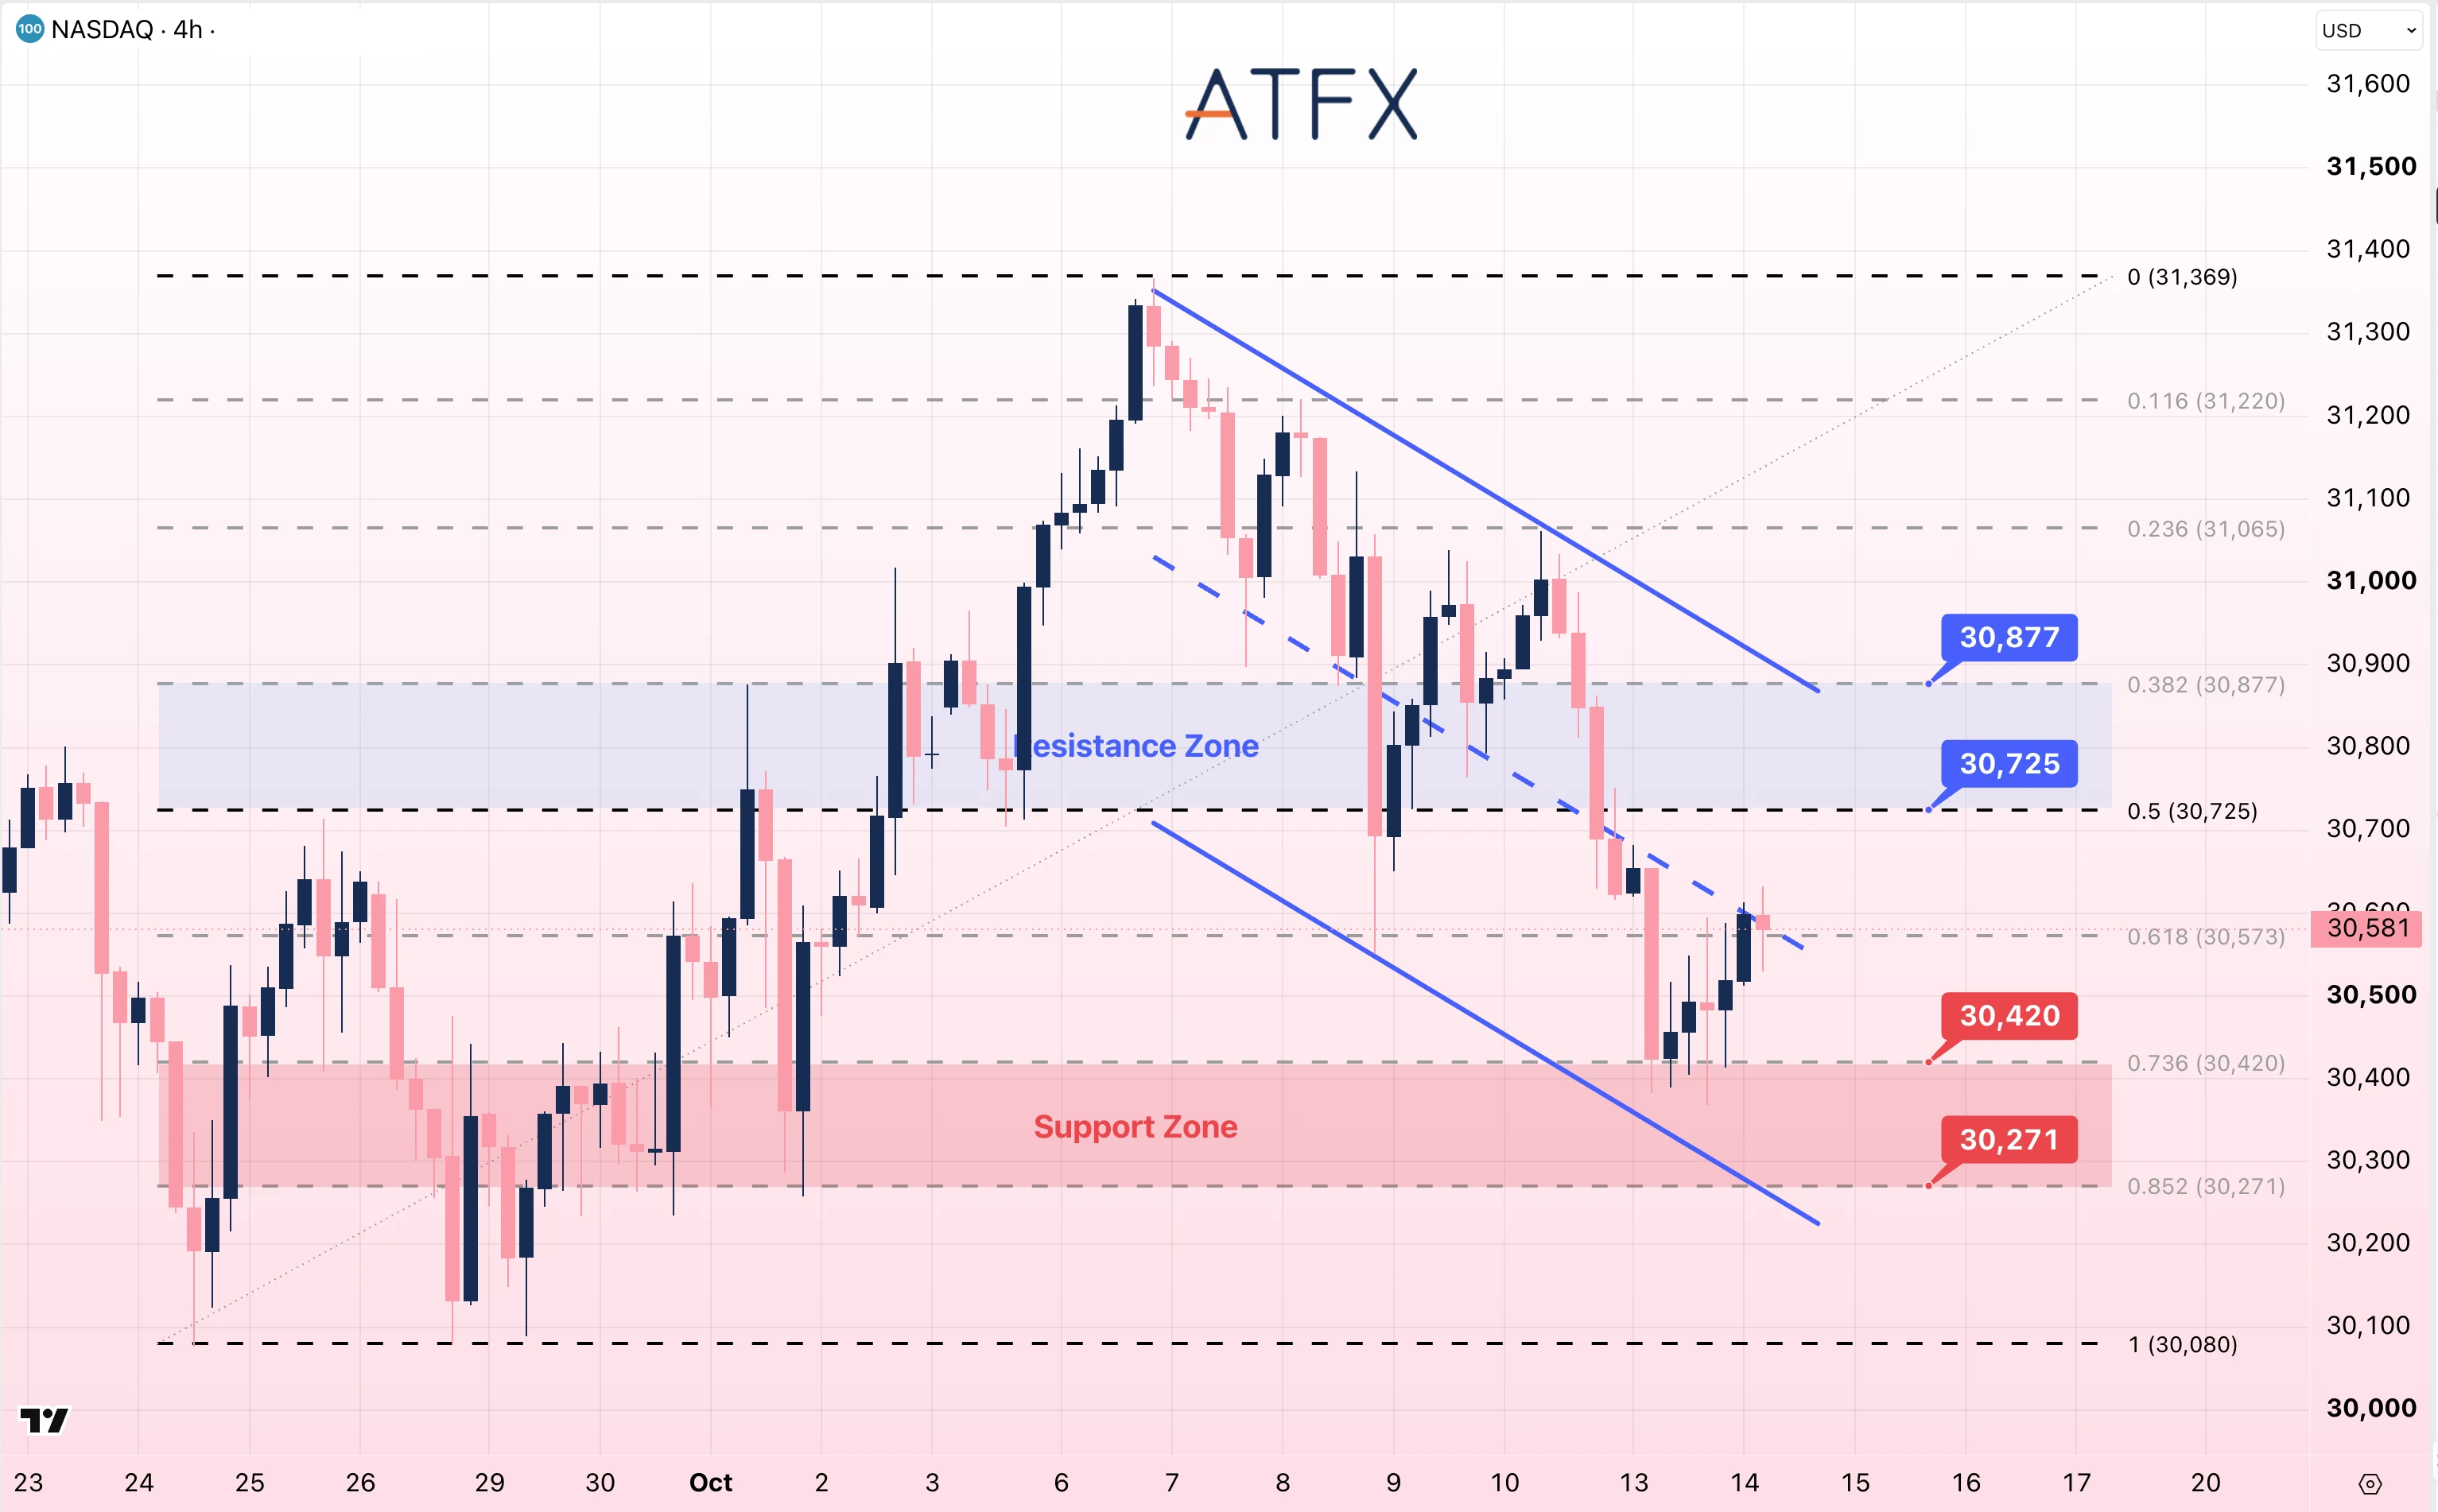
- Resistance: 30725/30877
- Support: 30420/30271
Technical Overview: NAS100 rose from the 30,420 support area to approximately 30,581. Price remains within a descending channel, near its midline and the 30,573 Fibonacci level. Resistance is marked at 30725 and 30877. Below 30420, the next marked levels are 30271 and 30080.
Technical Structure: Rebound within a descending channel.
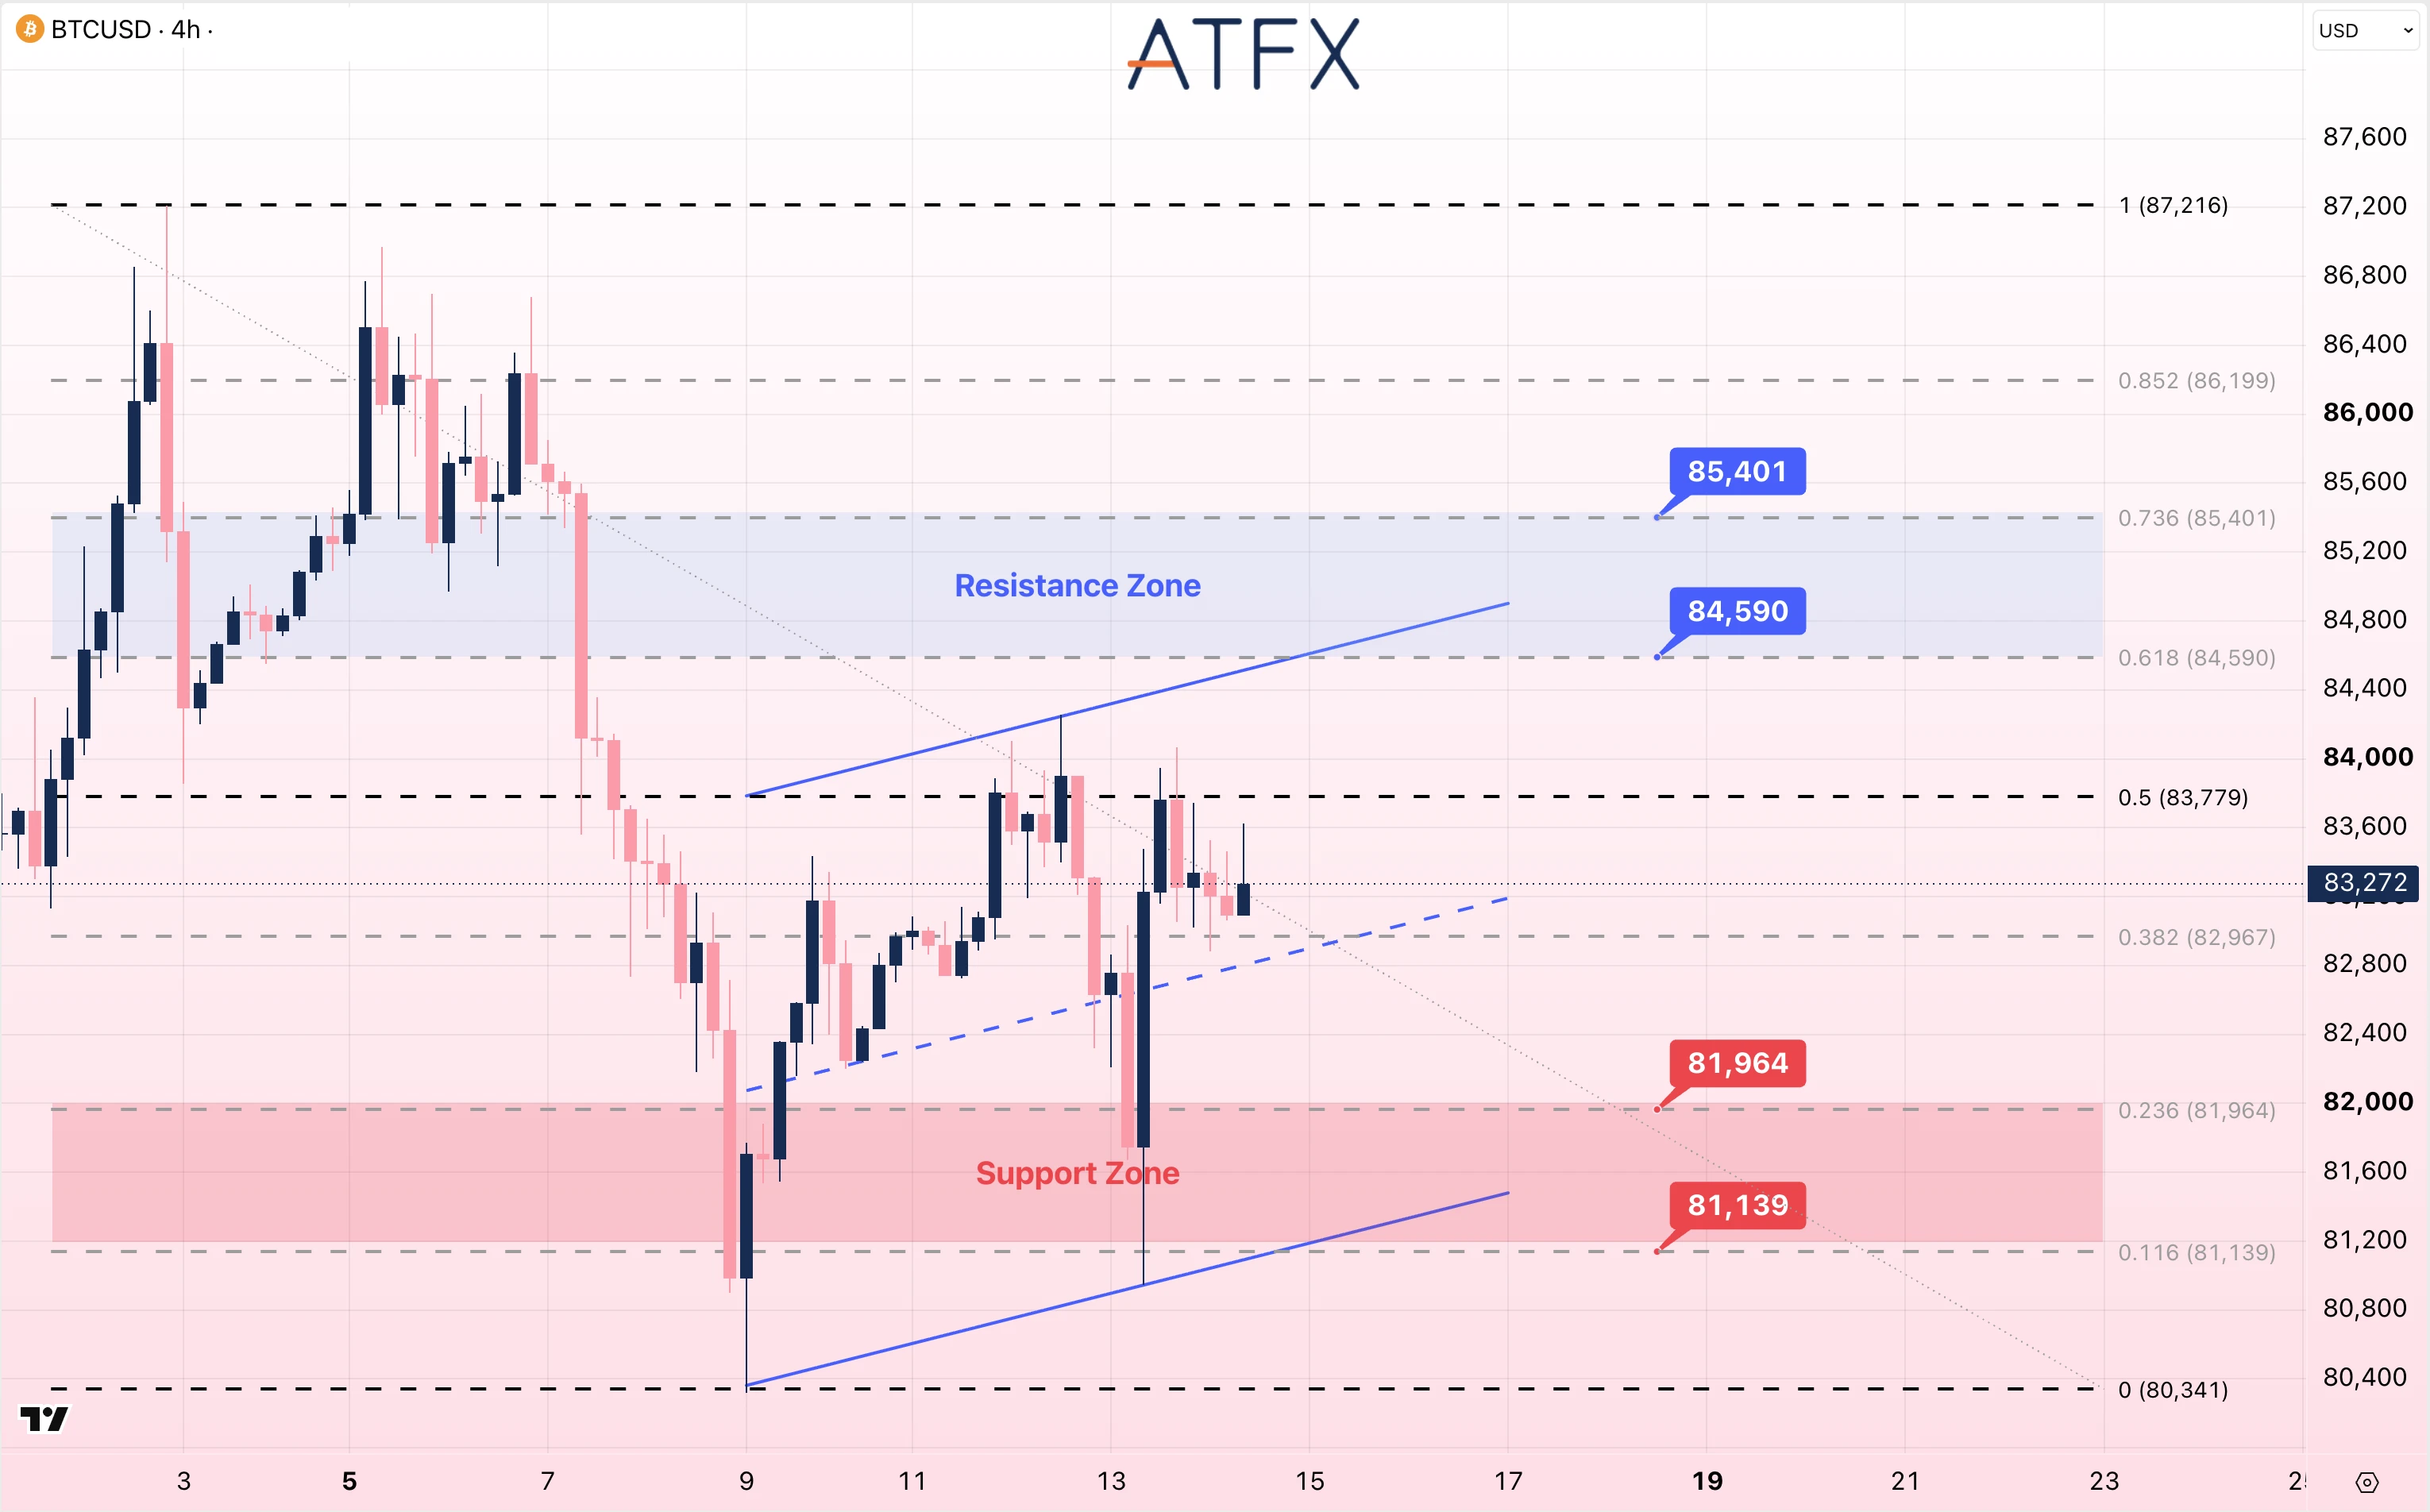
- Resistance: 84590/85401
- Support: 81964/81139
Technical Overview: Bitcoin traded near $83,272 within a short-term rising channel. Price remains below the $83,779 pivot after several moves toward $84,000 did not hold. Resistance is marked at $84,590 and $85,401. Below $81,964, the next marked support levels are $81,139 and $80,341.
Technical Structure: Short-term rising channel, with price below the $83,779 pivot.
Disclaimer: This analysis is for reference only and does not constitute investment advice.