

(By ATFX Analyst Team)
Key Takeaways
Market attention now shifts to the Bank of England, where rates are projected to remain unchanged. Investors will scrutinize the voting split and policy guidance for indications of divisions within the Monetary Policy Committee. Any adjustment in the BoE’s outlook could introduce heightened volatility in GBP and UK equity markets. |
Global Market Review 17/09/2026
- U.S. equities declined following the Federal Reserve’s rate increase.
- U.S. Treasury yields rose, and the Dollar Index advanced 0.3% to a near five-week high.
- Spot gold declined by 0.7% following a volatile session, despite an intraday recovery of over 1%.
- Oil prices retreated on news of increased Saudi crude supply via Oman, which alleviated concerns regarding Middle East supply risks.
Key Events Today:
| Time (GMT+8) | Event | Importance |
|---|---|---|
| 17:00 | EU CPI Final AUG | ** |
| 19:00 | BoE Interest Rate Decision & Meeting Minutes | *** |
| 20:30 | US Housing Starts & Building Permits AUG | ** |
| 20:30 | US Initial Jobless Claims | *** |
| 22:00 | US Pending Home Sales AUG | ** |
Key Events on Sep 18 (GMT+8)
| Time (GMT+8) | Event | Importance |
|---|---|---|
| 07:30 | JP Core CPI AUG | ** |
| 11:00 | BoJ Interest Rate Decision | *** |
| 14:00 | EU GERMANY PPI YoY AUG | ** |
| 14:00 | GB Retail Sales MoM AUG | ** |
| 14:30 | BOJ Press Conference | *** |
| 18:30 | ECB President Lagarde Speech | *** |
| 21:15 | US Industrial Production MoM AUG | ** |
| 21:15 | US Manufacturing Production MoM AUG | ** |
| 22:00 | US CB Leading Index AUG | ** |
Markets Analysis 17/09/2026
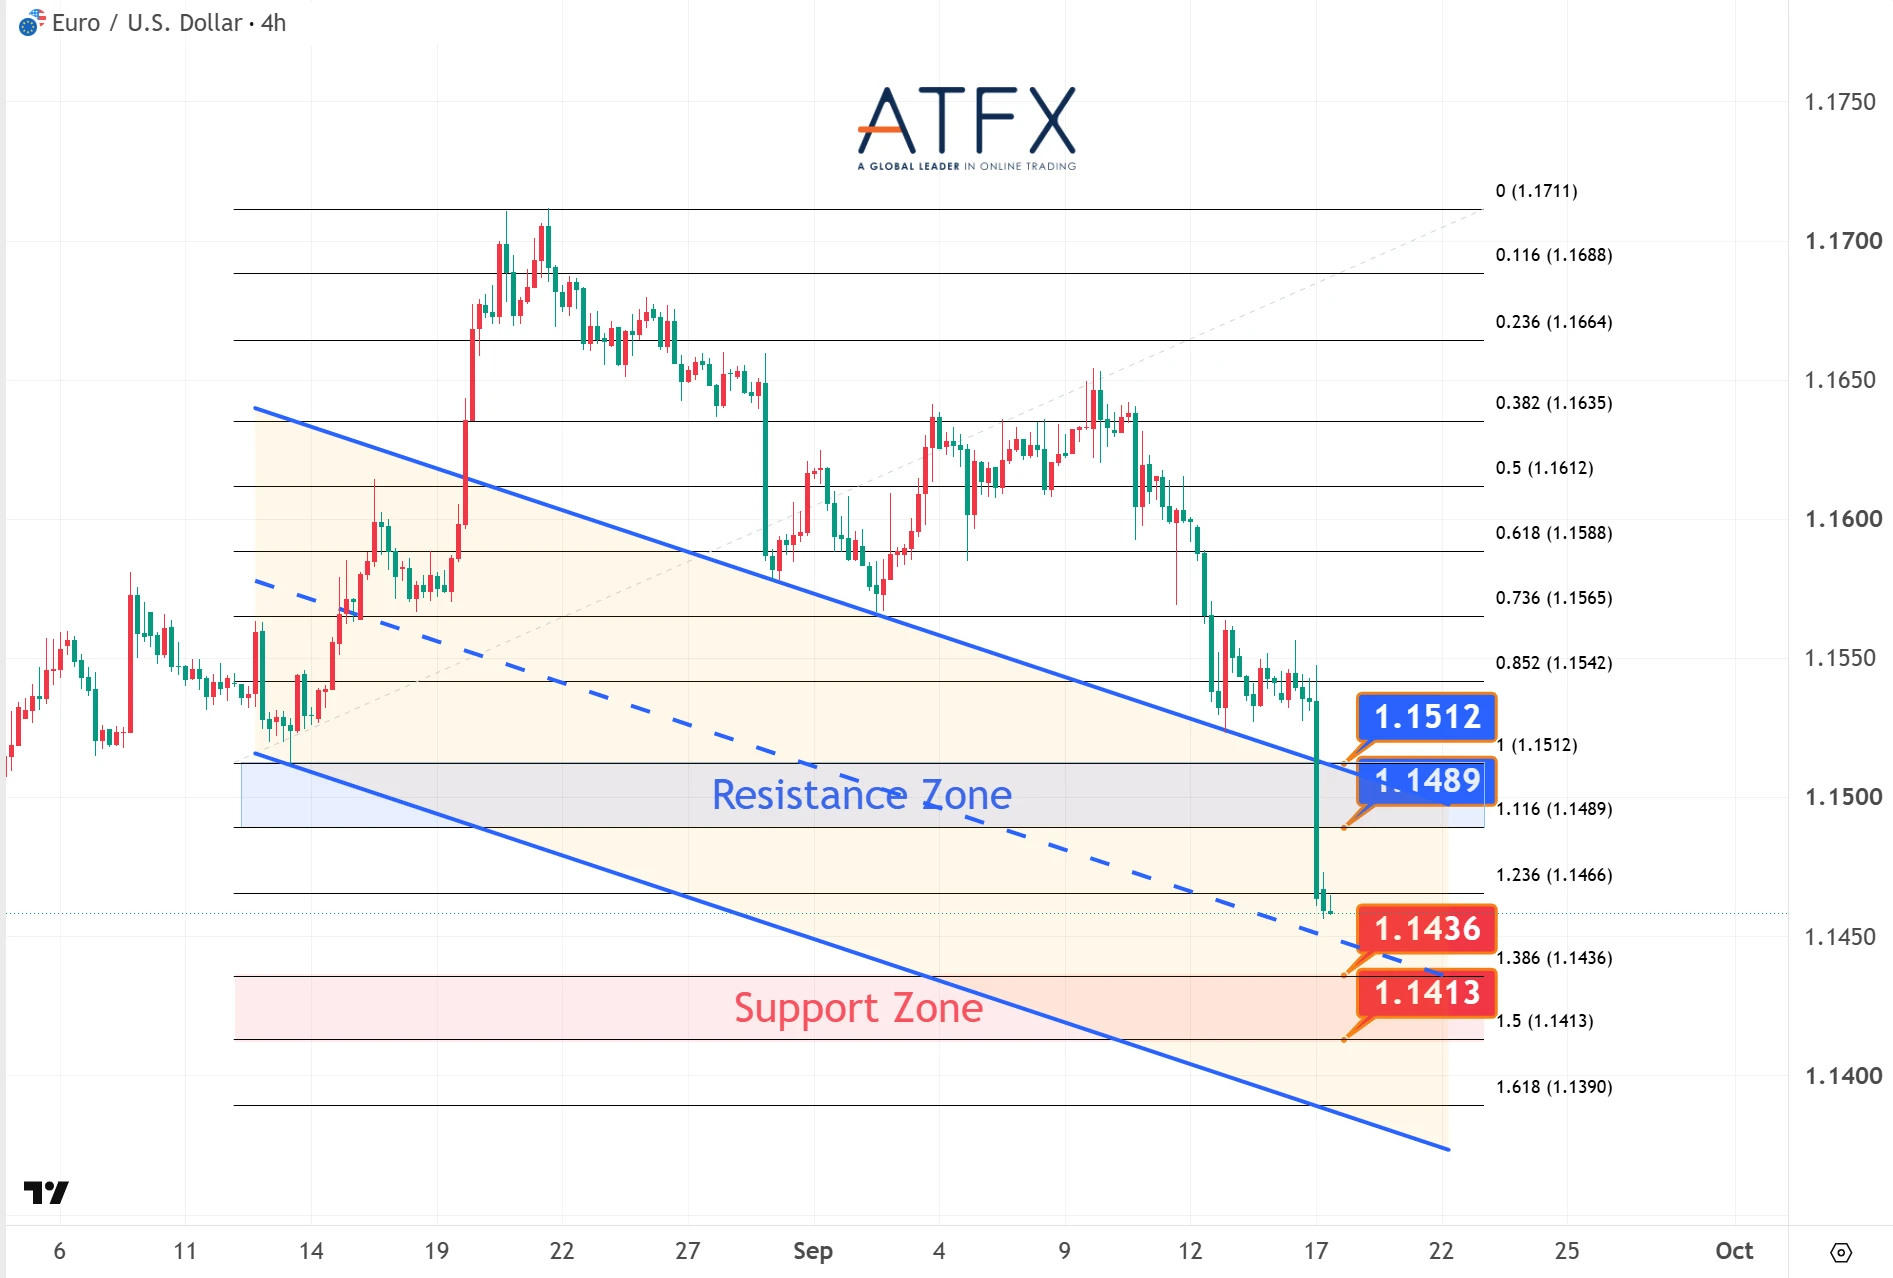
- Resistance: 1.1489 / 1.1512
- Support: 1.1436 / 1.1413
EUR/USD slipped below 1.1500 as higher U.S. yields and a stronger dollar followed the Fed’s hawkish guidance.
Analyst View: The pair has fallen to its lowest level since late July and may extend losses toward 1.1450 and below as markets continue to price in tighter Fed policy. Eurozone CPI data will be closely watched.
Bias: Bearish
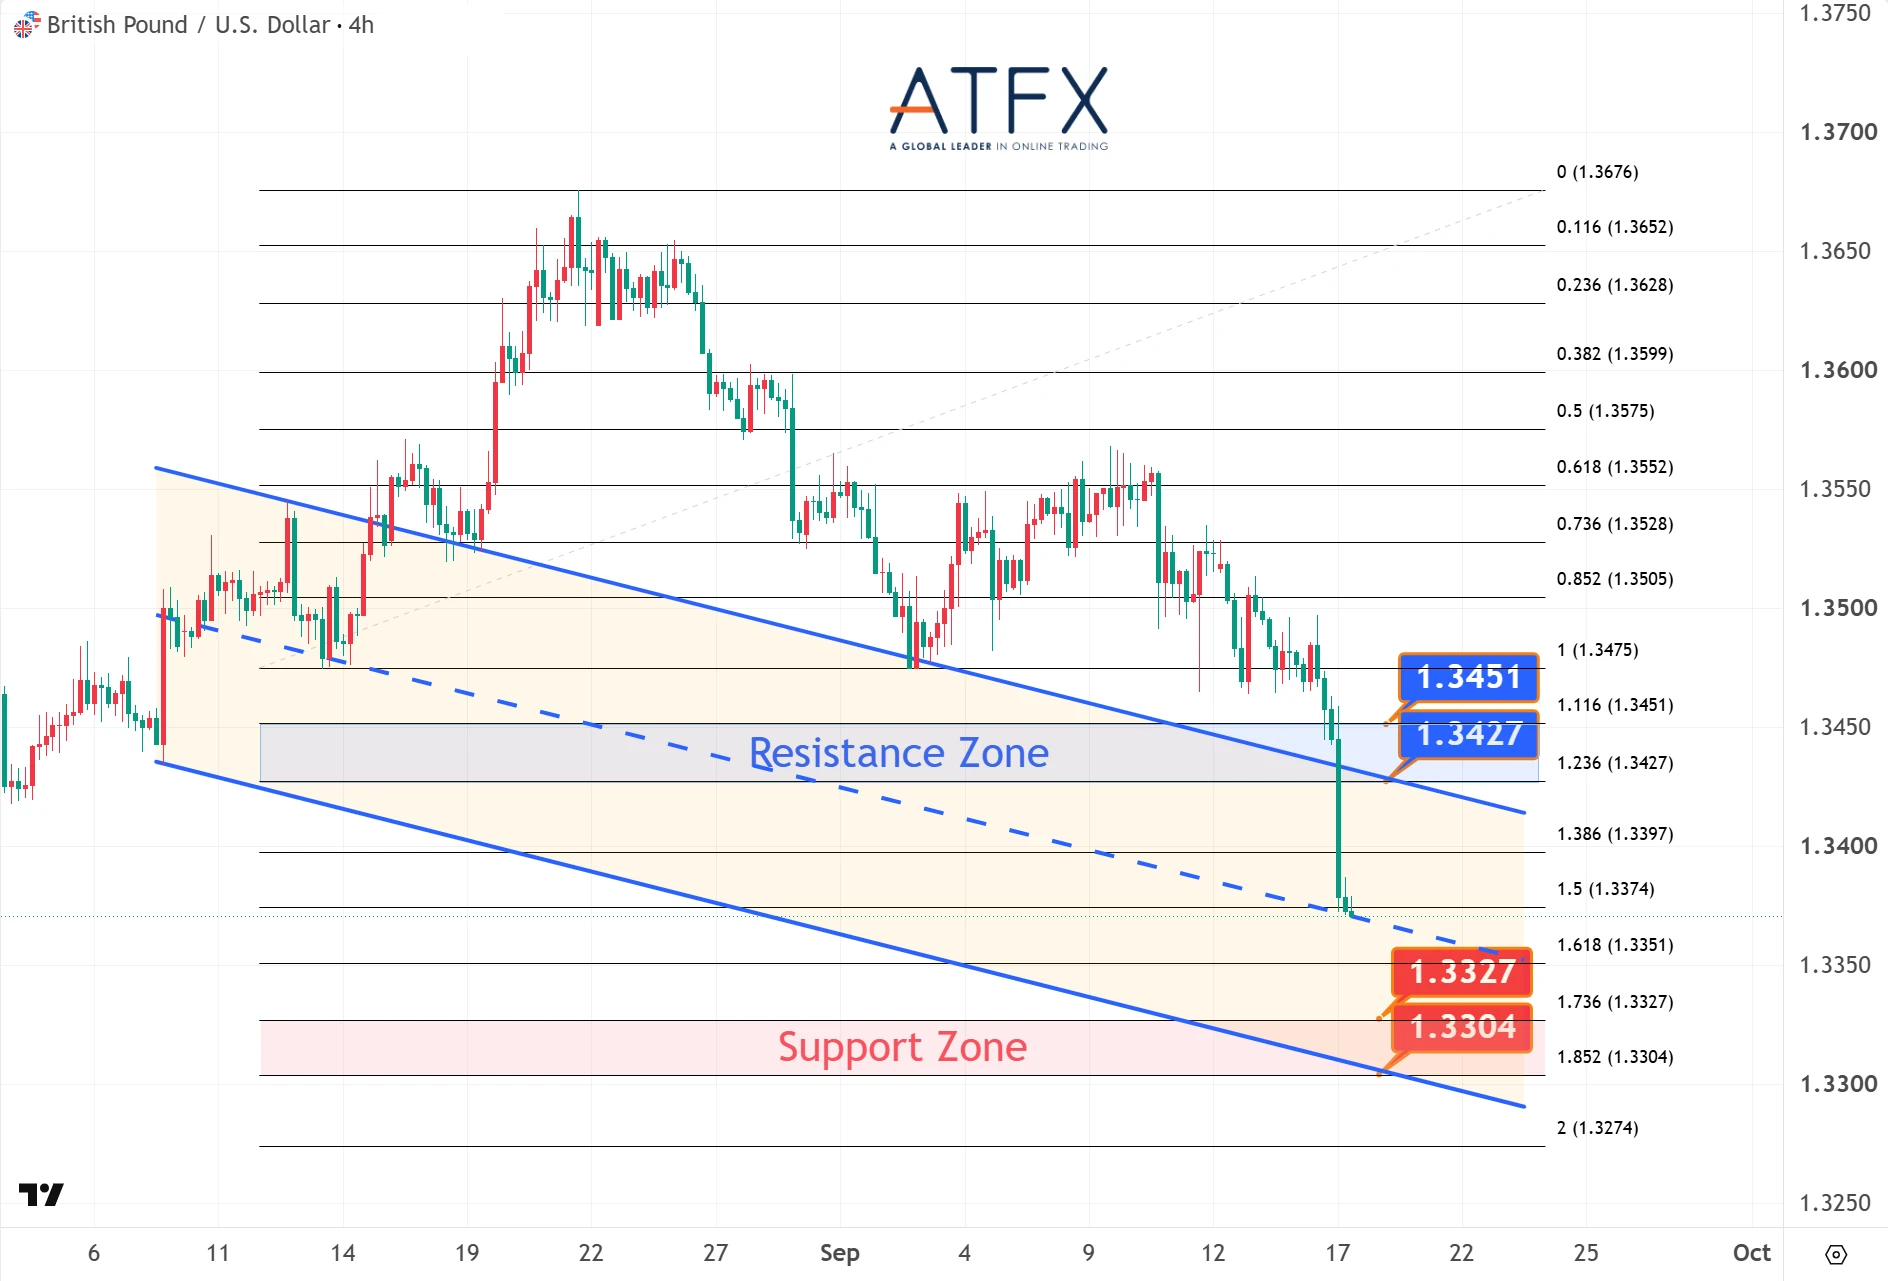
- Resistance: 1.3427 / 1.3451
- Support: 1.3327 / 1.3304
Sterling remains near multi-week lows, with U.S. dollar strength prevailing ahead of the Bank of England policy meeting.
Analyst View: After its sharpest decline since June, the 1.3400 region has become an important resistance level. The BoE statement is likely to determine the pair’s next directional move.
Bias: Bearish
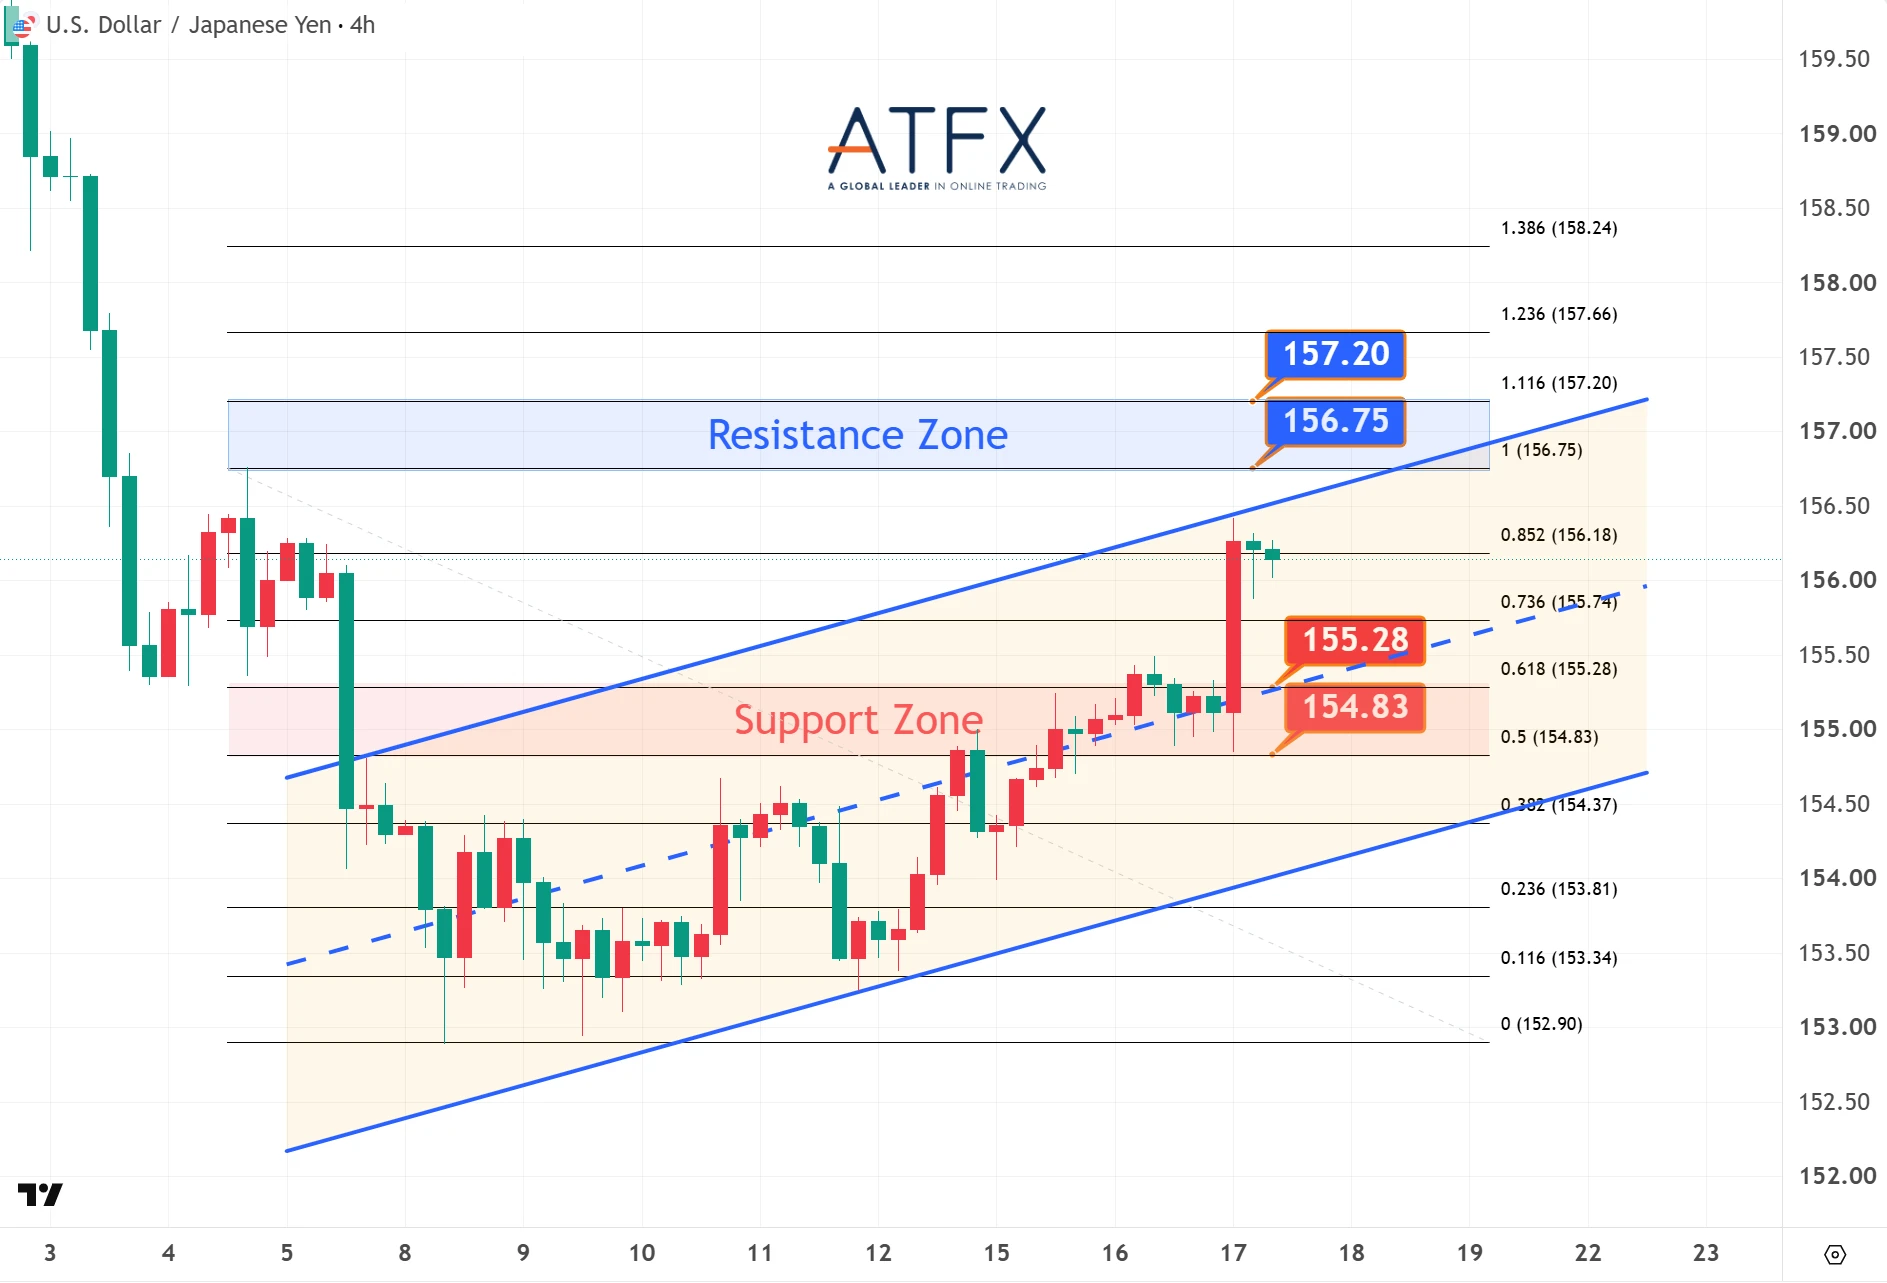
- Resistance: 156.75 / 157.20
- Support: 155.28 / 154.83
USD/JPY advanced for a third straight session after the Fed decision, with attention now shifting to the BoJ meeting.
Analyst View: Momentum remains constructive after the pair held above its 10-day moving average. A test of 156.90 is possible, although gains could be capped ahead of the BoJ announcement.
Bias: Short-Term Bullish
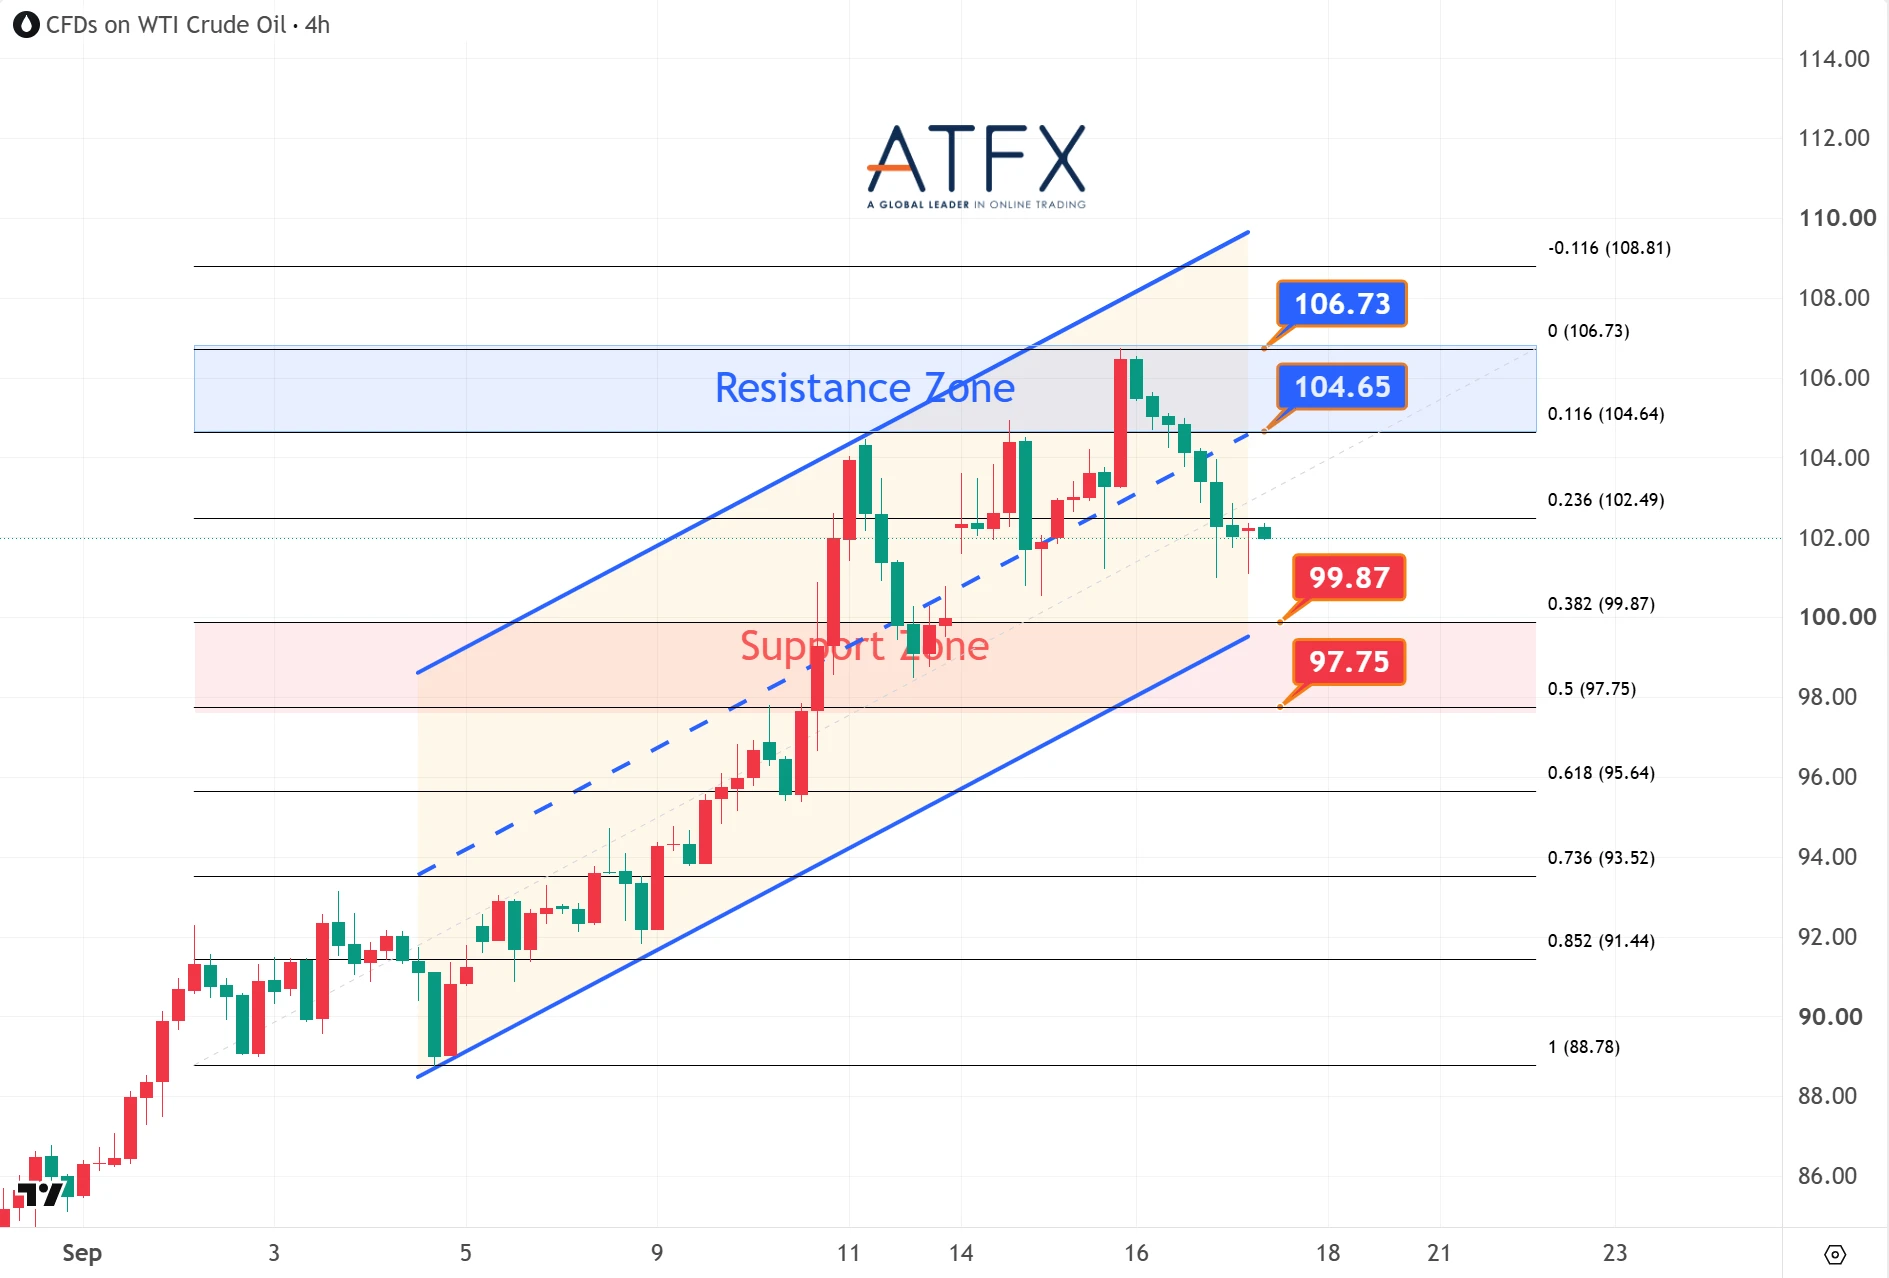
- Resistance: 104.65 / 106.73
- Support: 99.87 / 97.75
Oil prices moderated amid reports of increased Saudi supply and a smaller-than-expected drawdown in U.S. crude inventories.
Analyst View: The pullback suggests some moderation in bullish momentum. As long as prices remain above support near the 10-day moving average around $98.90, the broader trend remains constructive.
Bias: High-Level Consolidation
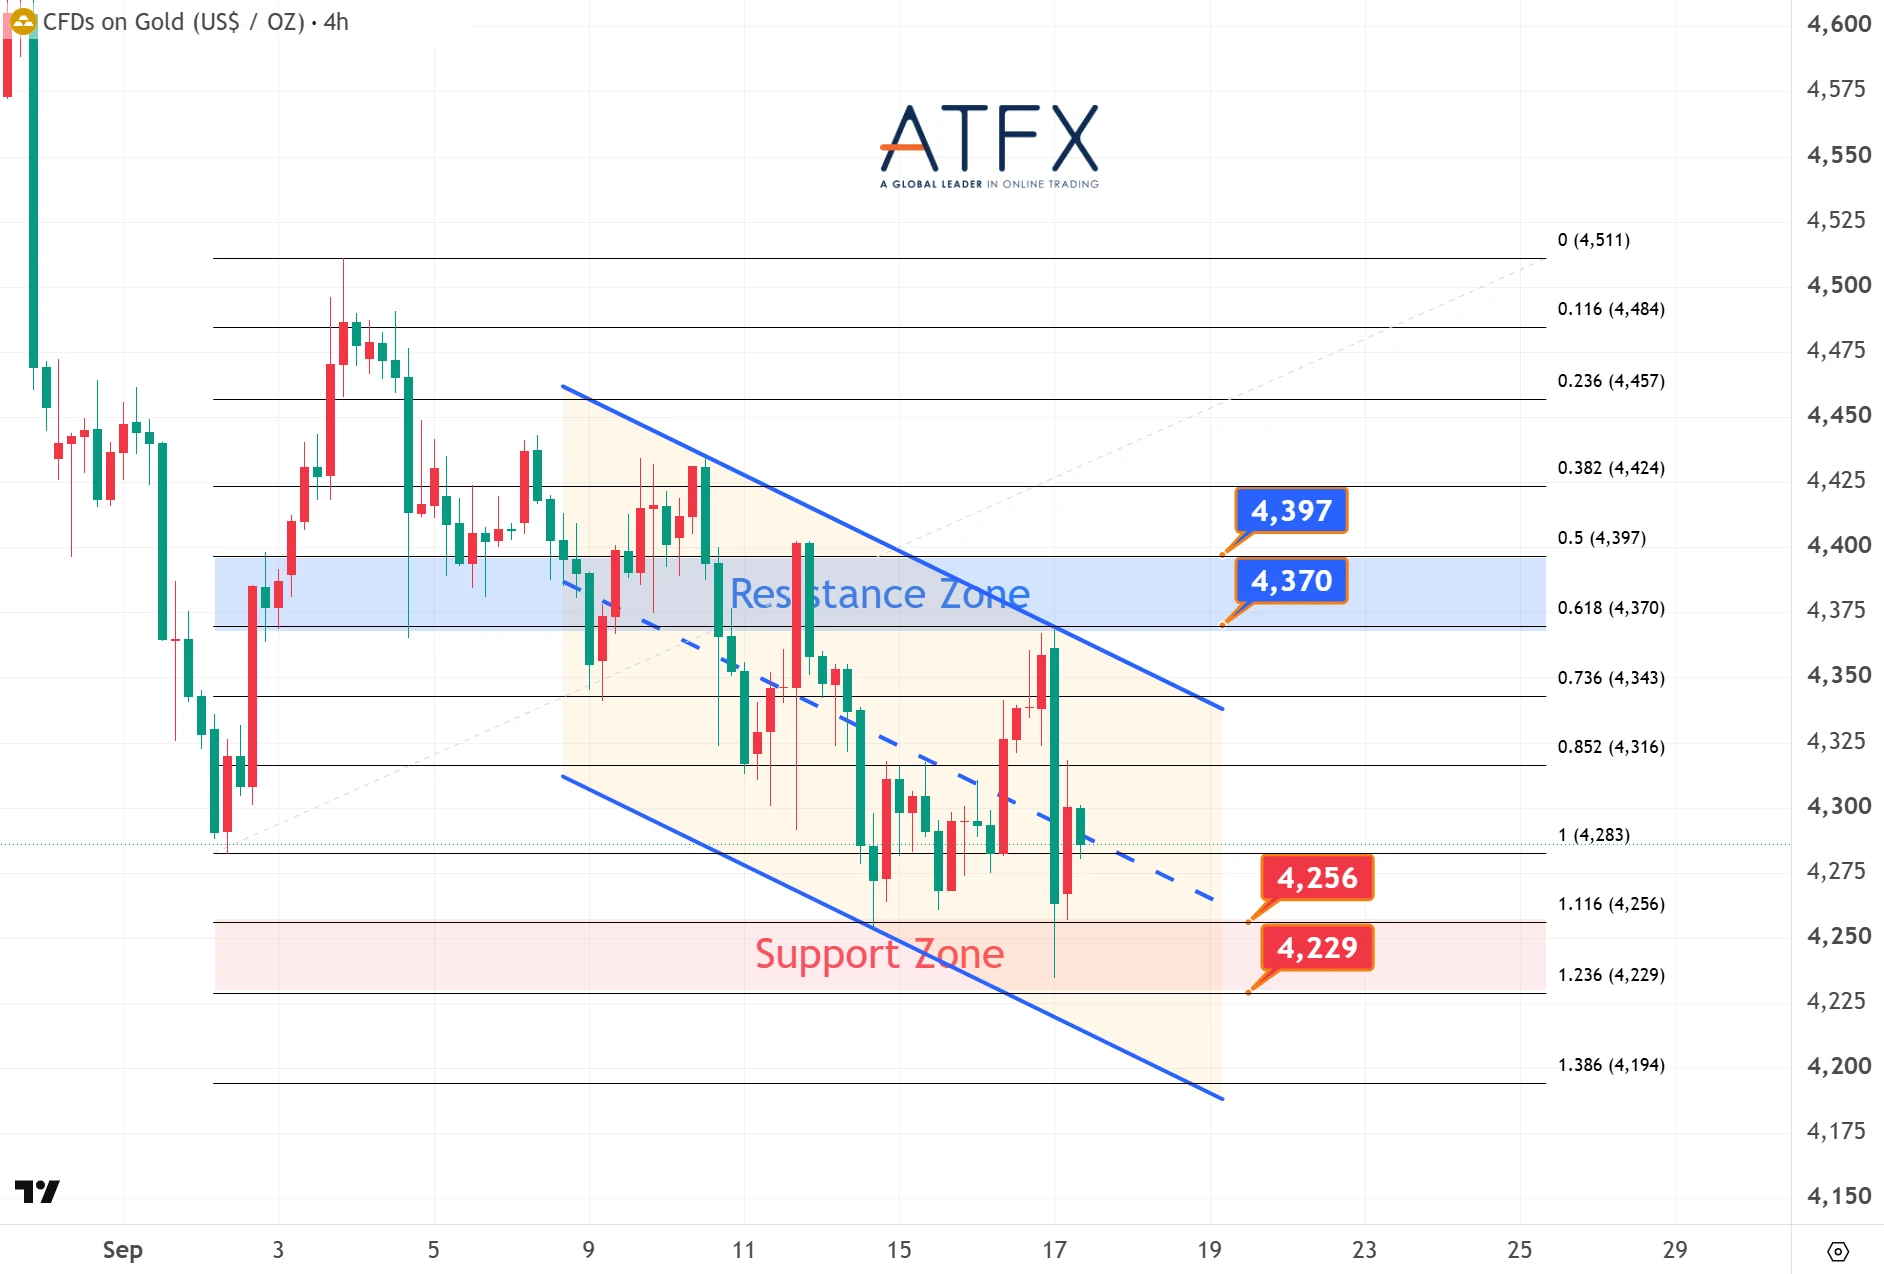
- Resistance: 4370 / 4397
- Support: 4256 / 4229
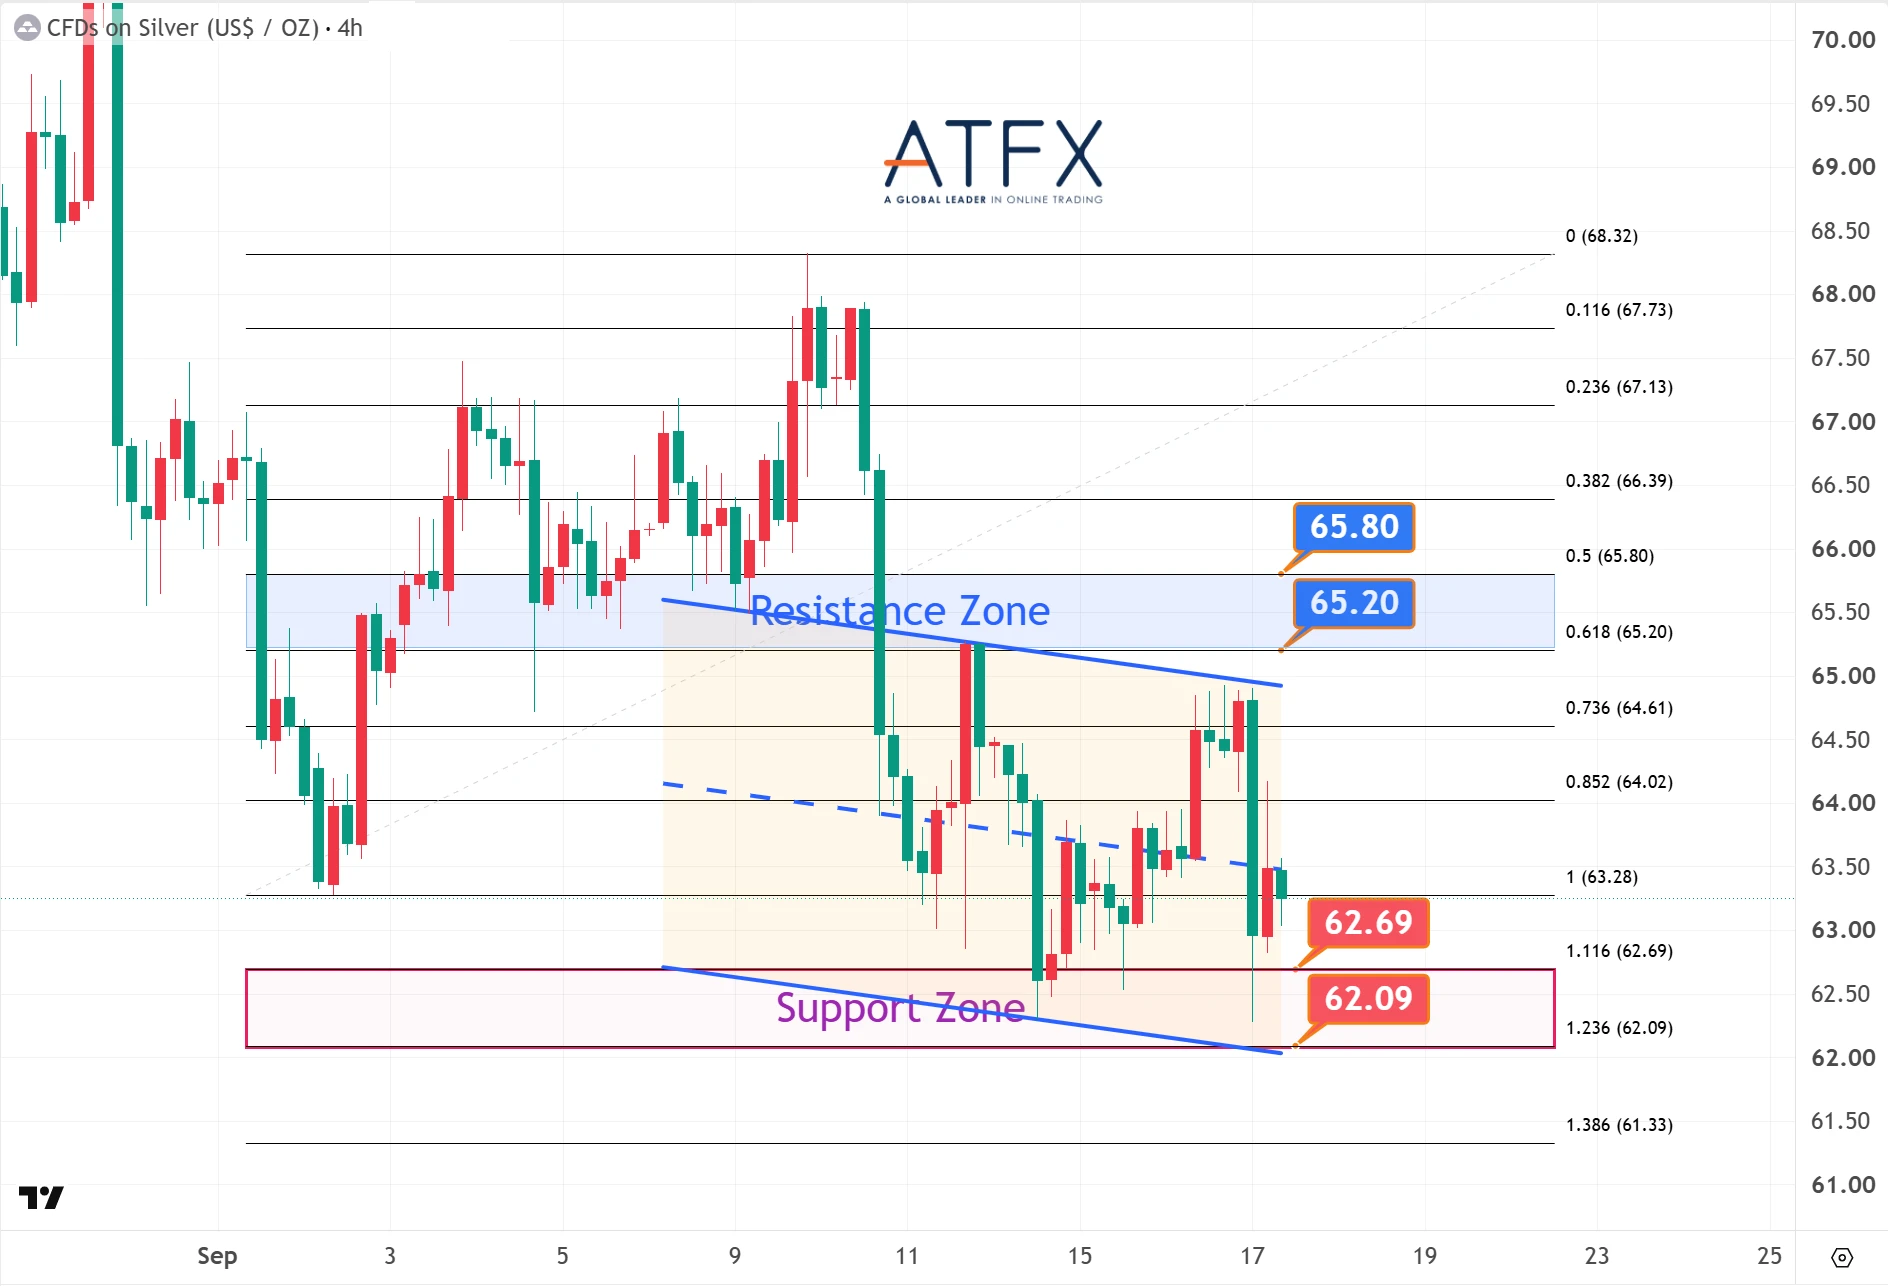
- Resistance: 65.20 / 65.80
- Support: 62.69 / 62.09
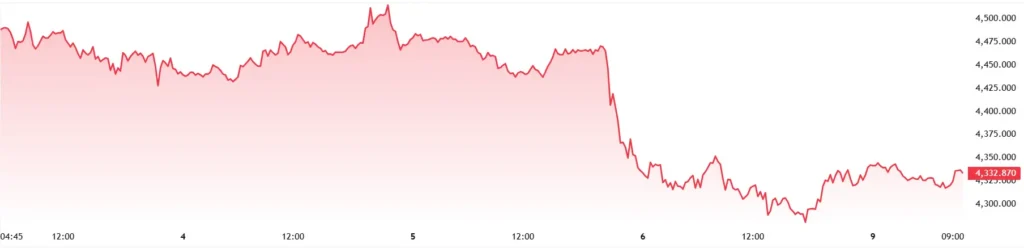
Gold experienced renewed pressure following the Federal Reserve’s reaffirmation of its tightening stance, although a modest rebound has occurred in Asian trading hours.
Analyst View: The rebound is testing resistance around $4,340 after yesterday’s volatile session. A sustained break above this area is needed to improve the near-term outlook.
Bias: Mild Recovery
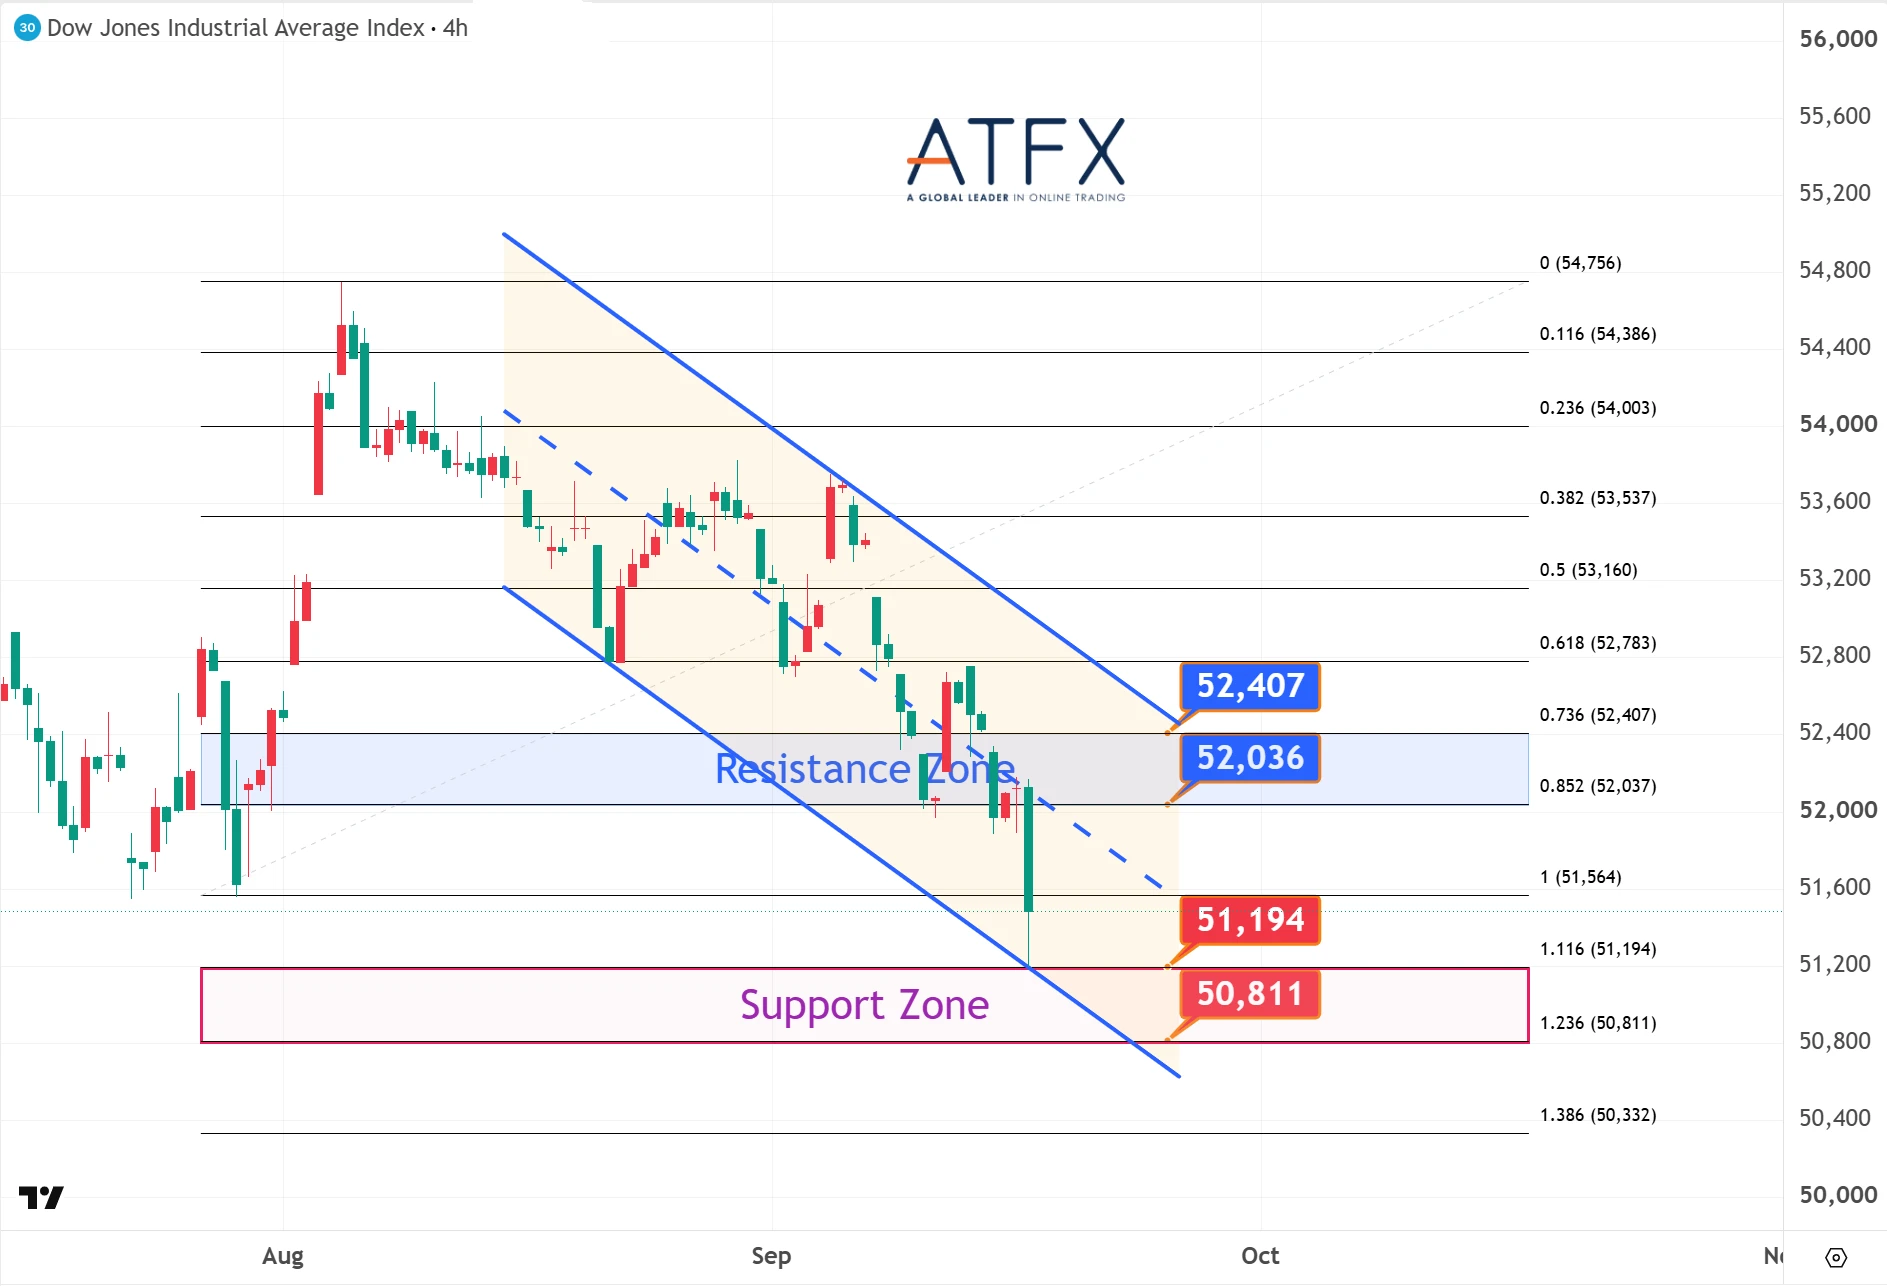
- Resistance: 52,036 / 52,407
- Support: 51,194 / 50,811
The Dow Jones underperformed relative to other major U.S. indices as Federal Reserve communications signaled that policy tightening may continue.
Analyst View: Following its steepest decline in nearly a month, bargain-hunting could help stabilise sentiment and limit further downside pressure in the near term.
Bias: Selling Pressure Easing
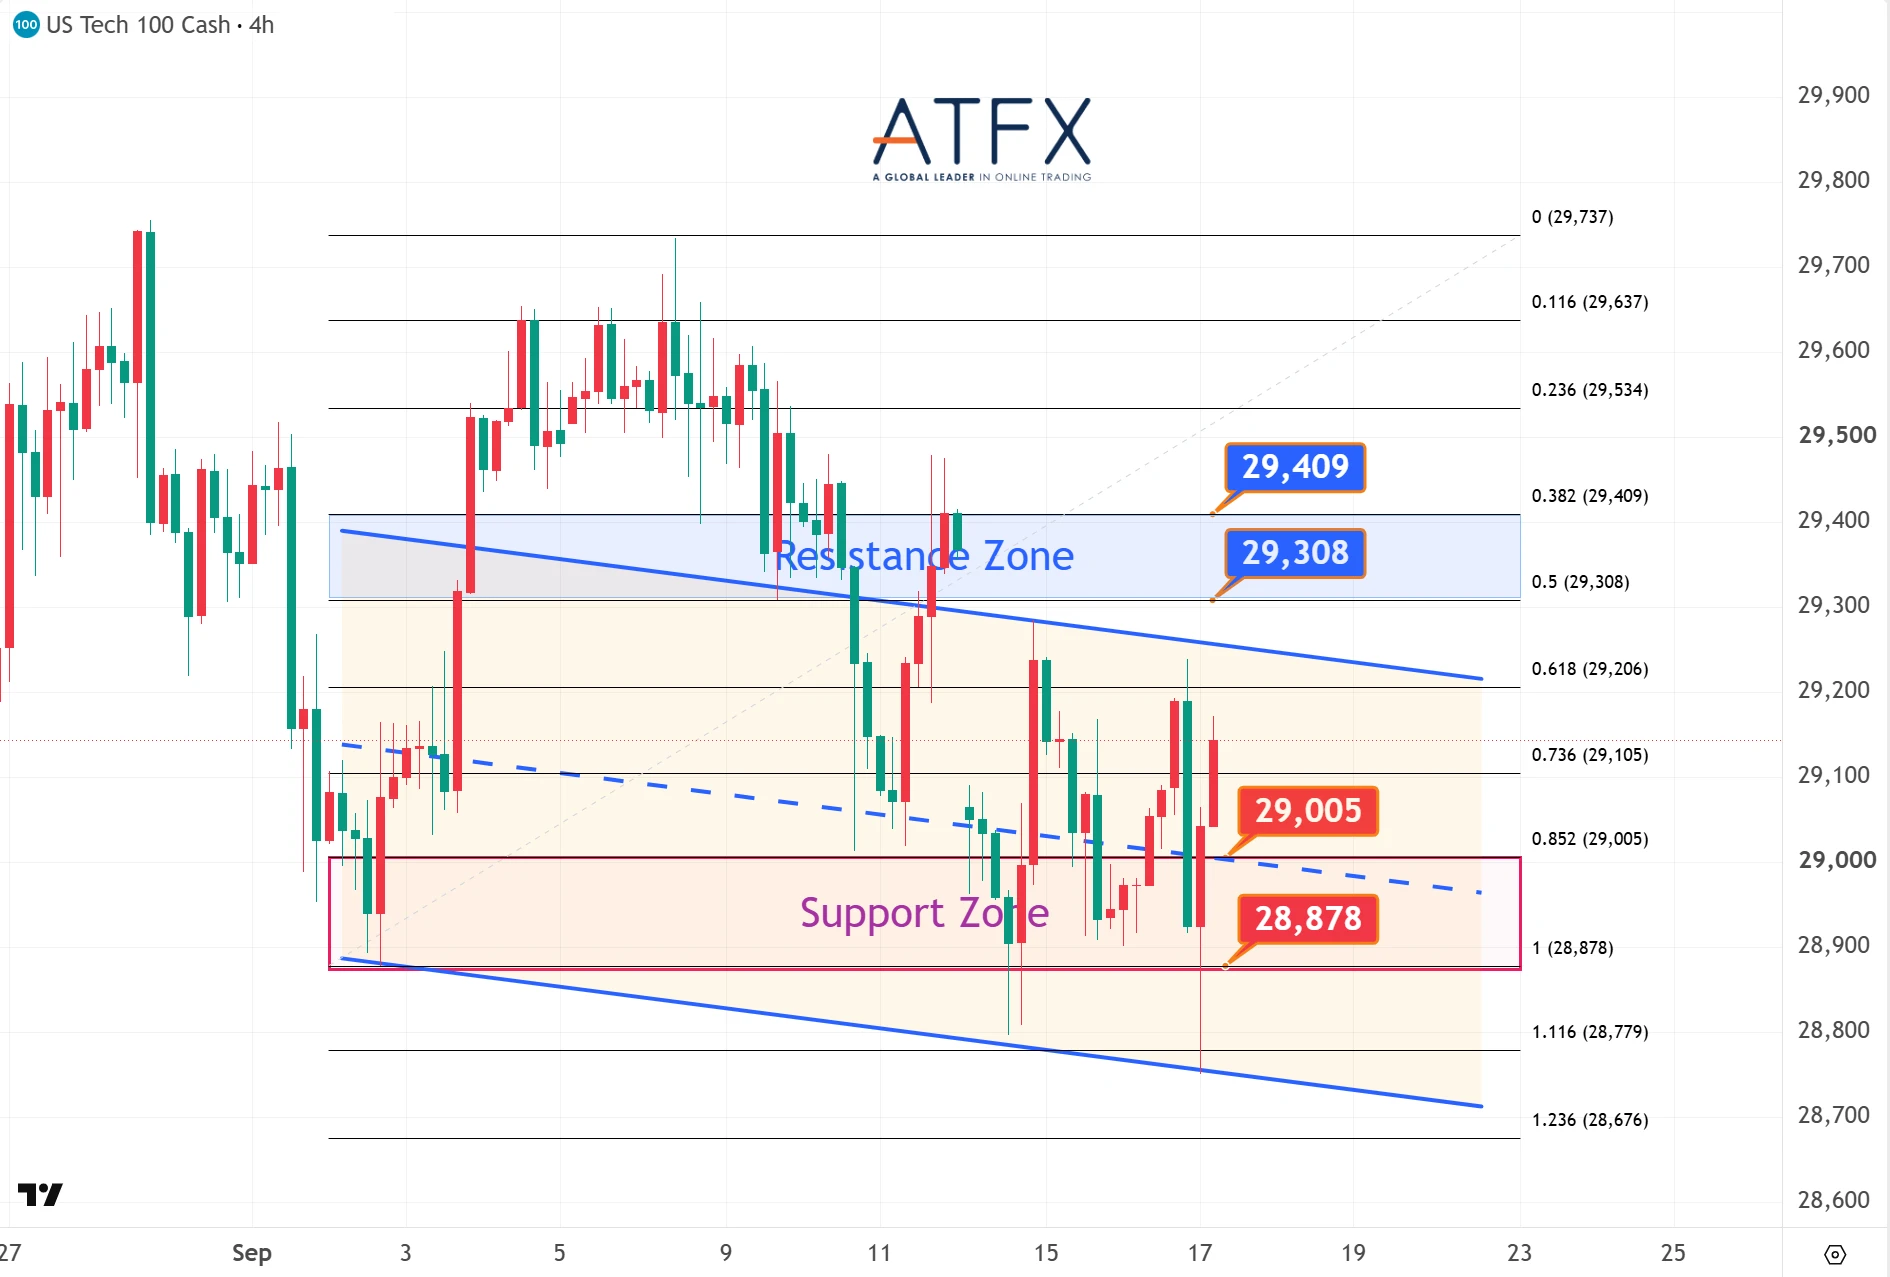
- Resistance: 29,308 / 29,409
- Support: 29,005 / 28,878
Large-cap technology stocks provided relative resilience for the Nasdaq, mitigating losses despite the Federal Reserve’s hawkish communications.
Analyst View: Support emerged near early-August lows. A recovery above 29,000 is possible, although resistance around 29,300 remains a key hurdle.
Bias: Selling Pressure Easing
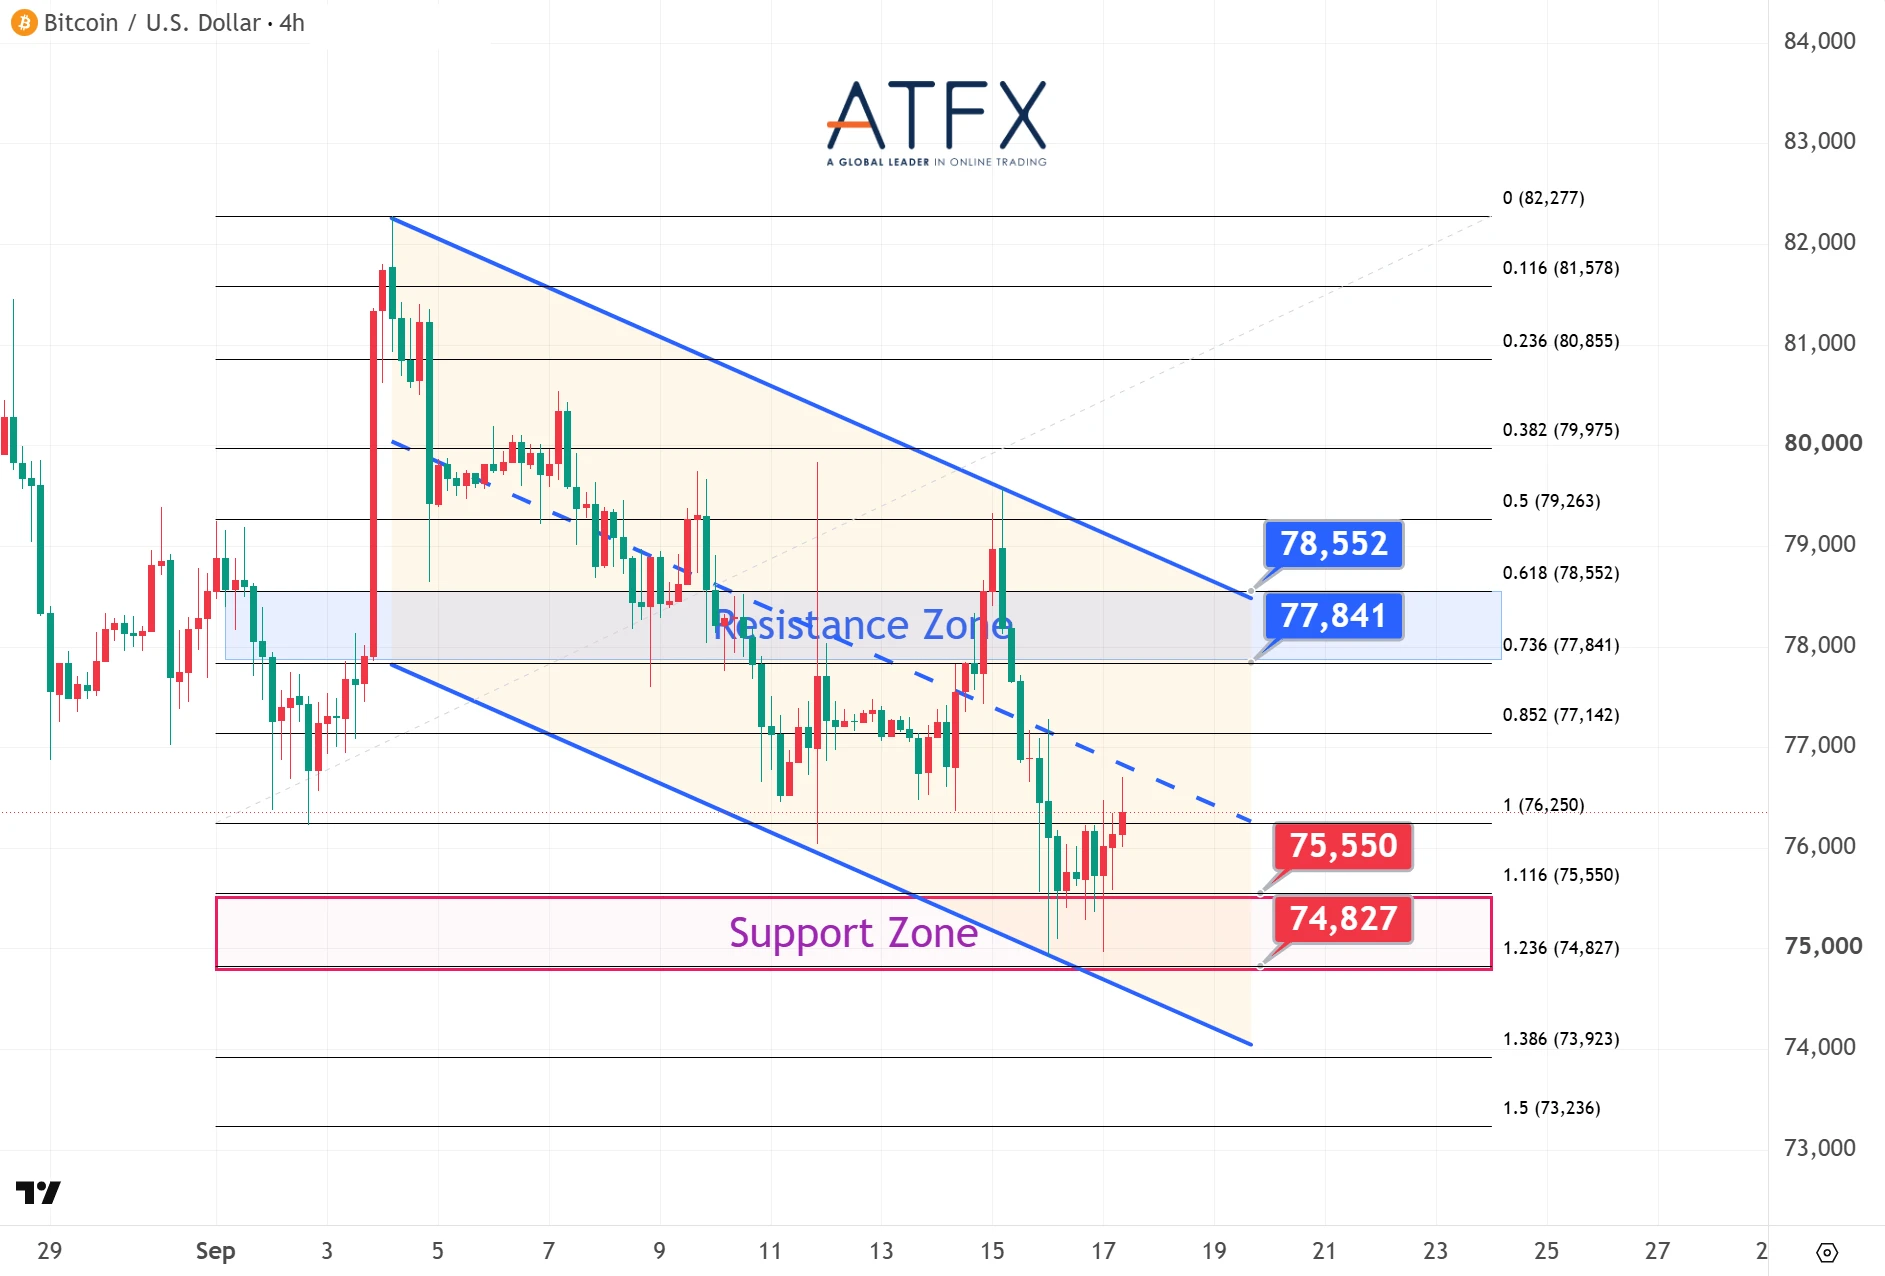
- Resistance: 77,841 / 78,552
- Support: 75,550 / 74,827
Bitcoin remains near a three-week low, weighed down by the Federal Reserve’s rate hike and persistent macroeconomic and regulatory pressures.
Analyst View: The 10-day moving average near $77,000 remains the key resistance level. Unless it breaks decisively, BTC is likely to remain in consolidation.
Bias: Mild Recovery
Enjoy trading! The content is for reference only. Please ensure that you understand the risk.