


Key Takeaways
Next week brings the US midterms, RBA and BoE decisions, and payrolls. Policy expectations face new tests as technology earnings pressure equities and gold tests $4,000. Today’s Focus: Following the BoJ’s expected hold, attention turns to Governor Kazuo Ueda’s briefing around 15:30 Japan time, or 14:30 GMT+8. Investors will assess whether he signals a December hike and how quickly policy could tighten thereafter. Germany’s GDP and CPI, euro area GDP and Canadian GDP follow later. The US Employment Cost Index at 20:30 adds a wage-pressure test. Australia’s released PPI rose 1.1% quarter on quarter and 3.6% year on year. |
Global Market Review 30/10/2026
- Thursday, October 29: the Dow fell 0.25% to 52,342.56; the S&P 500 lost 0.30% to 7,720.39; and the Nasdaq Composite declined 1.38% to 26,184.72.
- Technology led losses, while broader market breadth was firmer.
- Nasdaq futures subsequently fell about 2% after Amazon and Intel results.
- Reference quotes showed the 2-year Treasury yield at 4.598%, Brent at $115.50, WTI at $102.89 and gold at $4,020.42.
- Later Friday reporting put the Dollar Index near 101.77 and the 10-year yield near 4.90%.
- The supplied 10:21 charts showed gold near $3,998 and Bitcoin near $76,858.
Economic Calendar
Key Events on October 30 (GMT+8)
| Time (GMT+8) | Event | Importance |
|---|---|---|
| 08:30 | AU PPI QoQ Q3 | ** |
| BoJ Rate Decision and Quarterly Outlook (Bank’s View) | *** | |
| 14:30 | BoJ Press Conference | *** |
| 17:00 | Germany GDP QoQ Flash Q3 | *** |
| 18:00 | Euro Area GDP QoQ Flash Q3 | *** |
| 20:30 | Canada GDP MoM AUG | ** |
| 20:30 | US Employment Cost Index QoQ Q3 | *** |
| 21:00 | Germany CPI YoY Preliminary OCT | ** |
Key Data and Events Next Week | November 2–6 (GMT+8)
- Monday: Germany retail sales; US ISM manufacturing PMI; BoJ Outlook full text.
- Tuesday: Japan Culture Day holiday; US midterm elections; RBA decision and press conference; US JOLTs job openings and factory orders.
- Wednesday: API inventories; euro area CPI; US ADP employment, trade balance and ISM services PMI; EIA inventories.
- Thursday: BoJ September meeting minutes; US jobless claims; euro area PPI; BoE decision, minutes and Monetary Policy Report.
- Friday: Germany industrial production; euro area retail sales; US payrolls, unemployment and preliminary Michigan sentiment; Canadian unemployment.
- Also due during the week: final manufacturing, services and composite PMIs across major economies, including Japan, Australia, China, the euro area, the UK and the US.
- US daylight saving time ends November 1: 08:30 ET releases shift to 21:30 GMT+8. Election results may develop into November 4 in GMT+8.
- Four-hour chart prices may differ from cash closes and news quotes because of timing and instrument specifications.
Markets Analysis 30/10/2026
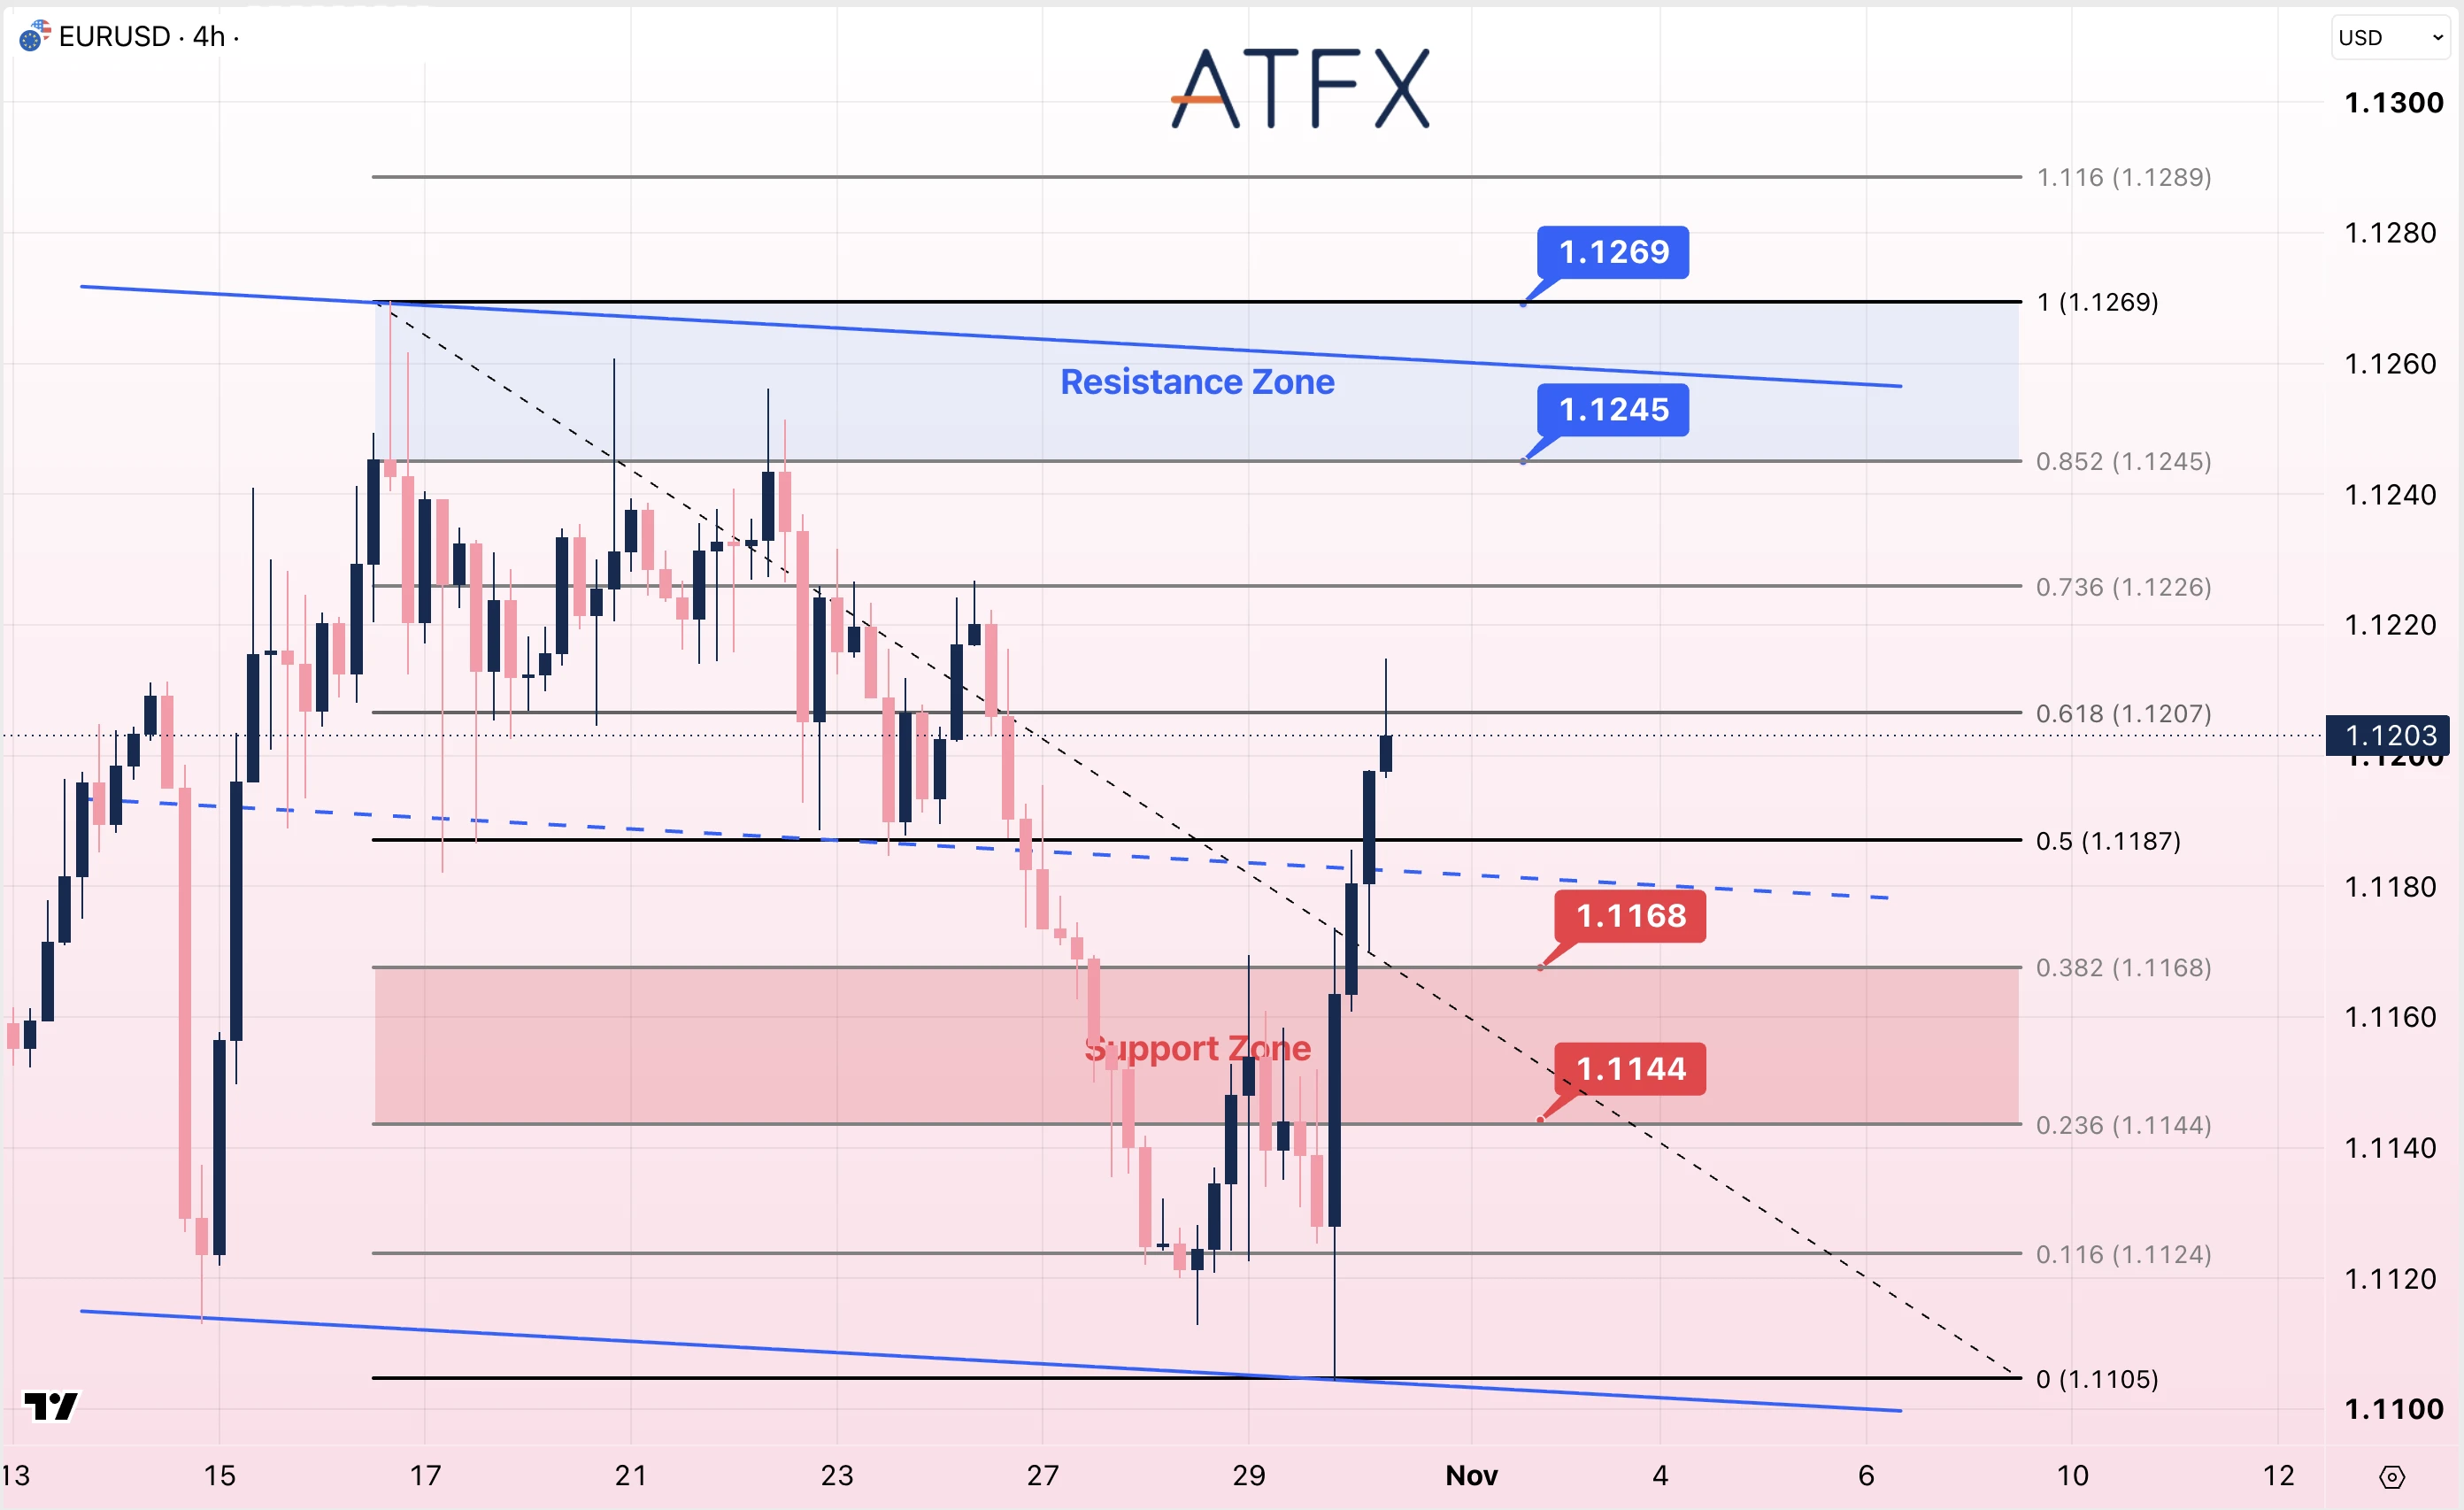
- Resistance: 1.1245/1.1269
- Support: 1.1168/1.1144
Analyst’s View: The ECB held its deposit rate at 2.50% and warned that higher energy costs could lift inflation while slowing growth. Today’s euro area GDP and German CPI will help assess that tension.
The Euro’s rebound also coincides with a softer Dollar and lower US yields. US headline PCE inflation rose to 3.6% year on year, however, keeping further Fed tightening relevant ahead of next week’s jobs data.
EUR/USD is near 1.1203 after rebounding from the 1.1105 area and reclaiming the descending channel’s midline. A move above 1.1207 would bring 1.1226 into focus, followed by the marked resistance at 1.1245 and 1.1269. Holding 1.1187 would help preserve the recovery.
Bias: Neutral to Cautiously Bullish
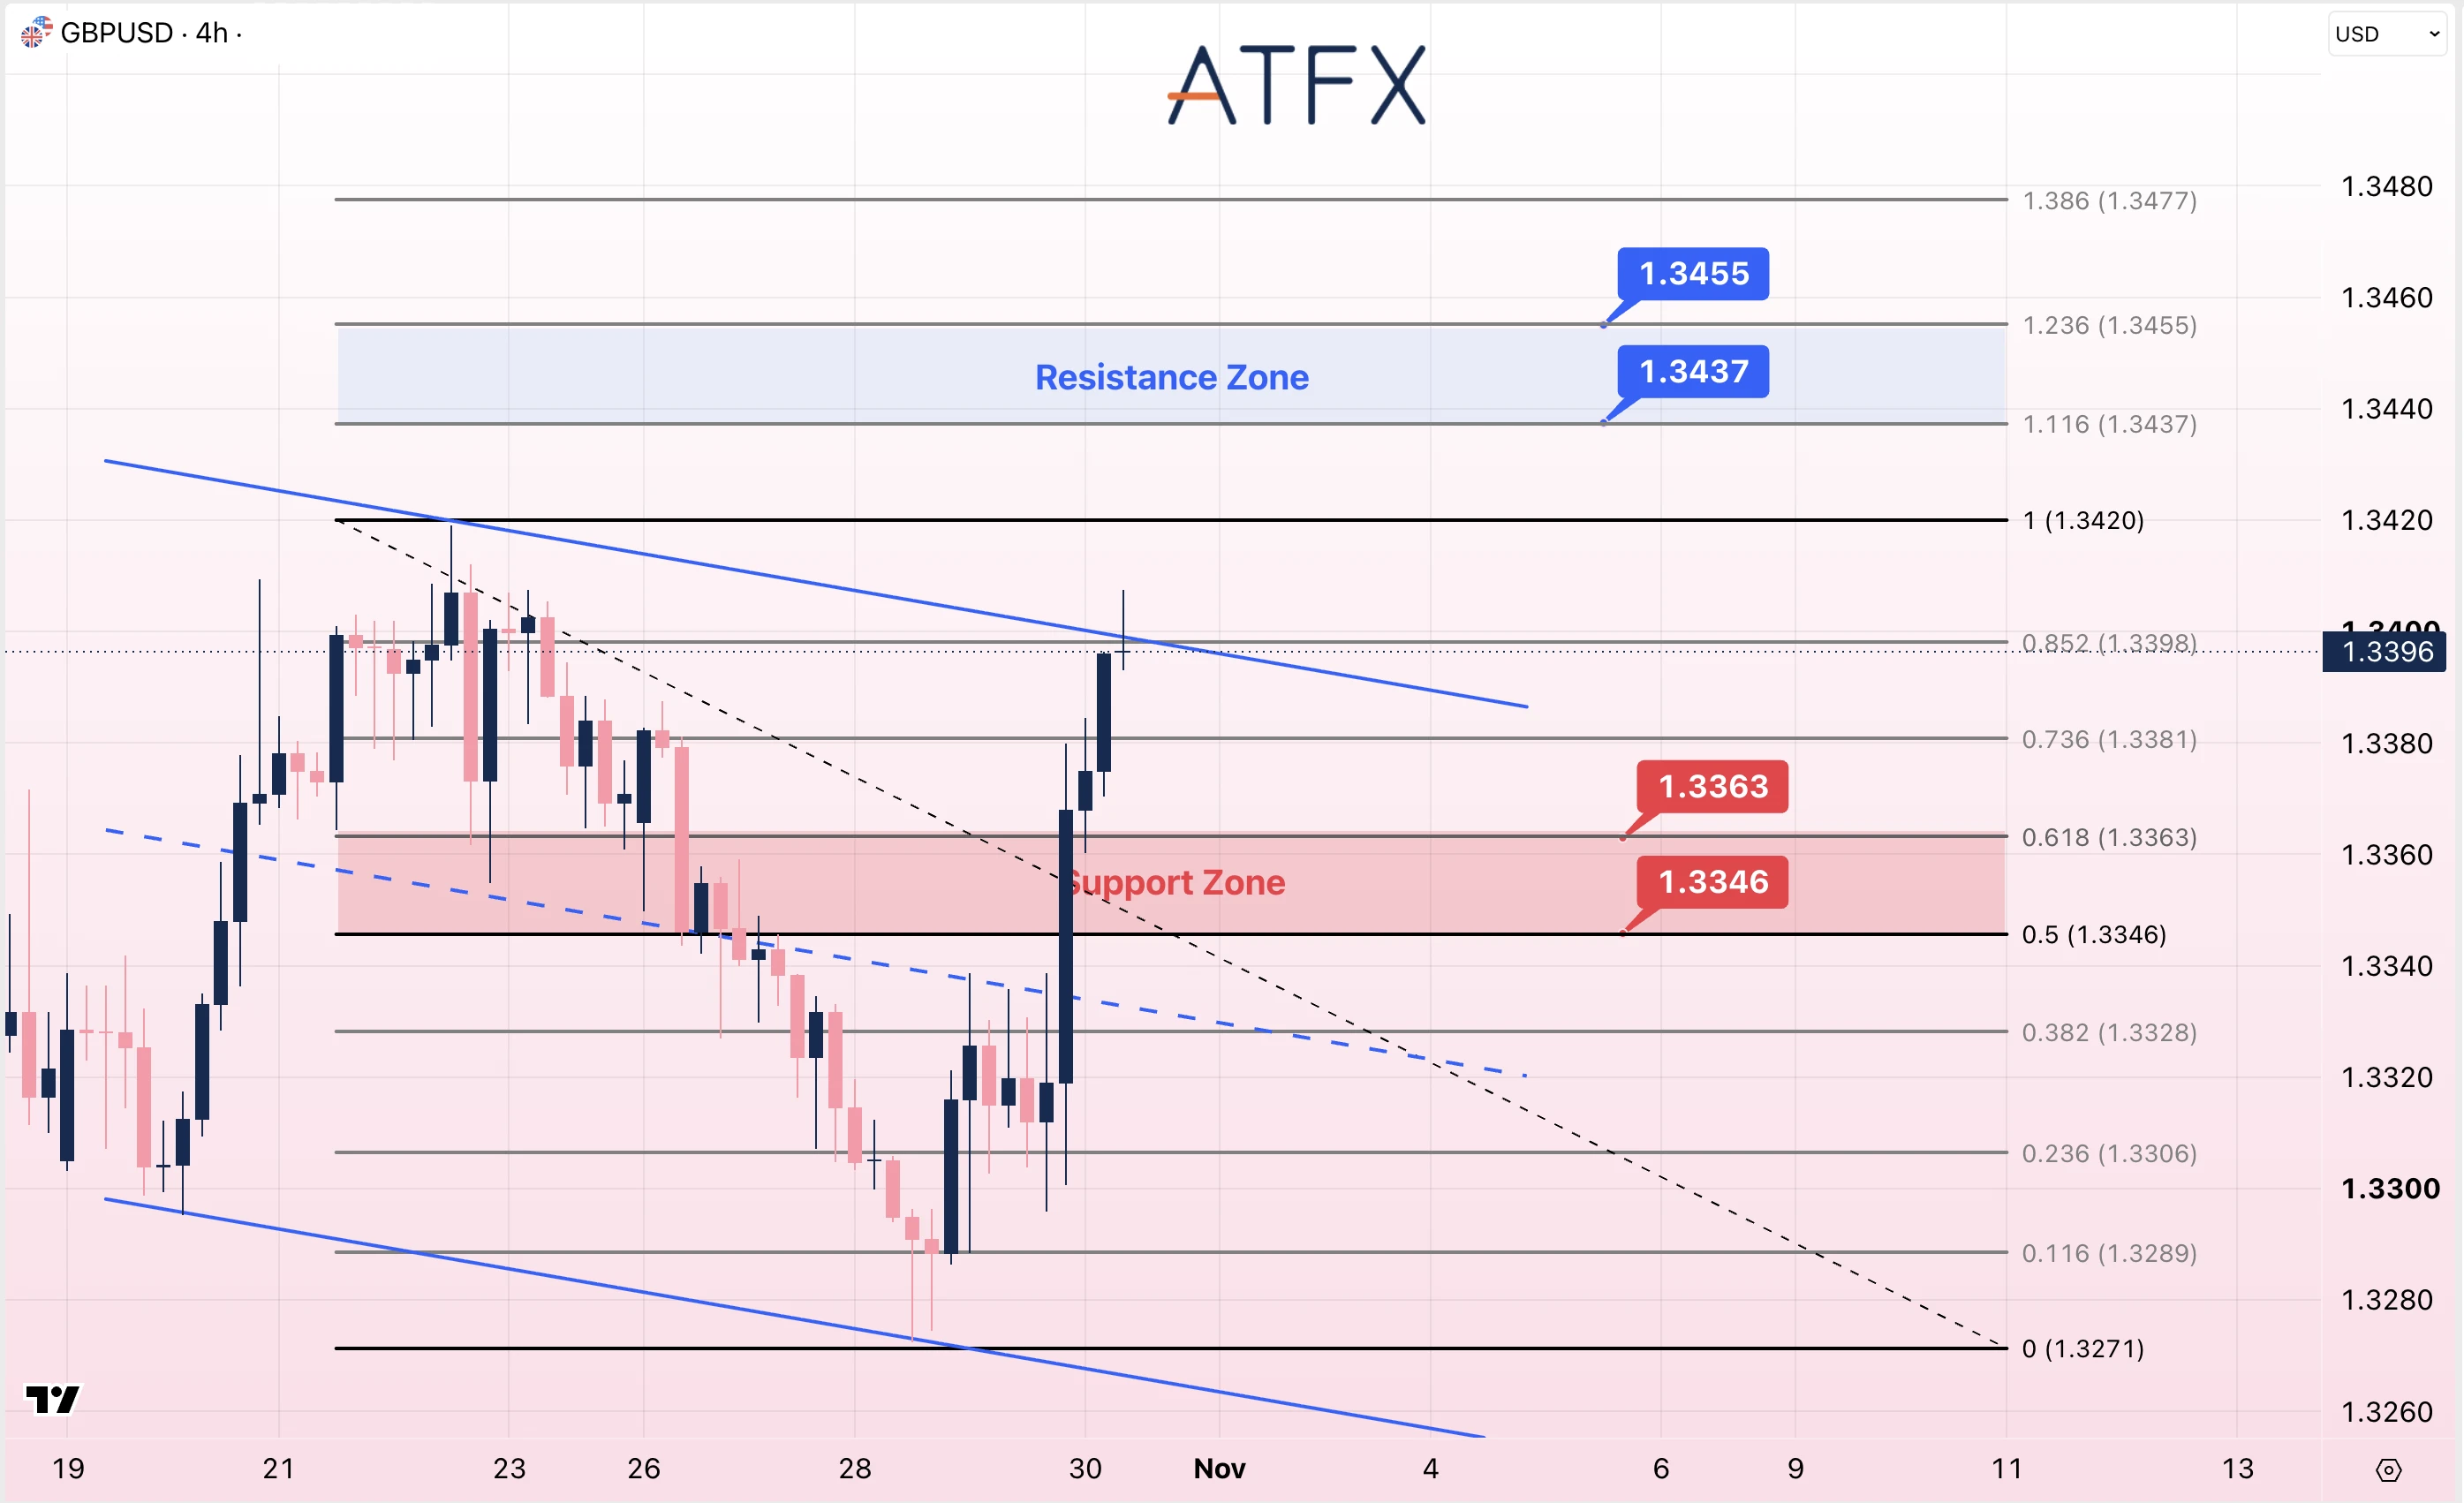
- Resistance: 1.3437/1.3455
- Support: 1.3363/1.3346
Analyst’s View: Sterling’s recovery is supported by a softer Dollar and expectations of a BoE hike on November 5. UK inflation at 3.5% keeps the tightening case in view, but the vote split and updated forecasts will shape expectations beyond that meeting.
Next week’s US employment data could change the relative rate outlook. A firm US labor market would leave the Fed with less reason to soften its inflation stance, potentially limiting further Pound gains.
GBP/USD is near 1.3396 after a sharp rebound from below 1.3300. Price is testing the descending channel’s upper boundary near 1.3398; a break above 1.3420 would strengthen the recovery toward 1.3437 and 1.3455.
Bias: Neutral to Cautiously Bullish
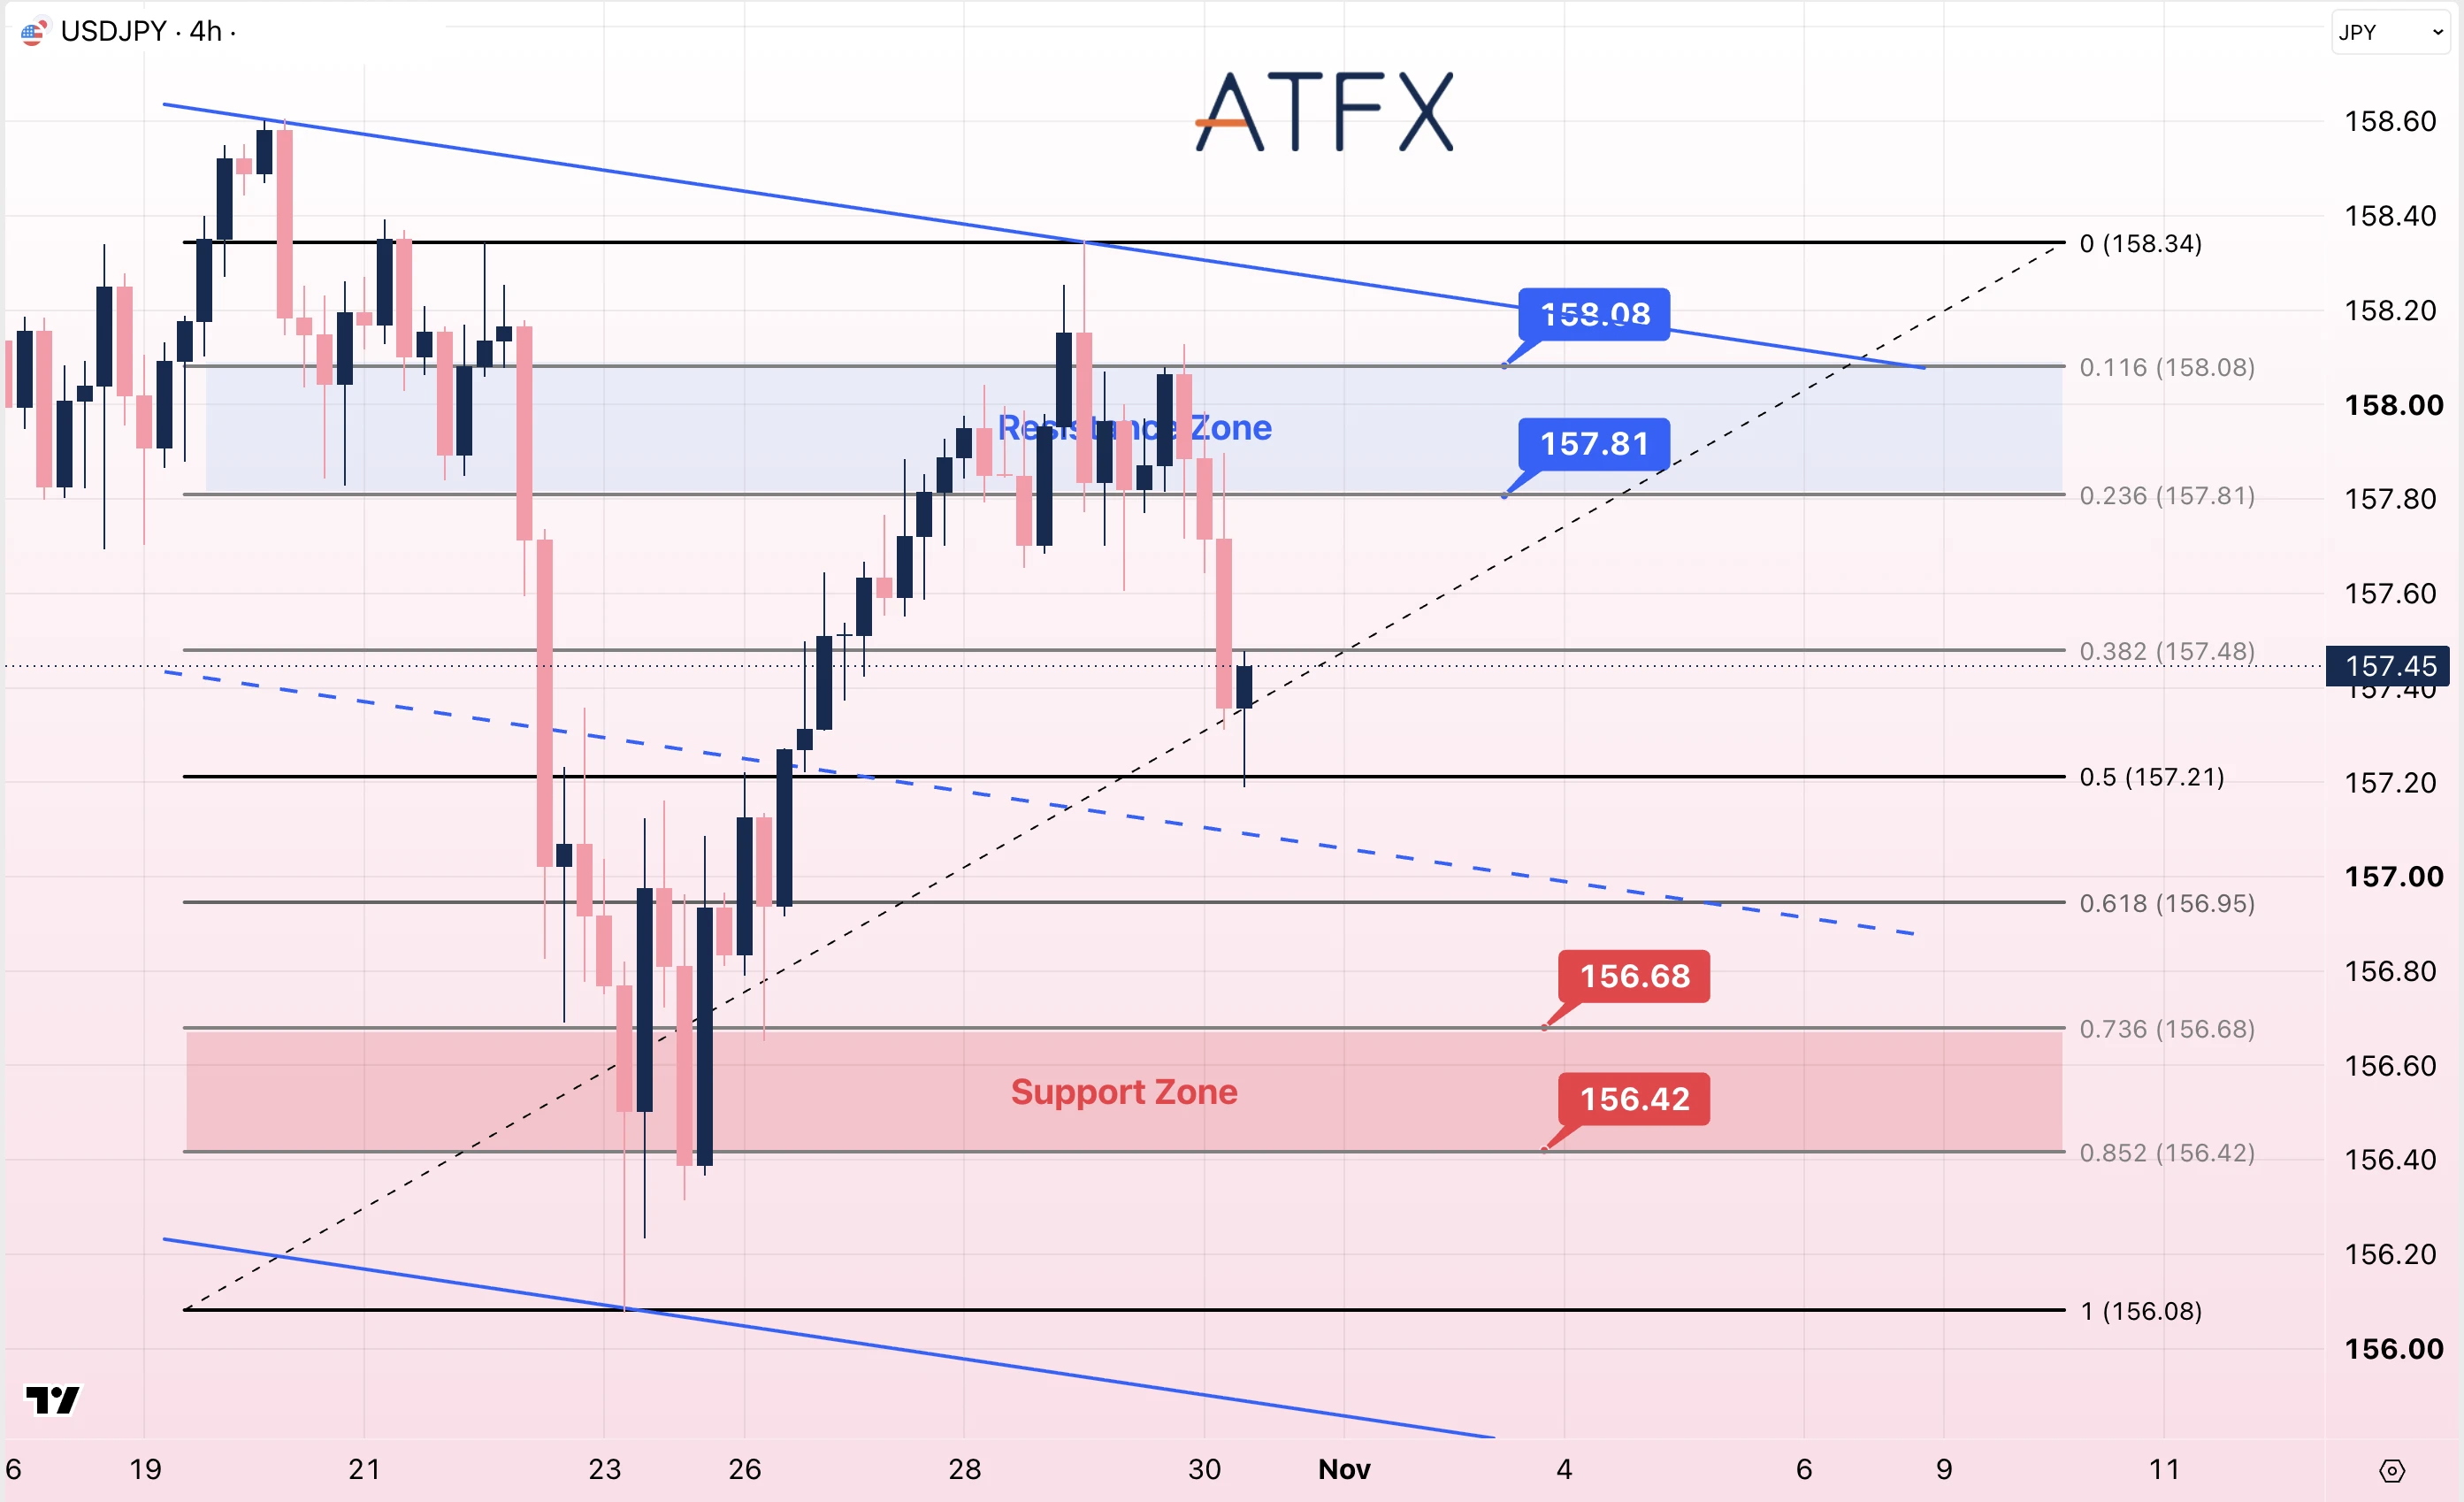
- Resistance: 157.81/158.08
- Support: 156.68/156.42
Analyst’s View: The BoJ held its benchmark rate at 1.25%, as expected, while judging that underlying inflation has reached its 2% target. That assessment strengthens the case for further tightening and leaves a December hike possible, without committing the bank to that timing.
Tokyo core CPI eased to 2.6% from 2.7%, but the BoJ’s underlying inflation assessment captures a broader price trend. Ueda’s briefing around 14:30 GMT+8 is now the focus: firmer guidance could support the Yen, while caution on timing could limit its gains.
USD/JPY is near 157.45 after retreating from the 158.08 area. It is just below 157.48, with intermediate support at 157.21 and 156.95; a break lower would bring 156.68 and 156.42 into focus.
A recovery to 157.48 would help stabilize the pair, but a sustained move through 157.81–158.08 is needed to improve the short-term picture within the descending channel.
Bias: Neutral to Cautiously Bearish
- Resistance: 103.00/104.00 (round-number references)
- Support: 100.00/99.00 (round-number references)
Analyst’s View: Oil remains caught between regional diplomacy and unresolved Middle East supply risks. Progress in talks involving Iran could reduce the risk premium, while further attacks on Saudi infrastructure or shipping could support prices.
Next week’s US midterms add headline risk, but reported scenarios for subsequent military action remain uncertain. ISM surveys, US employment data and inventory reports will also help assess demand against those supply concerns.
Morning news quotes put WTI around $102, following the $102.89 reference quote. The whole-dollar levels above are price references: holding above $100 would preserve scope to retest $103, with $104 relevant if that move extends.
A sustained move below $100 would instead bring $99 into focus and suggest that diplomatic relief or demand concerns are outweighing supply risk. The near-term bias remains neutral while these competing factors persist.
Bias: Neutral
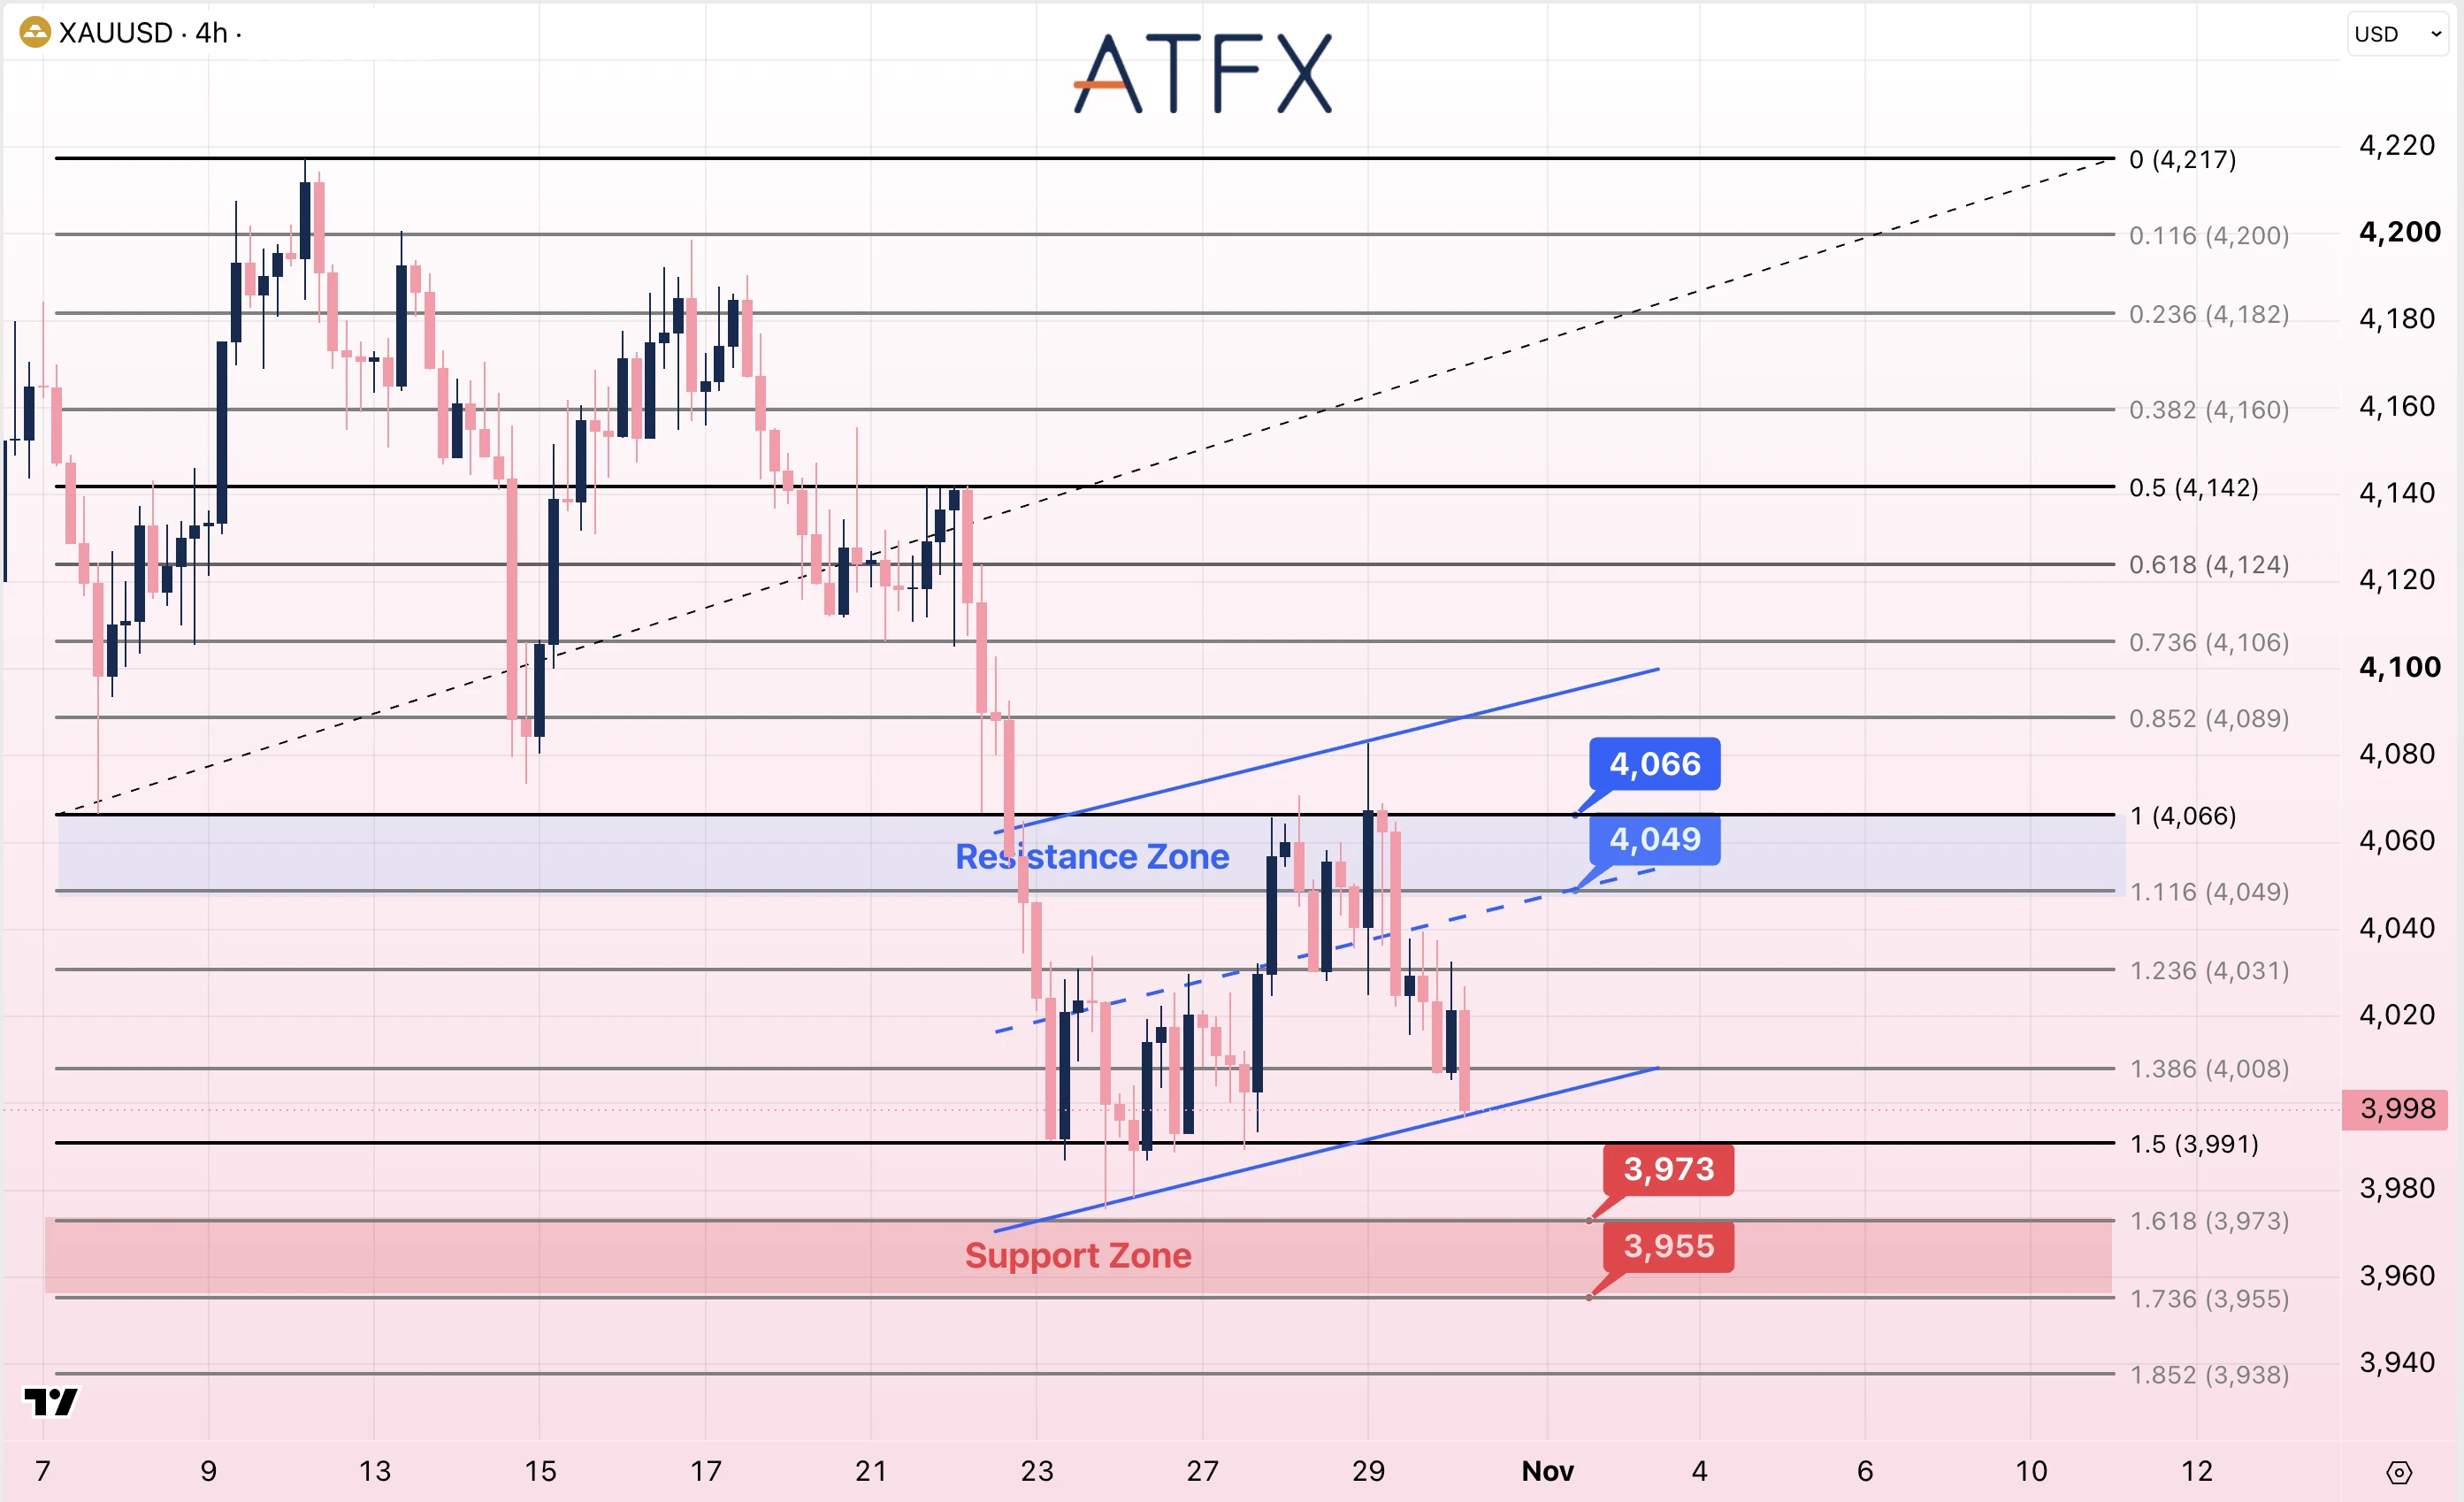
- Resistance: 4049/4066
- Support: 3973/3955
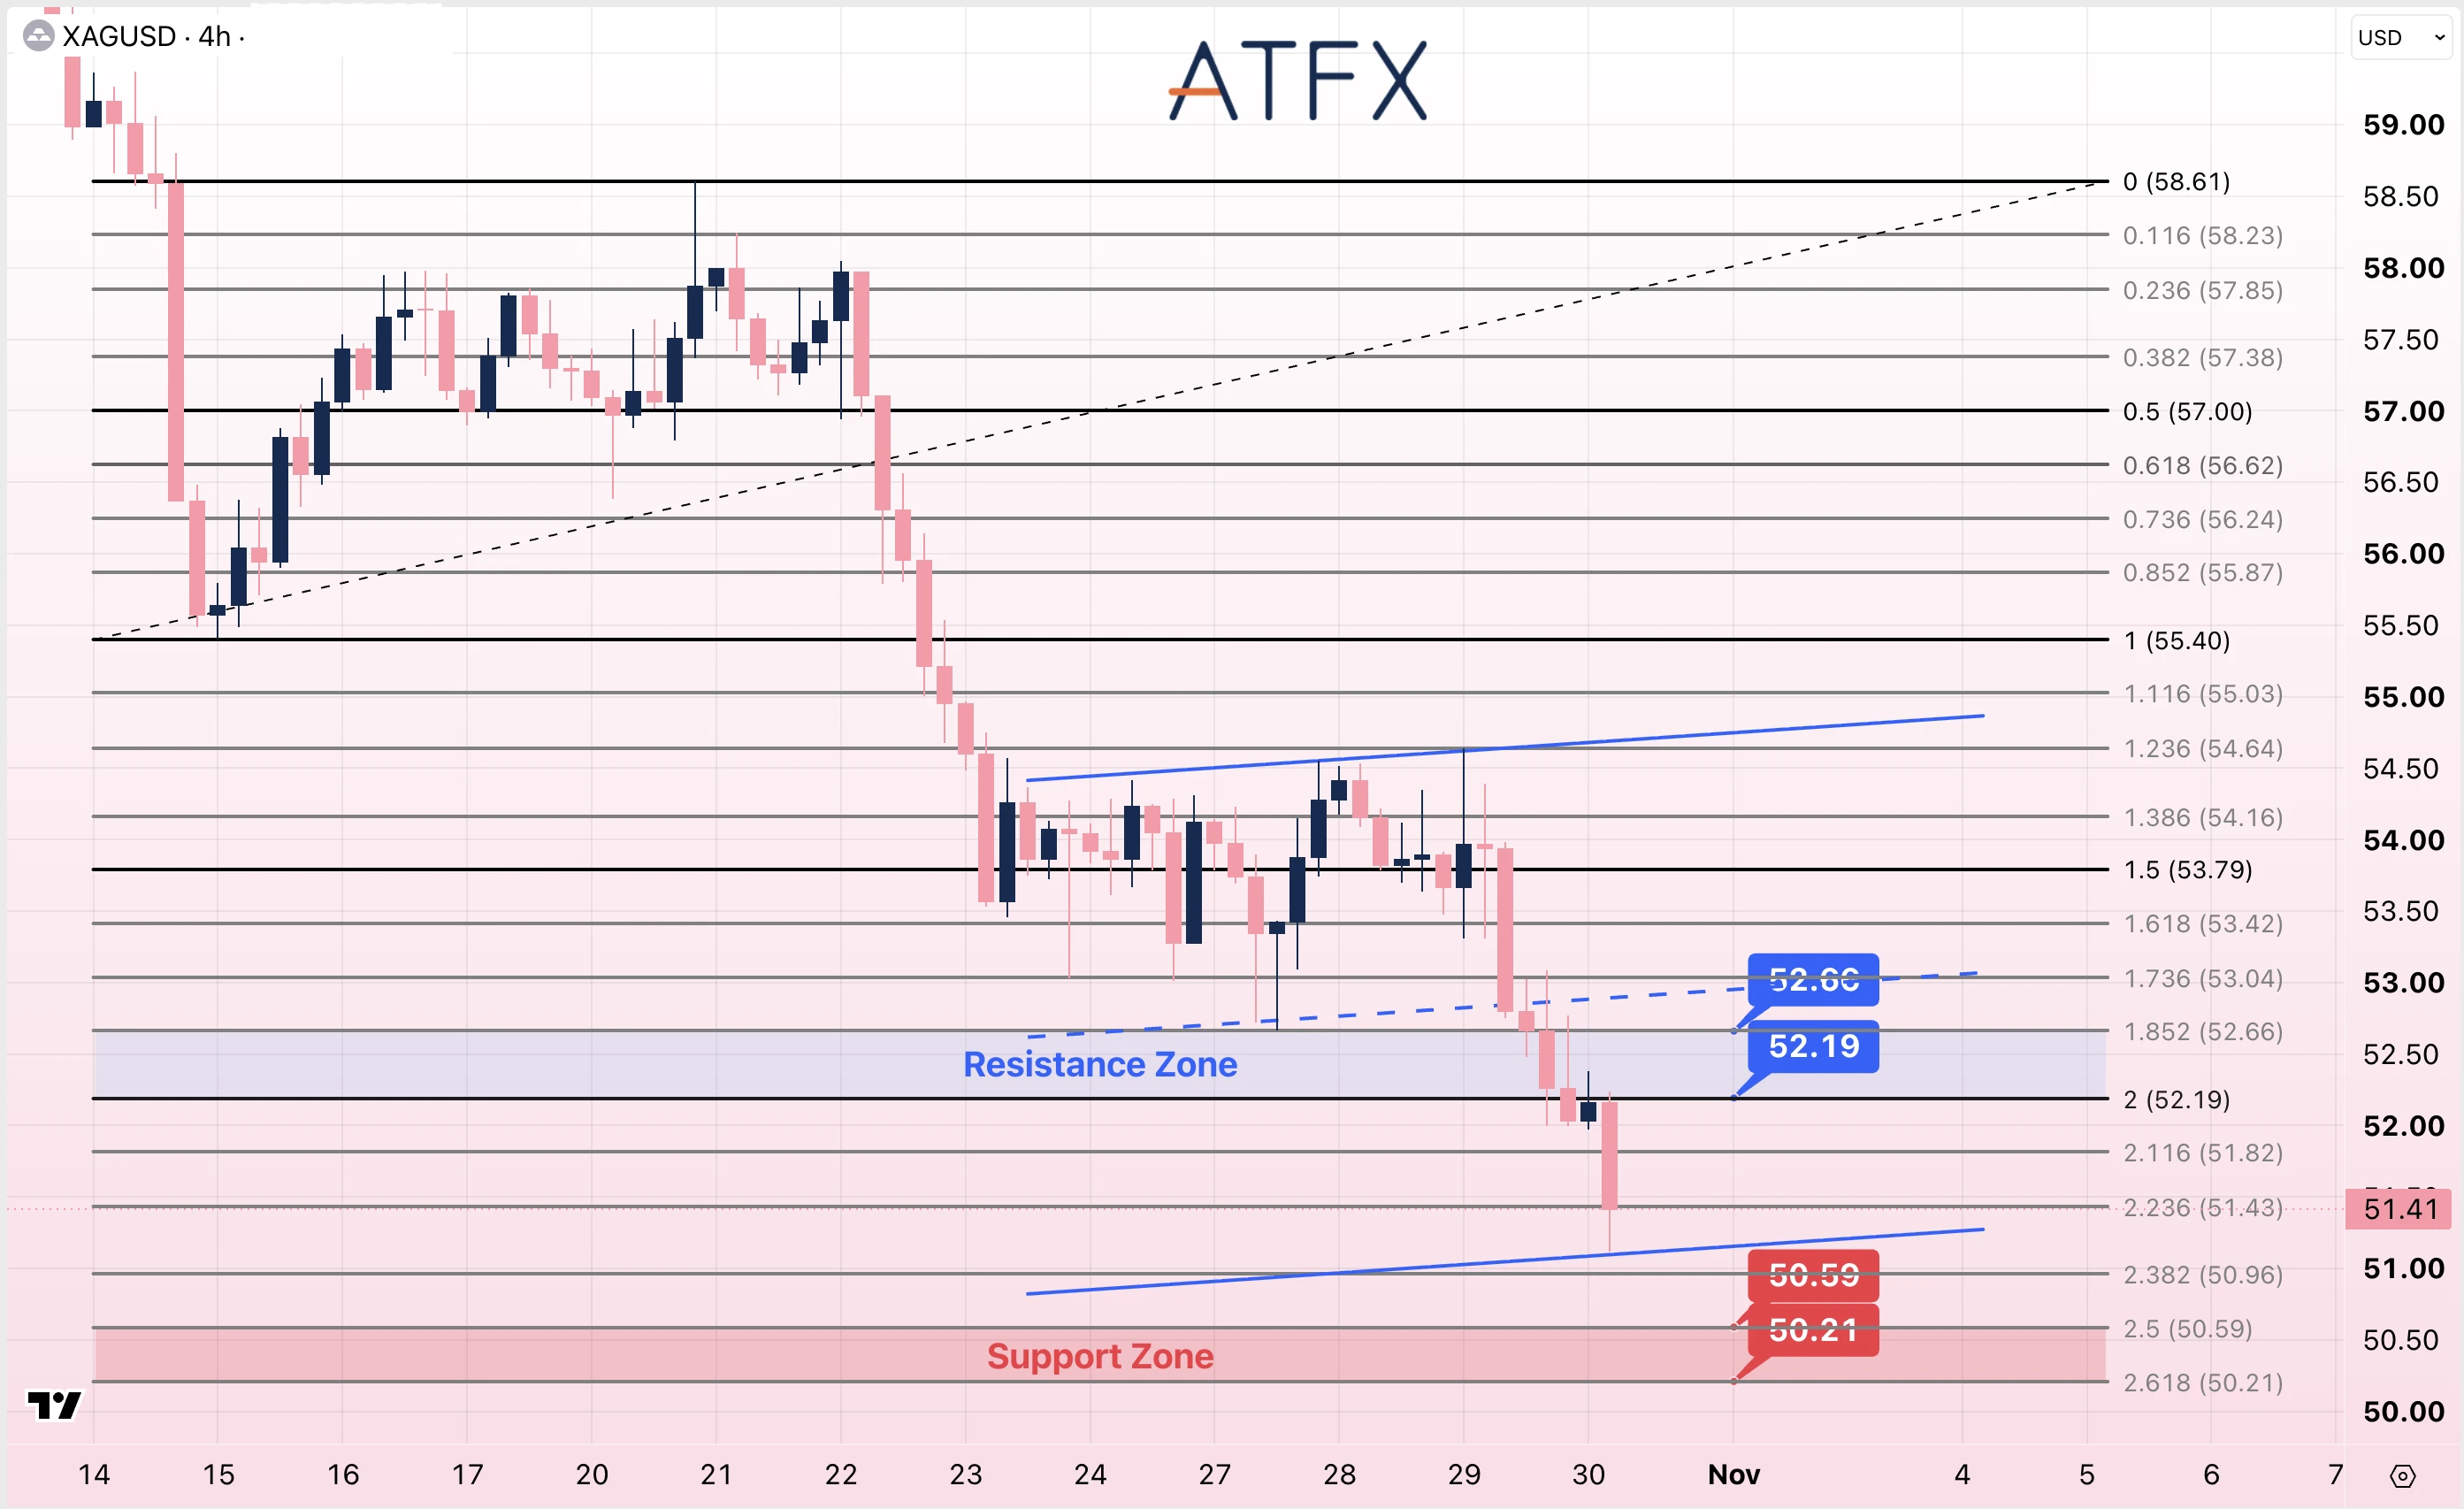
- Resistance: 52.19/52.66
- Support: 50.59/50.21
Analyst’s View: September core PCE rose 0.3% month on month and 3.1% year on year, while US GDP grew at a 3.4% annualized pace. These readings keep inflation and further tightening in focus, without making a December hike certain.
Gold fell despite a softer Dollar and lower Treasury yields. Position reductions and cash-raising during the technology selloff may have outweighed their usual support, while elevated oil prices maintained inflation concerns. Widespread margin-driven liquidation has not been confirmed.
Gold is near $3,998, testing the lower edge of its short-term rising channel after retreating from $4,066. Below $3,991, attention turns to $3,973 and $3,955. Recovering $4,008 and then $4,031 would help stabilize price before resistance at 4,049–4,066.
Silver also faces a demand test from next week’s manufacturing surveys. Price is near $51.41, below $52.19 and close to the channel’s lower boundary. Below $50.96, marked supports are $50.59 and $50.21; recovering 52.19–52.66 would ease immediate pressure.
Bias: Gold Cautiously Bearish; Silver Cautiously Bearish
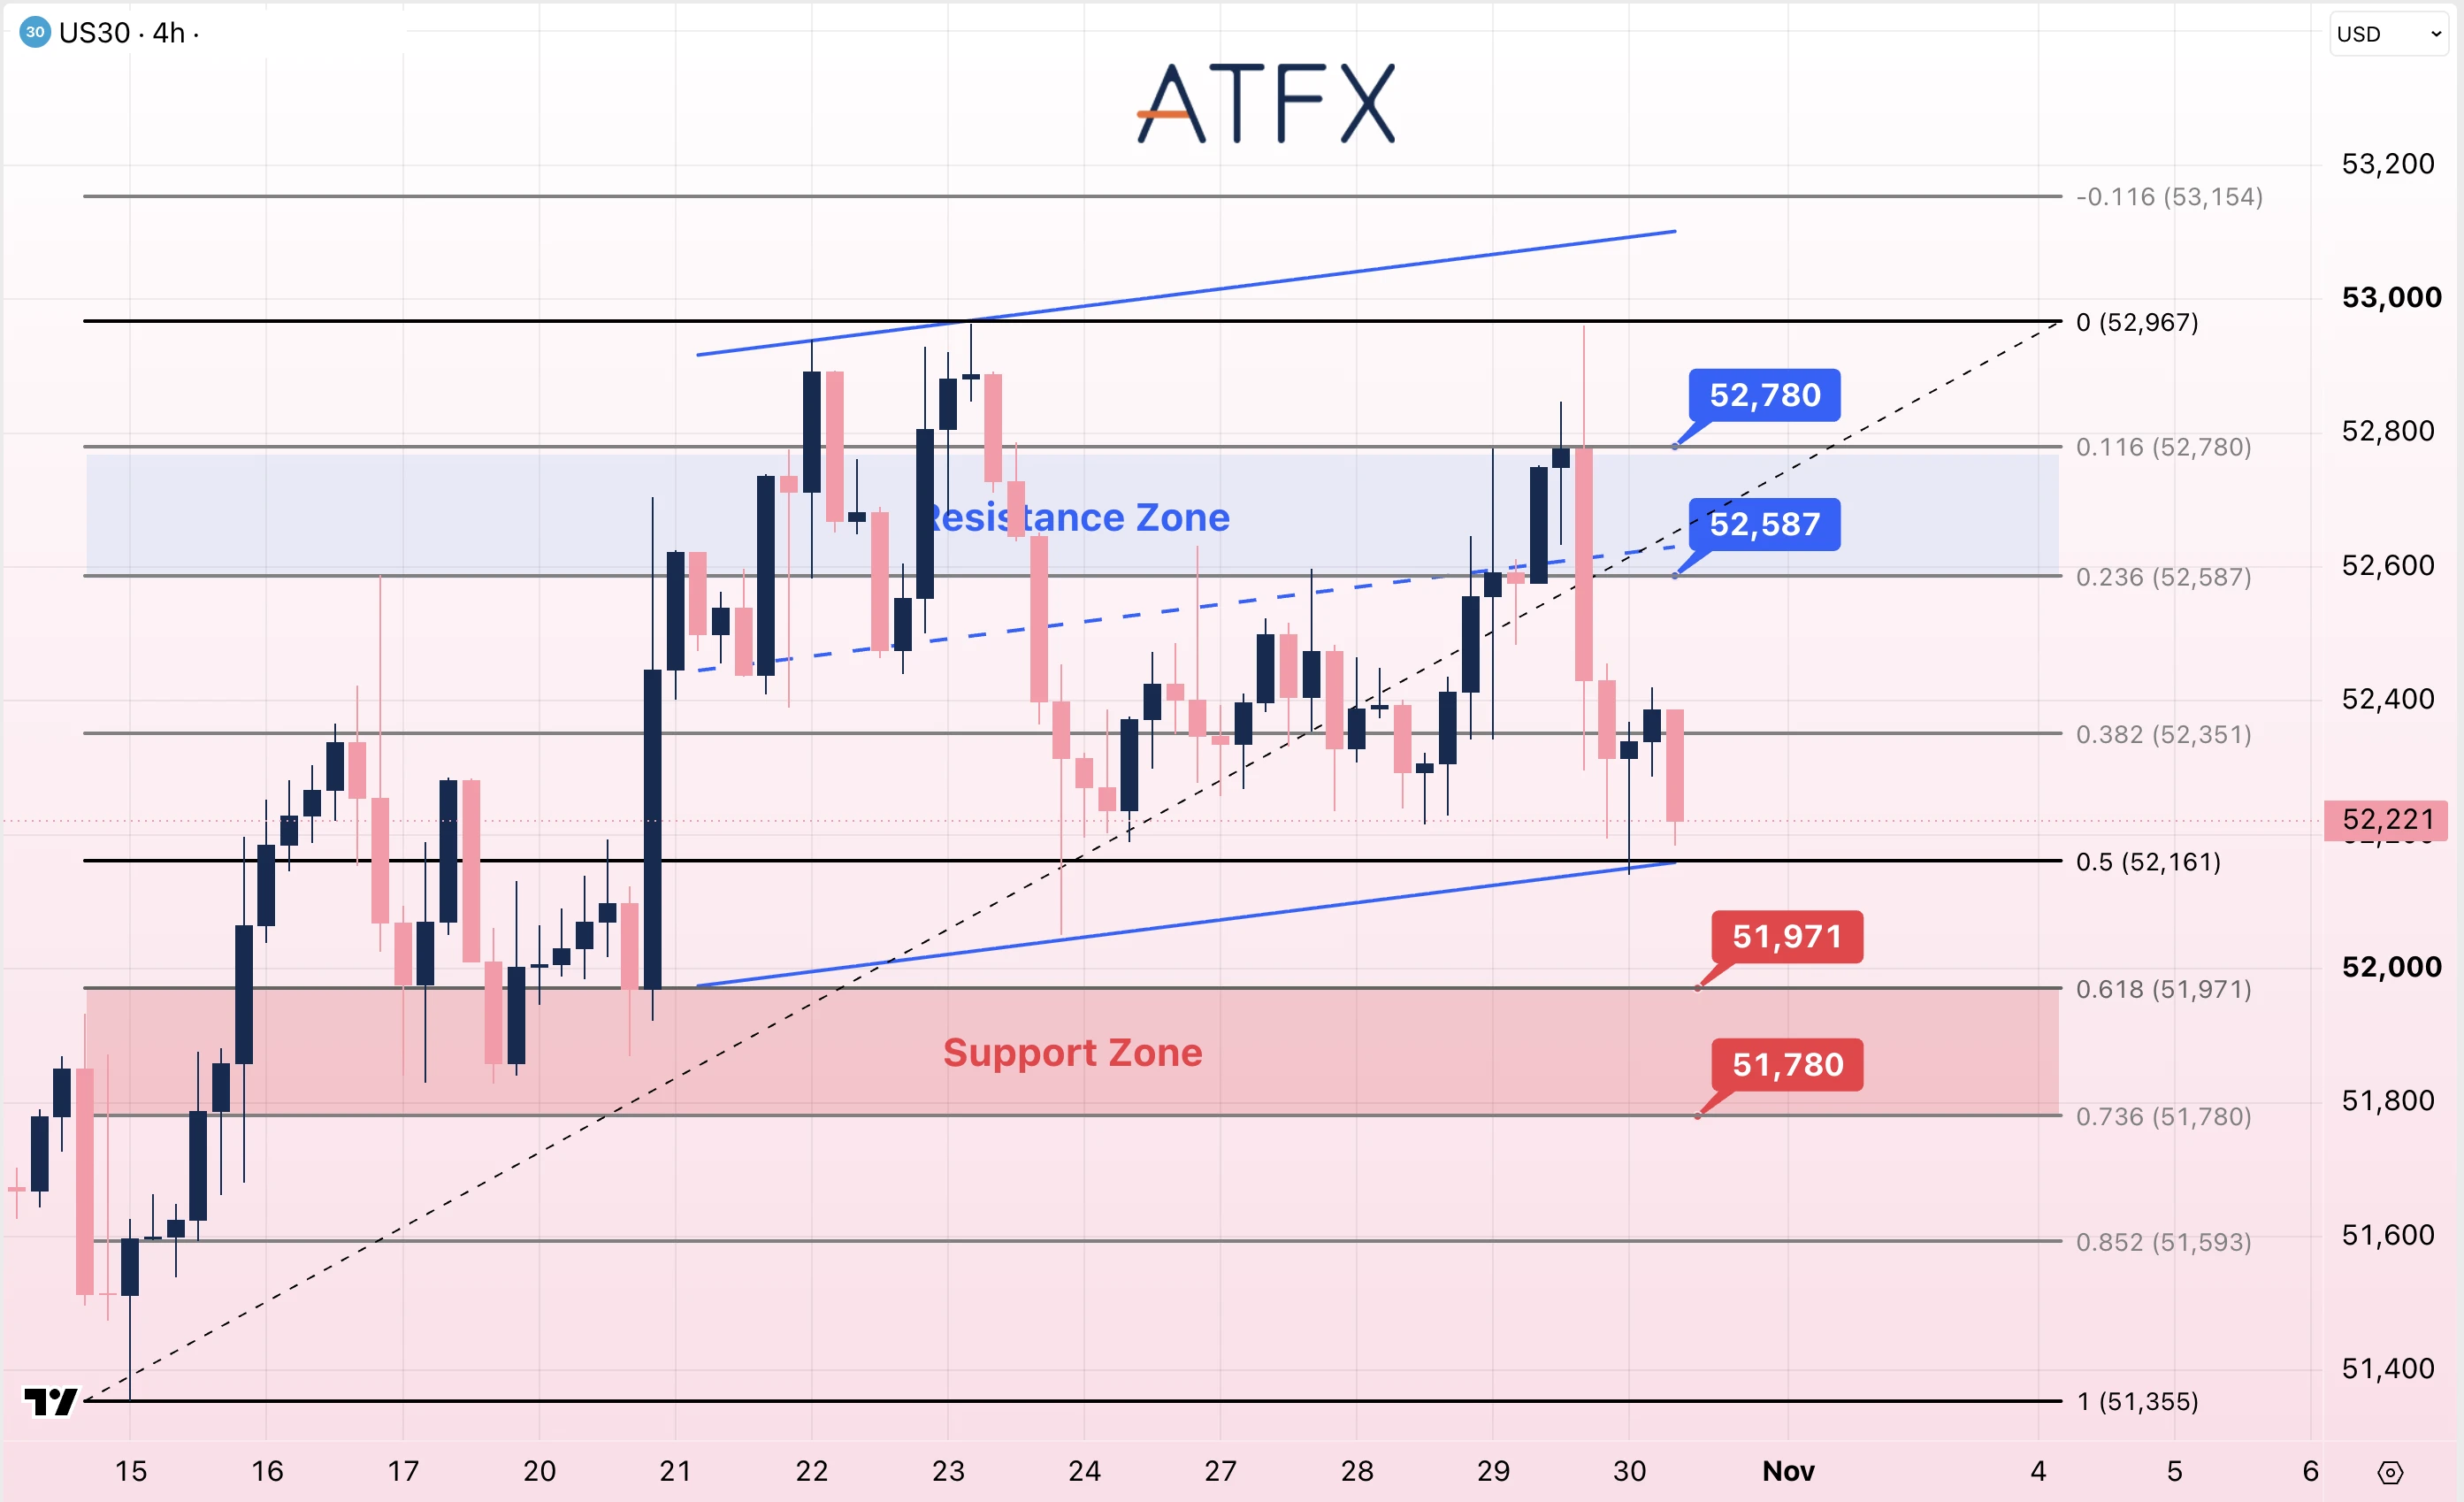
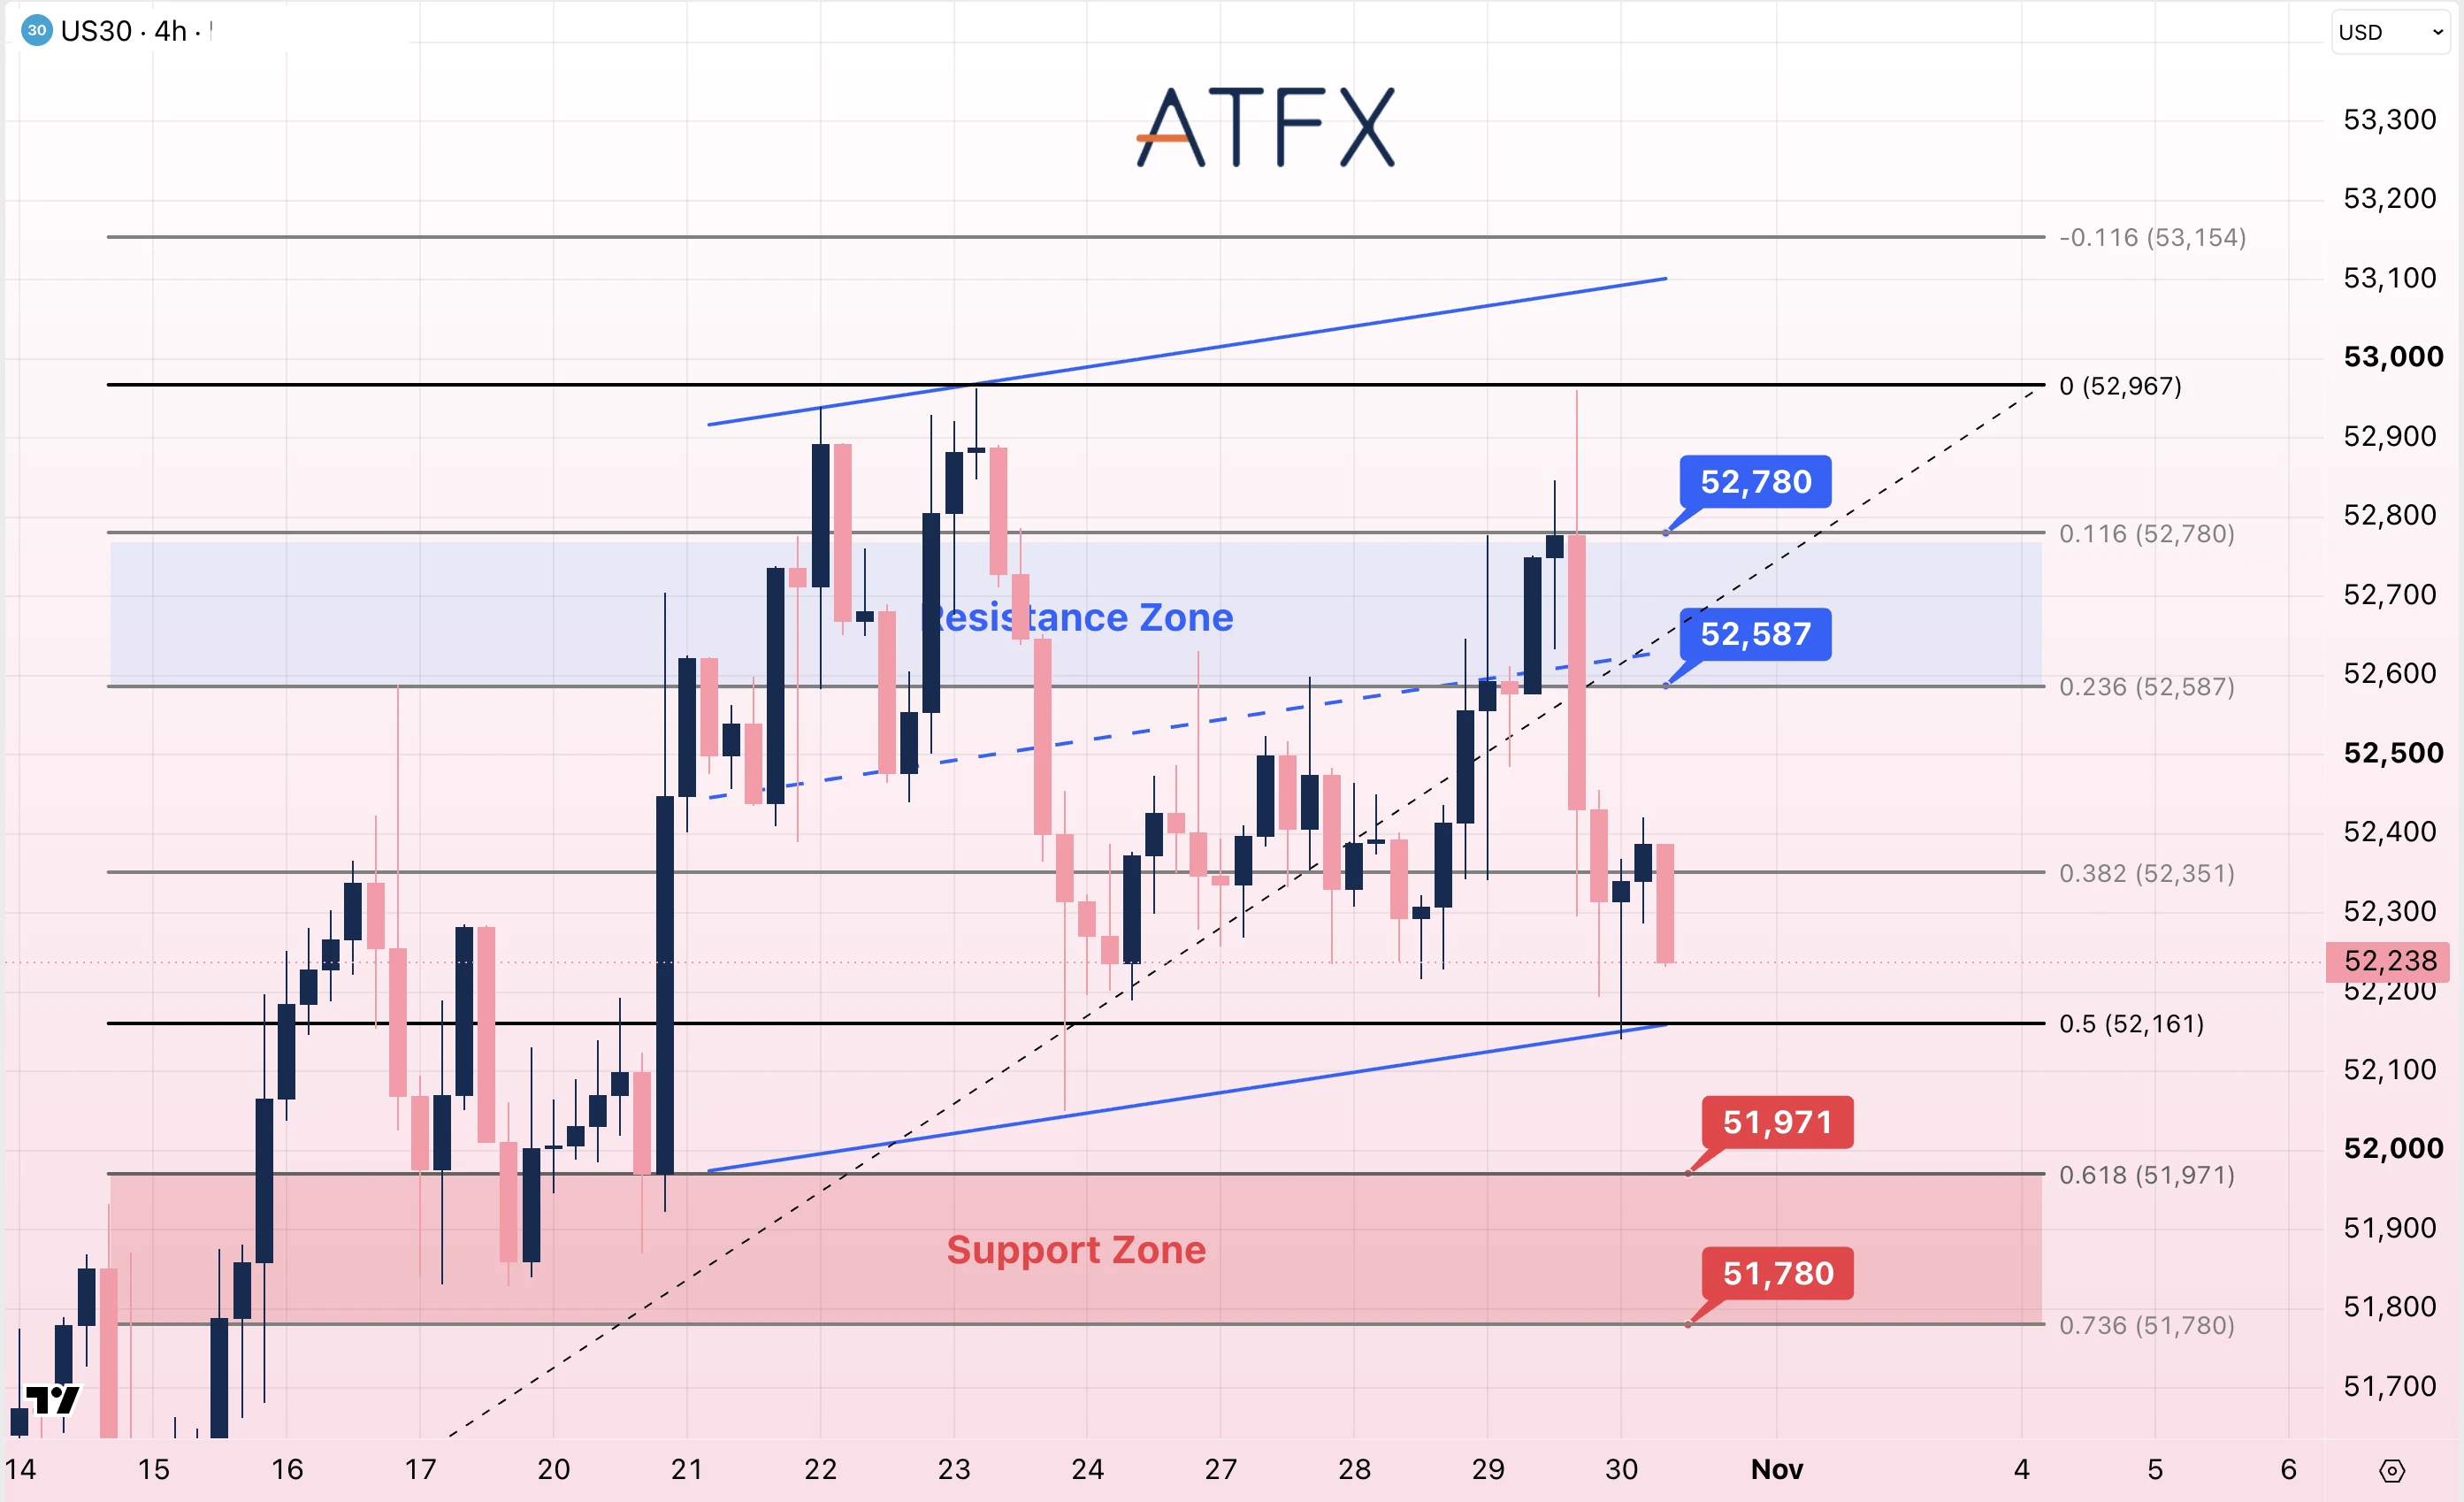
- Resistance: 52587/52780
- Support: 51971/51780
Analyst’s View: Defensive sectors helped limit the Dow’s decline relative to the Nasdaq. High energy costs still threaten margins, while next week’s US labor data could reshape expectations for borrowing costs.
The midterm elections add policy uncertainty around fiscal spending, trade and regulation. Investors will weigh the results alongside earnings guidance, with market responses likely to vary across sectors.
US30 is near 52,221, below 52,351 and the rising channel’s midline, after reversing from 52,780. Price is approaching the lower channel boundary around 52,161; a break would bring 51,971 and 51,780 into focus.
Recovering 52,351 would be an initial improvement, but reclaiming the 52,587–52,780 resistance zone is needed to restore a firmer recovery.
Bias: Cautiously Bearish
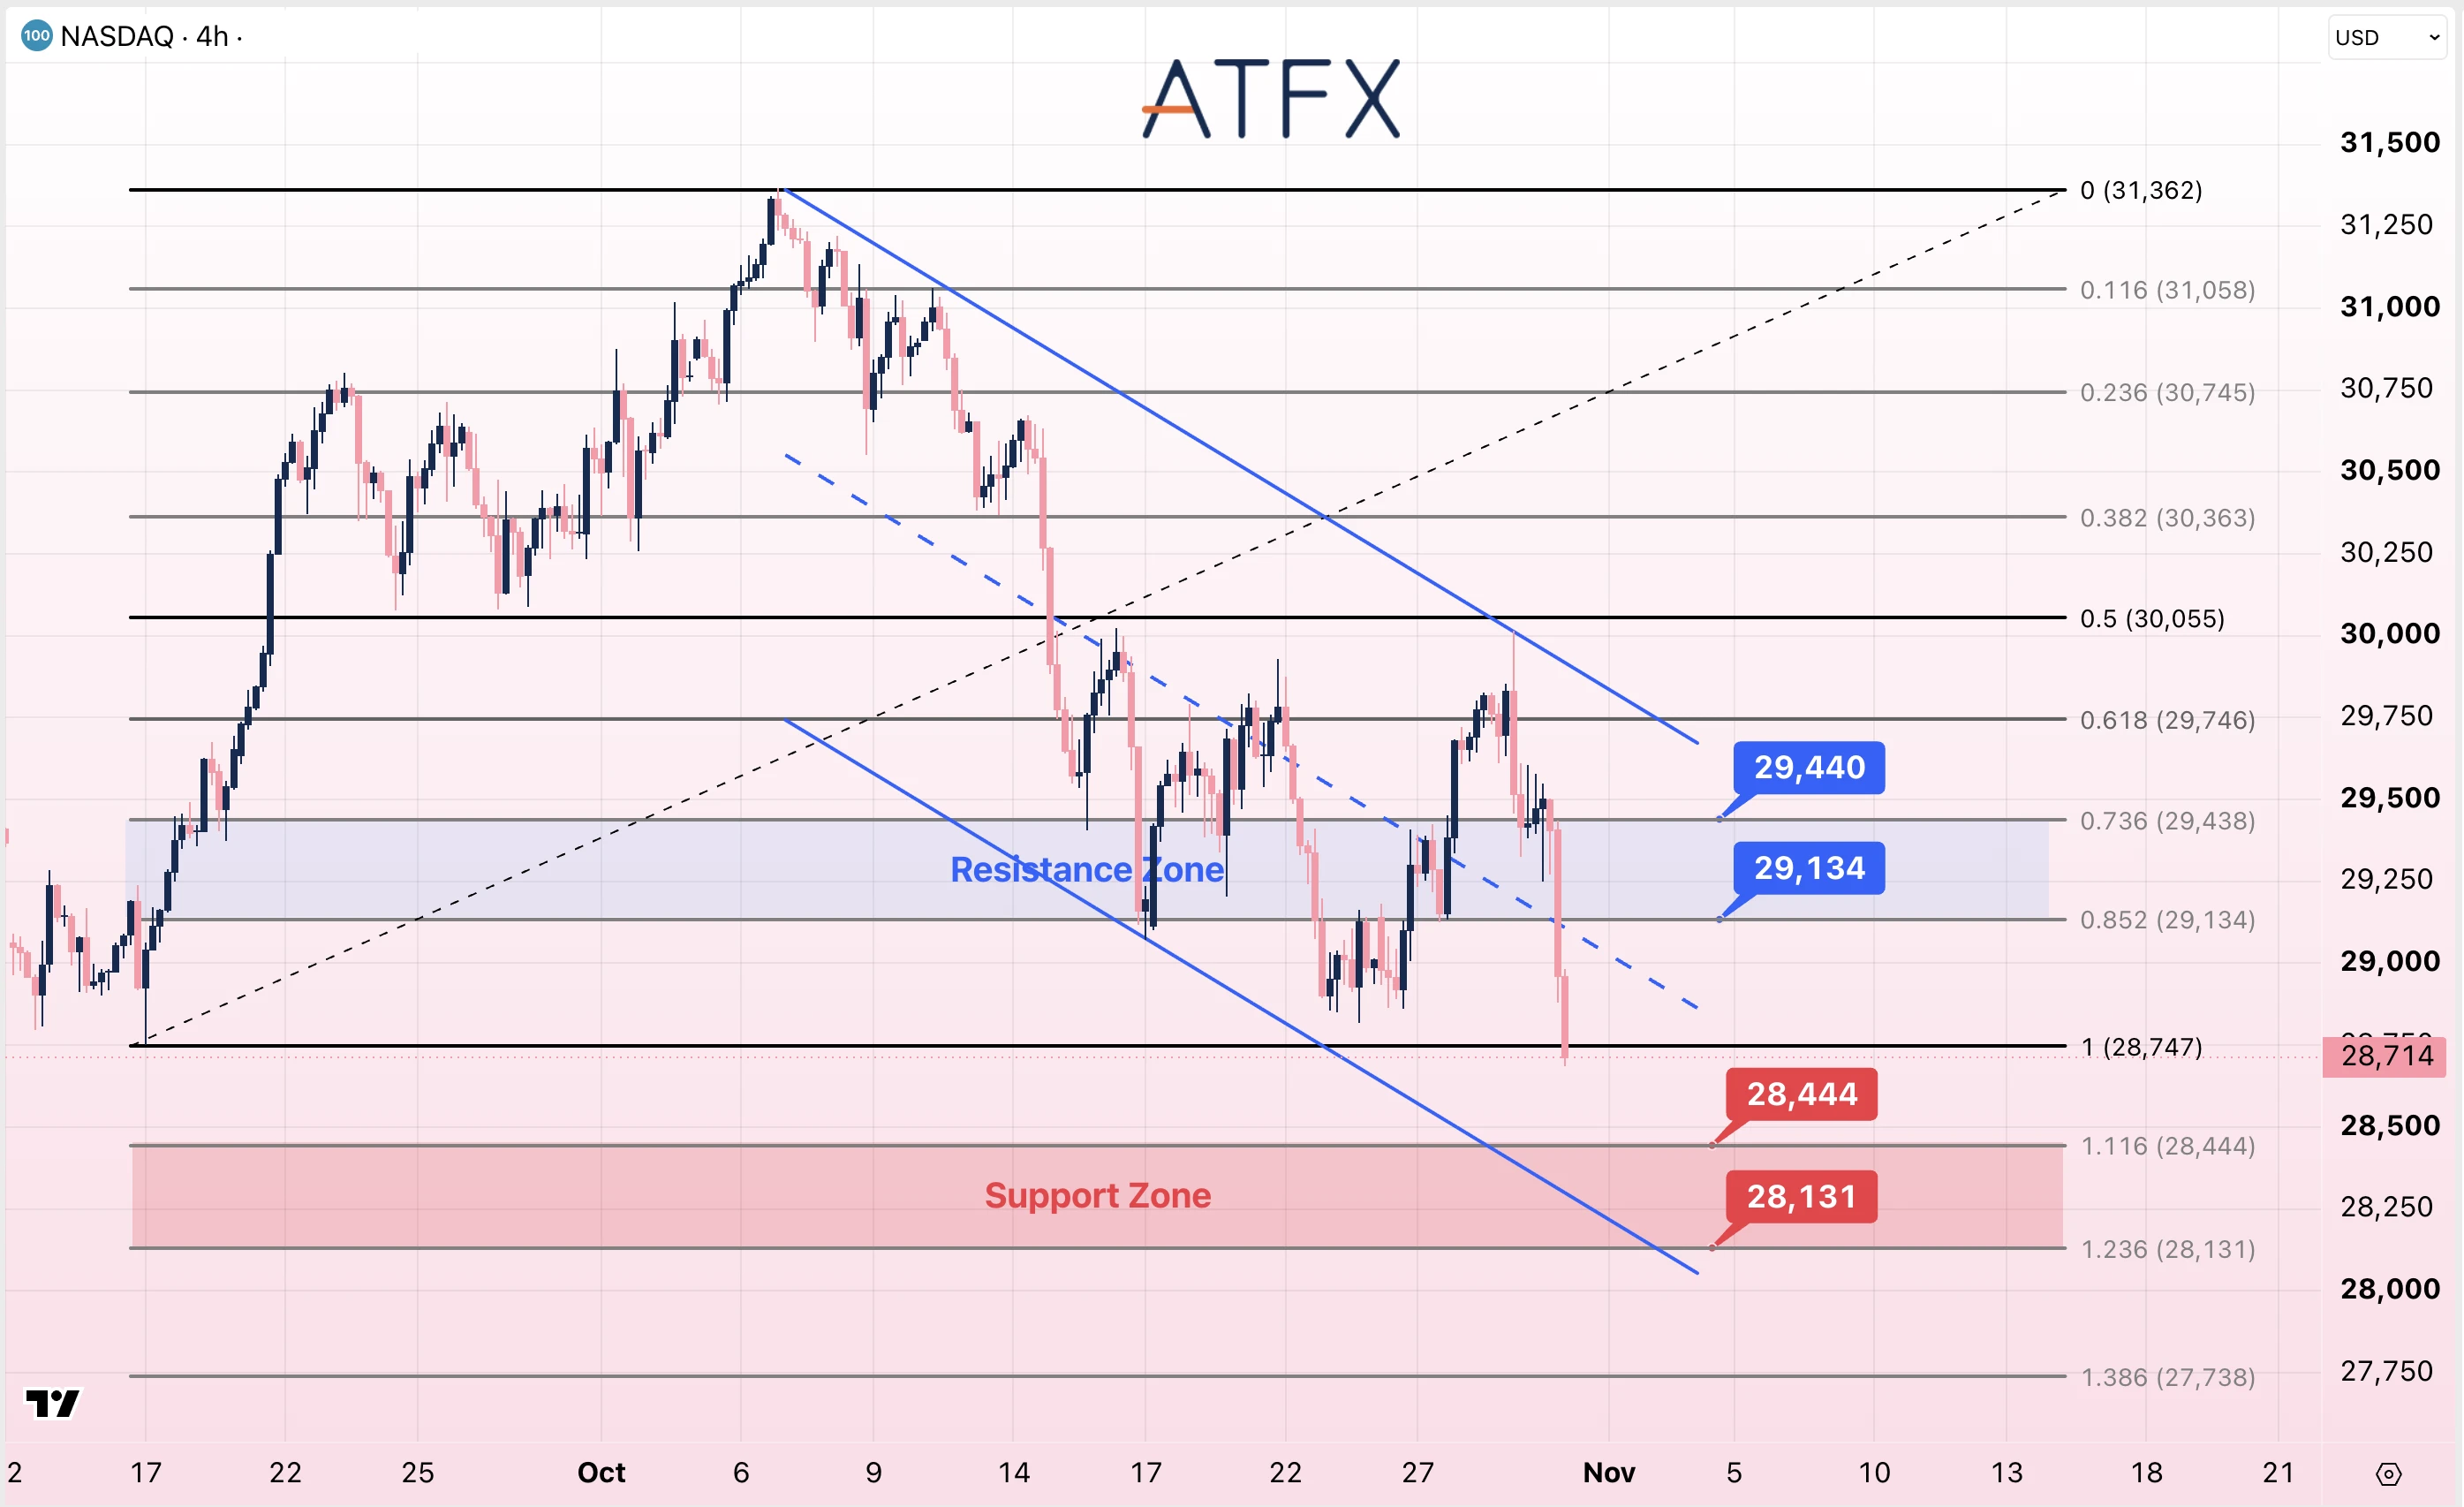
- Resistance: 29134/29440
- Support: 28444/28131
Analyst’s View: Amazon’s results renewed scrutiny of AI spending and cash generation. Intel’s weak fourth-quarter outlook outweighed stronger third-quarter adjusted earnings. Following Alphabet’s decline, these releases helped push Nasdaq futures lower.
Amazon’s strong AWS growth came alongside a trailing-year free cash outflow, highlighting expansion costs. Intel cited continuing PC-market weakness. Lower yields can support valuations, but they do not resolve concerns about future profits and cash flow.
NAS100 is near 28,714, below the 28,747 reference low and the descending channel’s midline. Sustained trading below 28,747 would leave 28,444 and 28,131 in focus.
Recovering 28,747 would offer initial stabilization, but the 29,134–29,440 resistance zone must be reclaimed for a clearer improvement. Until then, rebounds remain vulnerable within the broader downtrend.
Bias: Cautiously Bearish
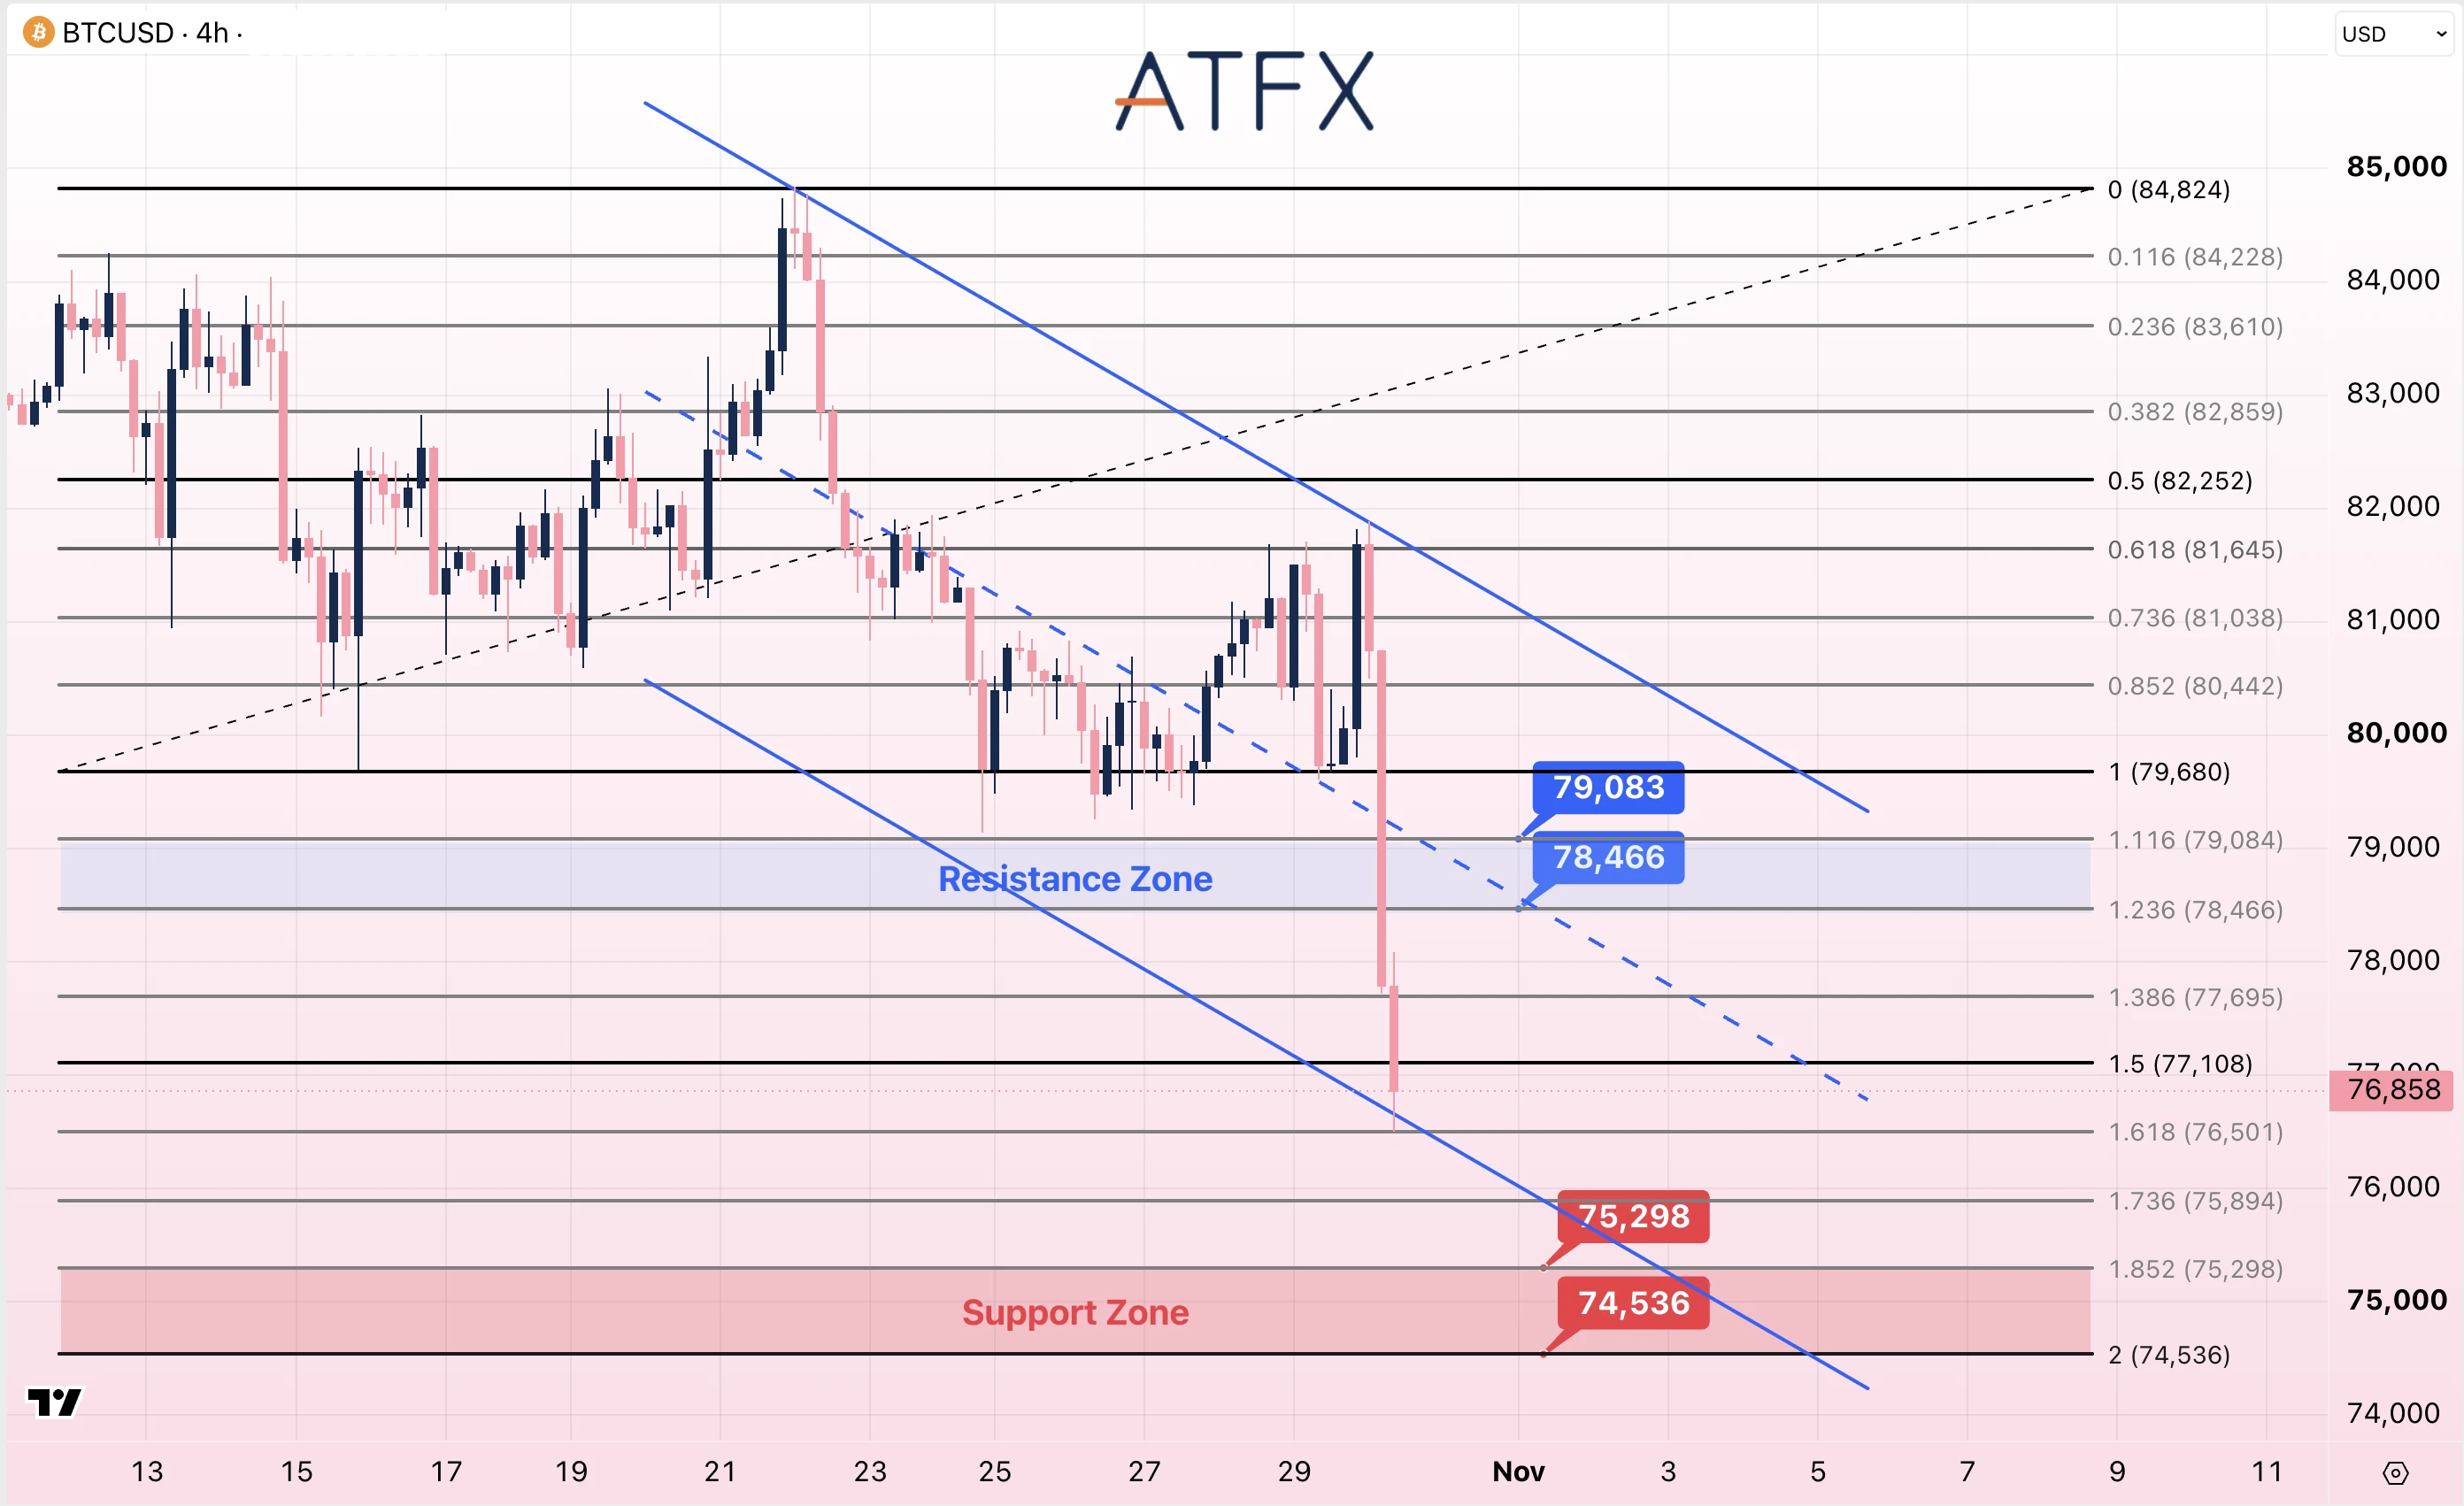
- Resistance: 78466/79083
- Support: 75298/74536
Analyst’s View: Binance says around $3 billion in assets linked to the security incident have been frozen. Deposits and withdrawals remain suspended, and the exchange says it will cover losses. The frozen amount is separate from the final loss assessment.
Next week’s US jobs data and rate decisions remain broader risk catalysts. A recovery in technology sentiment could help Bitcoin stabilize, but continued uncertainty over the Binance incident may keep rallies constrained independently of those macro factors.
Bitcoin is near $76,858 after breaking below $80,000, $79,680 and $78,466. Price is near the descending channel’s lower boundary; below $76,501, attention turns toward $75,298 and $74,536.
An initial rebound would face $77,108 and $77,695. Reclaiming the marked resistance zone at 78,466–79,083 would be needed to reduce immediate downside pressure.
Bias: Cautiously Bearish
Sources: BEA inflation | BEA GDP | ECB decision | BoJ schedule | Tokyo CPI | Tokyo inflation (Bloomberg) | US close | Amazon results | Intel results | Futures update | Binance update | Australia PPI | Dollar and yields | BLS releases | BoE calendar
Disclaimer: This analysis is for reference only and does not constitute investment advice.