Market Highlight 05/01/2026
U.S. equities closed higher last Friday, with the Dow Jones Industrial Average and the S&P 500 snapping a four-day losing streak to start 2026, supported by gains in chipmakers such as Nvidia and Intel, as well as Boeing. The Dow rose 0.66%, the S&P 500 added 0.19%, while the Nasdaq edged down 0.03%.
The U.S. dollar began 2026 on a firm footing as investors positioned ahead of a key week of economic data that could shape expectations for Federal Reserve policy and broader global market direction. The U.S. Dollar Index climbed 0.24% to 98.48, while EUR/USD fell 0.25% to 1.1716.
Gold demand remained robust, with precious metals extending last year’s strong rally into the first trading session of the new year. Spot gold rose 0.37% to close at $4,329.89 per ounce. Oil prices, however, ended lower on the first trading day of 2026, after posting their largest annual decline since 2020. Investors continued to weigh concerns over global supply oversupply against ongoing geopolitical risks, including the war in Ukraine and developments surrounding Venezuelan exports.
Key Outlook 05/01/2026
Markets enter the first whole trading week of the new year amid renewed geopolitical tensions following the arrest of Venezuelan President Nicolás Maduro by U.S. authorities. Investors will closely monitor any weekend developments in Venezuela that could reignite risk-off sentiment. At the same time, attention will turn to key economic data releases from the United States and the euro area. In particular, the U.S. non-farm payrolls report will be critical, as its outcome will directly influence expectations for a potential Federal Reserve rate cut in January and could set the tone for markets at the start of the year.
Key Data and Events Today:
- 17:30 EU Sentix Investor Confidence JAN **
- 23:00 US ISM Manufacturing PMI DEC ***
Tomorrow:
- 16:55 EU GERMANY Services PMI Final DEC **
- 17:00 EU Services PMI Final DEC **
- 17:30 GB Services PMI Final DEC **
- 21:00 EU GERMANY CPI MoM Prel DEC **
- 22:45 US Services PMI Final DEC **
Markets Analysis 05/01/2026
EURUSD

- Resistance: 1.1734/1.1763
- Support: 1.1666/1.1644
EUR/USD edged lower as the U.S. dollar rebounded amid rising risk aversion. The 4-hour chart shows price capped by the descending trendline and the 1.1734–1.1763 resistance zone, keeping upside limited. Immediate support lies at 1.1666–1.1644, with a break lower opening room for further downside.
GBPUSD

- Resistance: 1.3493/1.3534
- Support: 1.3399/1.3357
GBP/USD edged lower as defensive sentiment favoured the U.S. dollar, keeping it capped below the 1.3490–1.3530 resistance zone. The 4-hour chart shows fading upside momentum, keeping the pair in a high-level consolidation. Immediate support lies at 1.3399–1.3357, with a break lower opening the door to a deeper pullback.
USDJPY
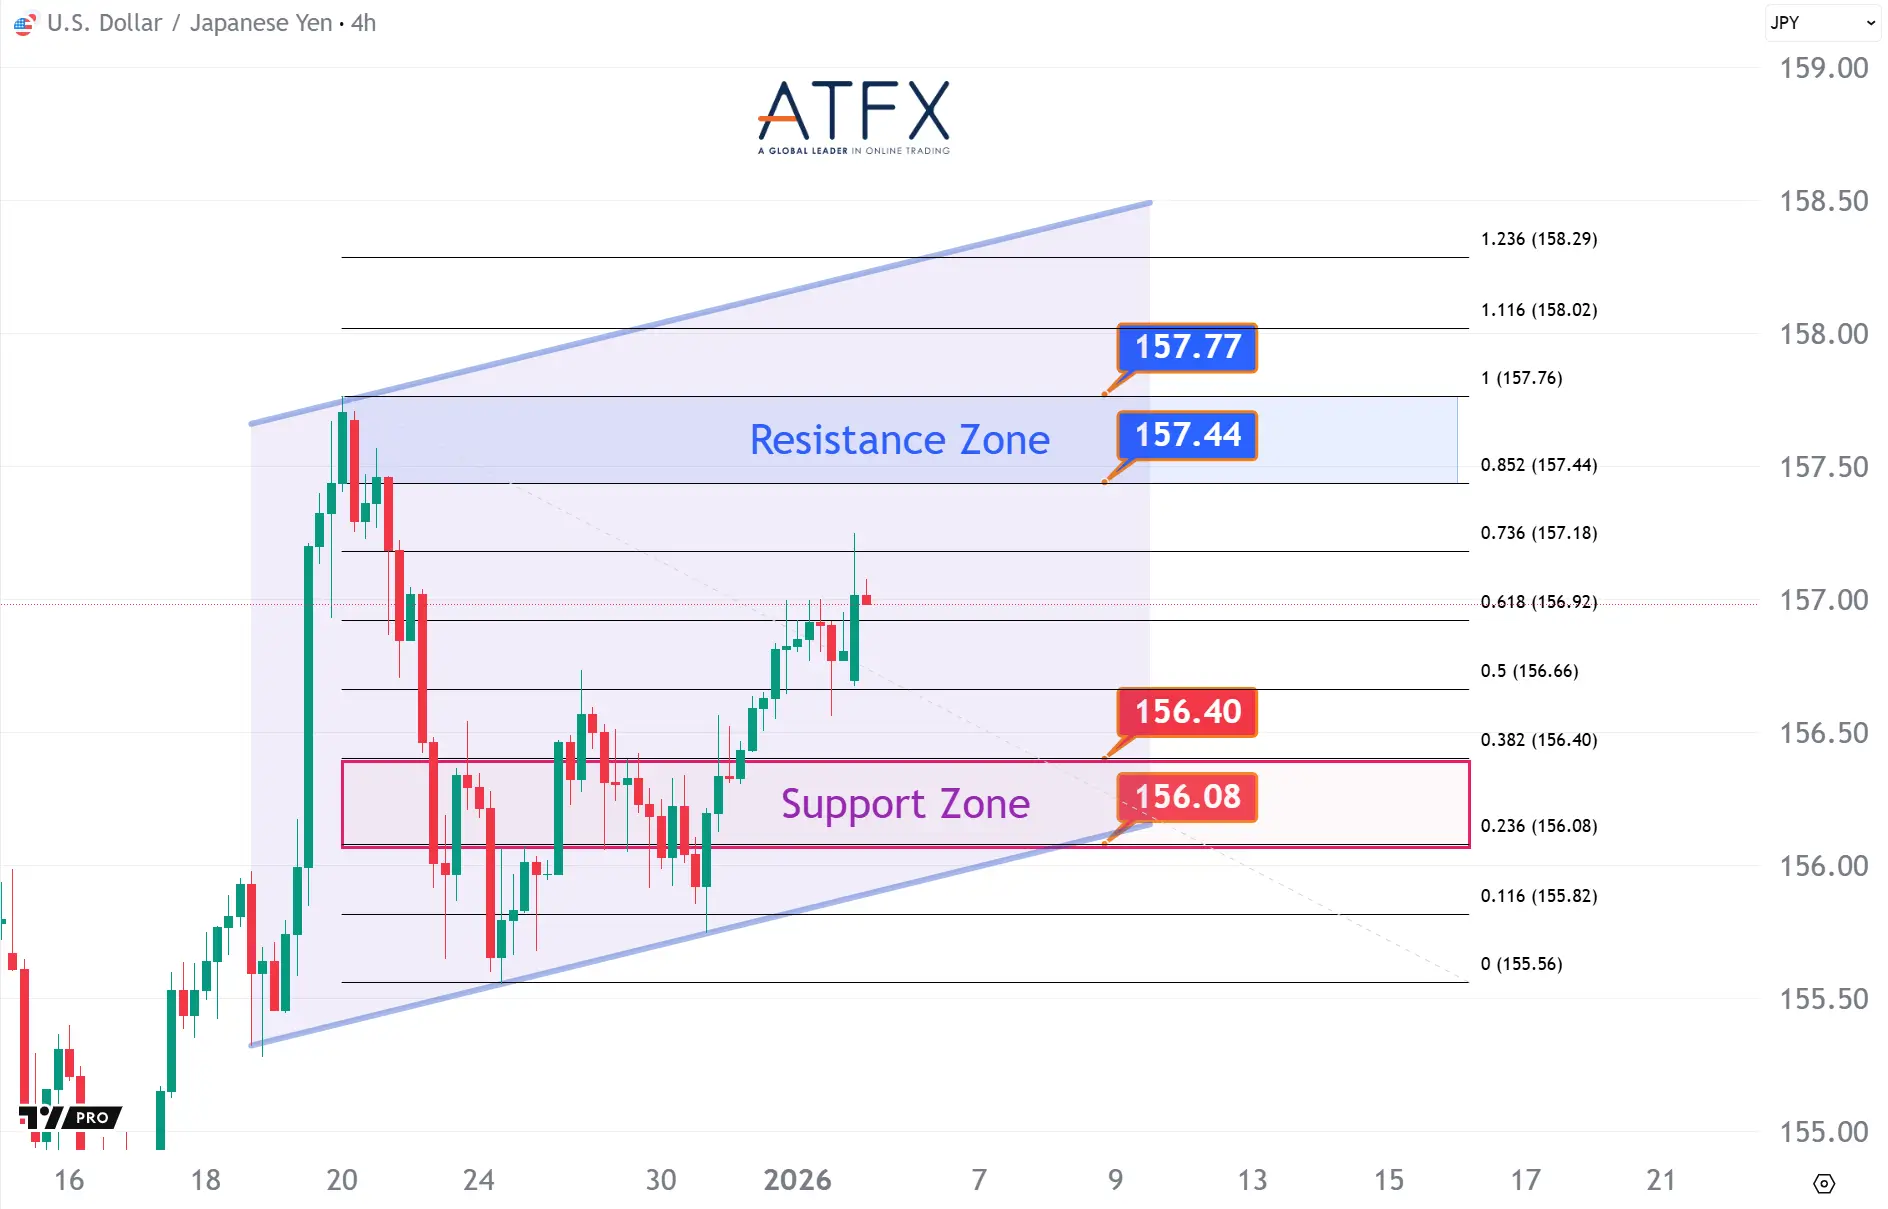
- Resistance: 157.44/157.77
- Support: 156.40/156.08
USD/JPY remains elevated near 157 as dollar strength offsets safe-haven demand for the yen. The 4-hour chart shows price holding within an ascending channel, though the 157.44–157.77 resistance zone caps upside. Immediate support lies at 156.40–156.08, with intervention risks keeping volatility elevated.
US Crude Oil Futures (FEB)

- Resistance: 58.18/58.48
- Support: 56.90/56.59
WTI found support after OPEC+ agreed to pause output hikes in Q1 2026, though oversupply concerns continue to cap upside. The 4-hour chart shows the price rejected near the 58.18–58.48 resistance zone, limiting bullish momentum. Immediate support lies at 56.90–56.59, with Venezuela-related risks adding volatility rather than a clear trend.
Spot Gold

- Resistance: 4444/4477
- Support: 4338/4305
Spot Silver
- Resistance: 78.44/81.20
- Support: 72.36/69.64
Gold remains supported by heightened geopolitical risk following U.S. action against Venezuela. The 4-hour chart shows price capped by the $4,444–$4,477 resistance zone, limiting further upside for now. Immediate support lies at $4,338–$4,305, with Fed rate-cut expectations underpinning prices despite elevated volatility.
Dow Futures
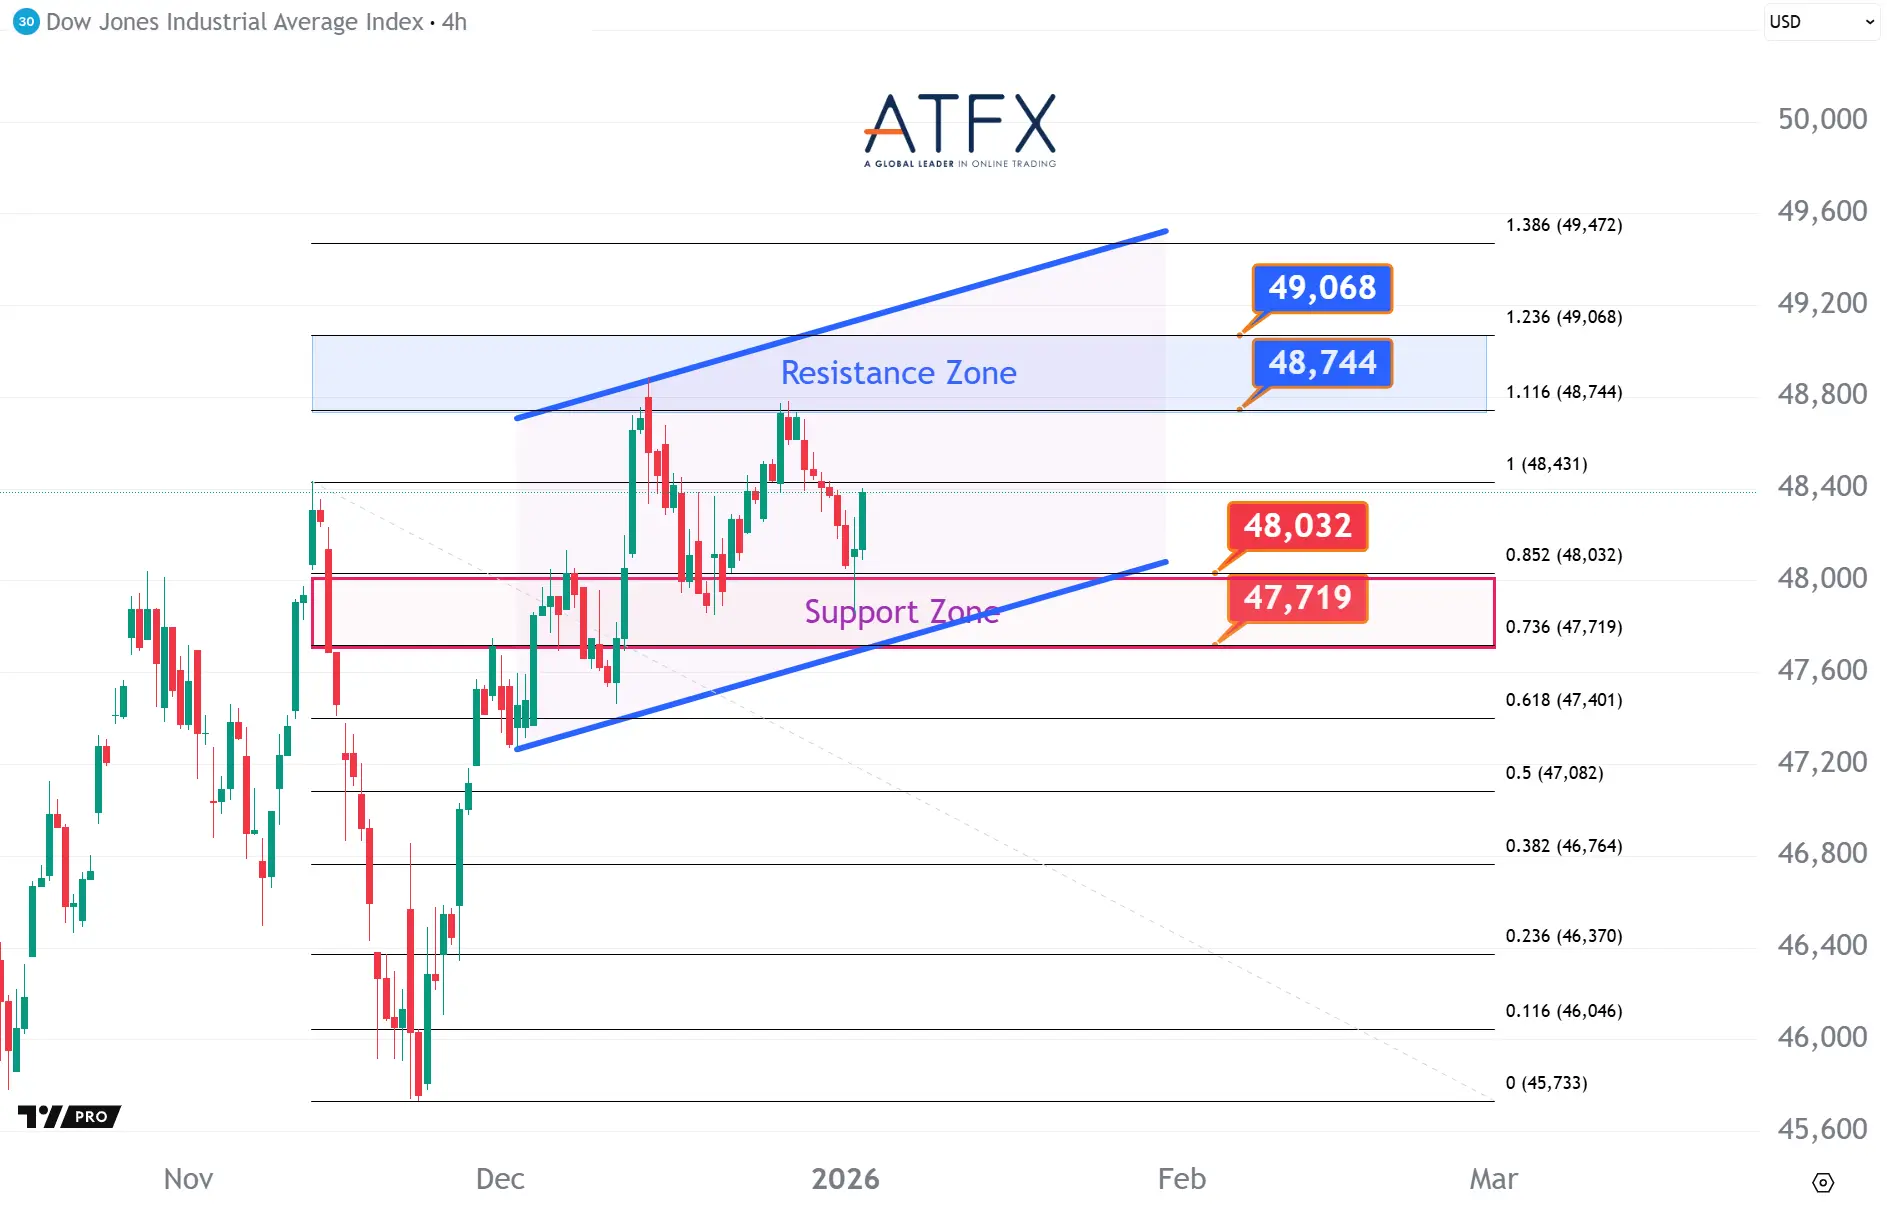
- Resistance: 48744/49068
- Support: 48032/47719
The Dow Futures continue to draw support from industrial and cyclical stocks, but profit-taking is emerging near the 49,000 level. Price action between 48,744 and 48,032 suggests hesitation rather than reversal, with the 48,032 level remaining key to maintaining the broader consolidation structure.
NAS100

- Resistance: 25565/25834
- Support: 24741/24401
NAS100 continues to lag as divergences within tech stocks persist, with valuation concerns weighing on sentiment. Repeated rejections near the 25,565–25,834 area suggest fading upside appetite. As long as the 24,741–24,401 zone holds, price action favours consolidation rather than a deeper breakdown.
BTC

- Resistance: 94,652/95.844
- Support: 90,726/89,513
Bitcoin remains range-bound as market indecision persists. The 4-hour chart shows price trading within an ascending channel, though the $94,652–$95,844 resistance zone caps upside. Immediate support lies at $90,726–$89,513, with continued mild ETF outflows keeping BTC in consolidation.
Enjoy trading! The content is for reference only. Please ensure that you understand the risk.
Bitcoin is consolidating around 88,000–89,000, with a clear 4H range structure; resistance stands at 89,086–89,821 after repeated rejections. Support at 86,743–86,020 remains intact, suggesting consolidation rather than reversal, as unstable ETF flows and macro uncertainty cap upside unless a decisive breakout occurs.
Enjoy trading! The content is for reference only. Please ensure that you understand the risk.