


Key Takeaways
The dollar is near a 19-month high. Sterling has reached a new 2026 low, while Japan’s faster core inflation supports expectations of a December BoJ hike. USD/JPY near 160 remains a focus for intervention concerns, rather than an official intervention trigger. Today’s Focus: Watch whether ANT holds its first-day gains while established AI shares stabilise. Waller’s 21:25 GMT+8 appearance is scheduled as welcoming remarks; any policy comments could move rate pricing. UK retail sales, Lagarde and US inflation expectations in the Michigan survey are also in focus. Next Wednesday’s PCE inflation report precedes thinner Thanksgiving trading. |
Global Market Review 20/11/2026
- Thursday’s Dow fell 2.19% to 49,097, the S&P 500 lost 2.02% to 7,175, and the Nasdaq Composite dropped 2.25% to 23,879.
- DXY rose 0.11% to 103.93.
- Two- and 10-year Treasury yields eased to 4.762% and 5.046%, respectively, despite persistent expectations of Fed hikes.
- Brent gained 0.85% to $92.73, WTI slipped 0.06% to $83.21, and gold fell 1.67% to $3,660.39.
- The later chart snapshots show further weakness in metals.
- Falling bond yields have provided little relief while demand for dollars and cash remains strong.
Economic Calendar
Key Events on November 20 (GMT+8)
| Time (GMT+8) | Event | Importance |
|---|---|---|
| 07:30 | Japan October Core CPI (YoY) — released: 2.2% | ★★★ |
| 09:15 | China November One-Year & Five-Year LPR — unchanged: 3.00% / 3.50% | ★★ |
| 15:00 | Germany October PPI (YoY) ; UK October Retail Sales (MoM) | ★★ |
| 16:30 | ECB President Christine Lagarde speaks | ★★★ |
| 21:25 | Fed Governor Christopher Waller — welcoming remarks | ★★★ |
| 23:00 | Eurozone Consumer Confidence (Flash, Nov) ; US Michigan Sentiment (Final, Nov) | ★★ |
Key Events on November 23–27 (GMT+8)
- Mon 23: Japan holiday. Australia, Eurozone, UK and US flash manufacturing and services PMIs.
- Tue 24: Japan flash PMIs; Germany Ifo; US weekly ADP employment, consumer confidence and Richmond Fed manufacturing.
- Wed 25: API/EIA oil stocks; Australia CPI; Germany Q3 GDP; US core PCE, durable goods, Q3 GDP second estimate, jobless claims and new home sales.
- Thu 26: US Thanksgiving holiday; Fed Beige Book (03:00 GMT+8); Germany GfK consumer confidence.
- Fri 27: Germany unemployment; Eurozone economic sentiment. US equity trading closes early.
Markets Analysis 20/11/2026
Technical levels use ATFX’s November 20 four-hour chart snapshots. Cash closes, chart readings, and exchange futures are separate price references.
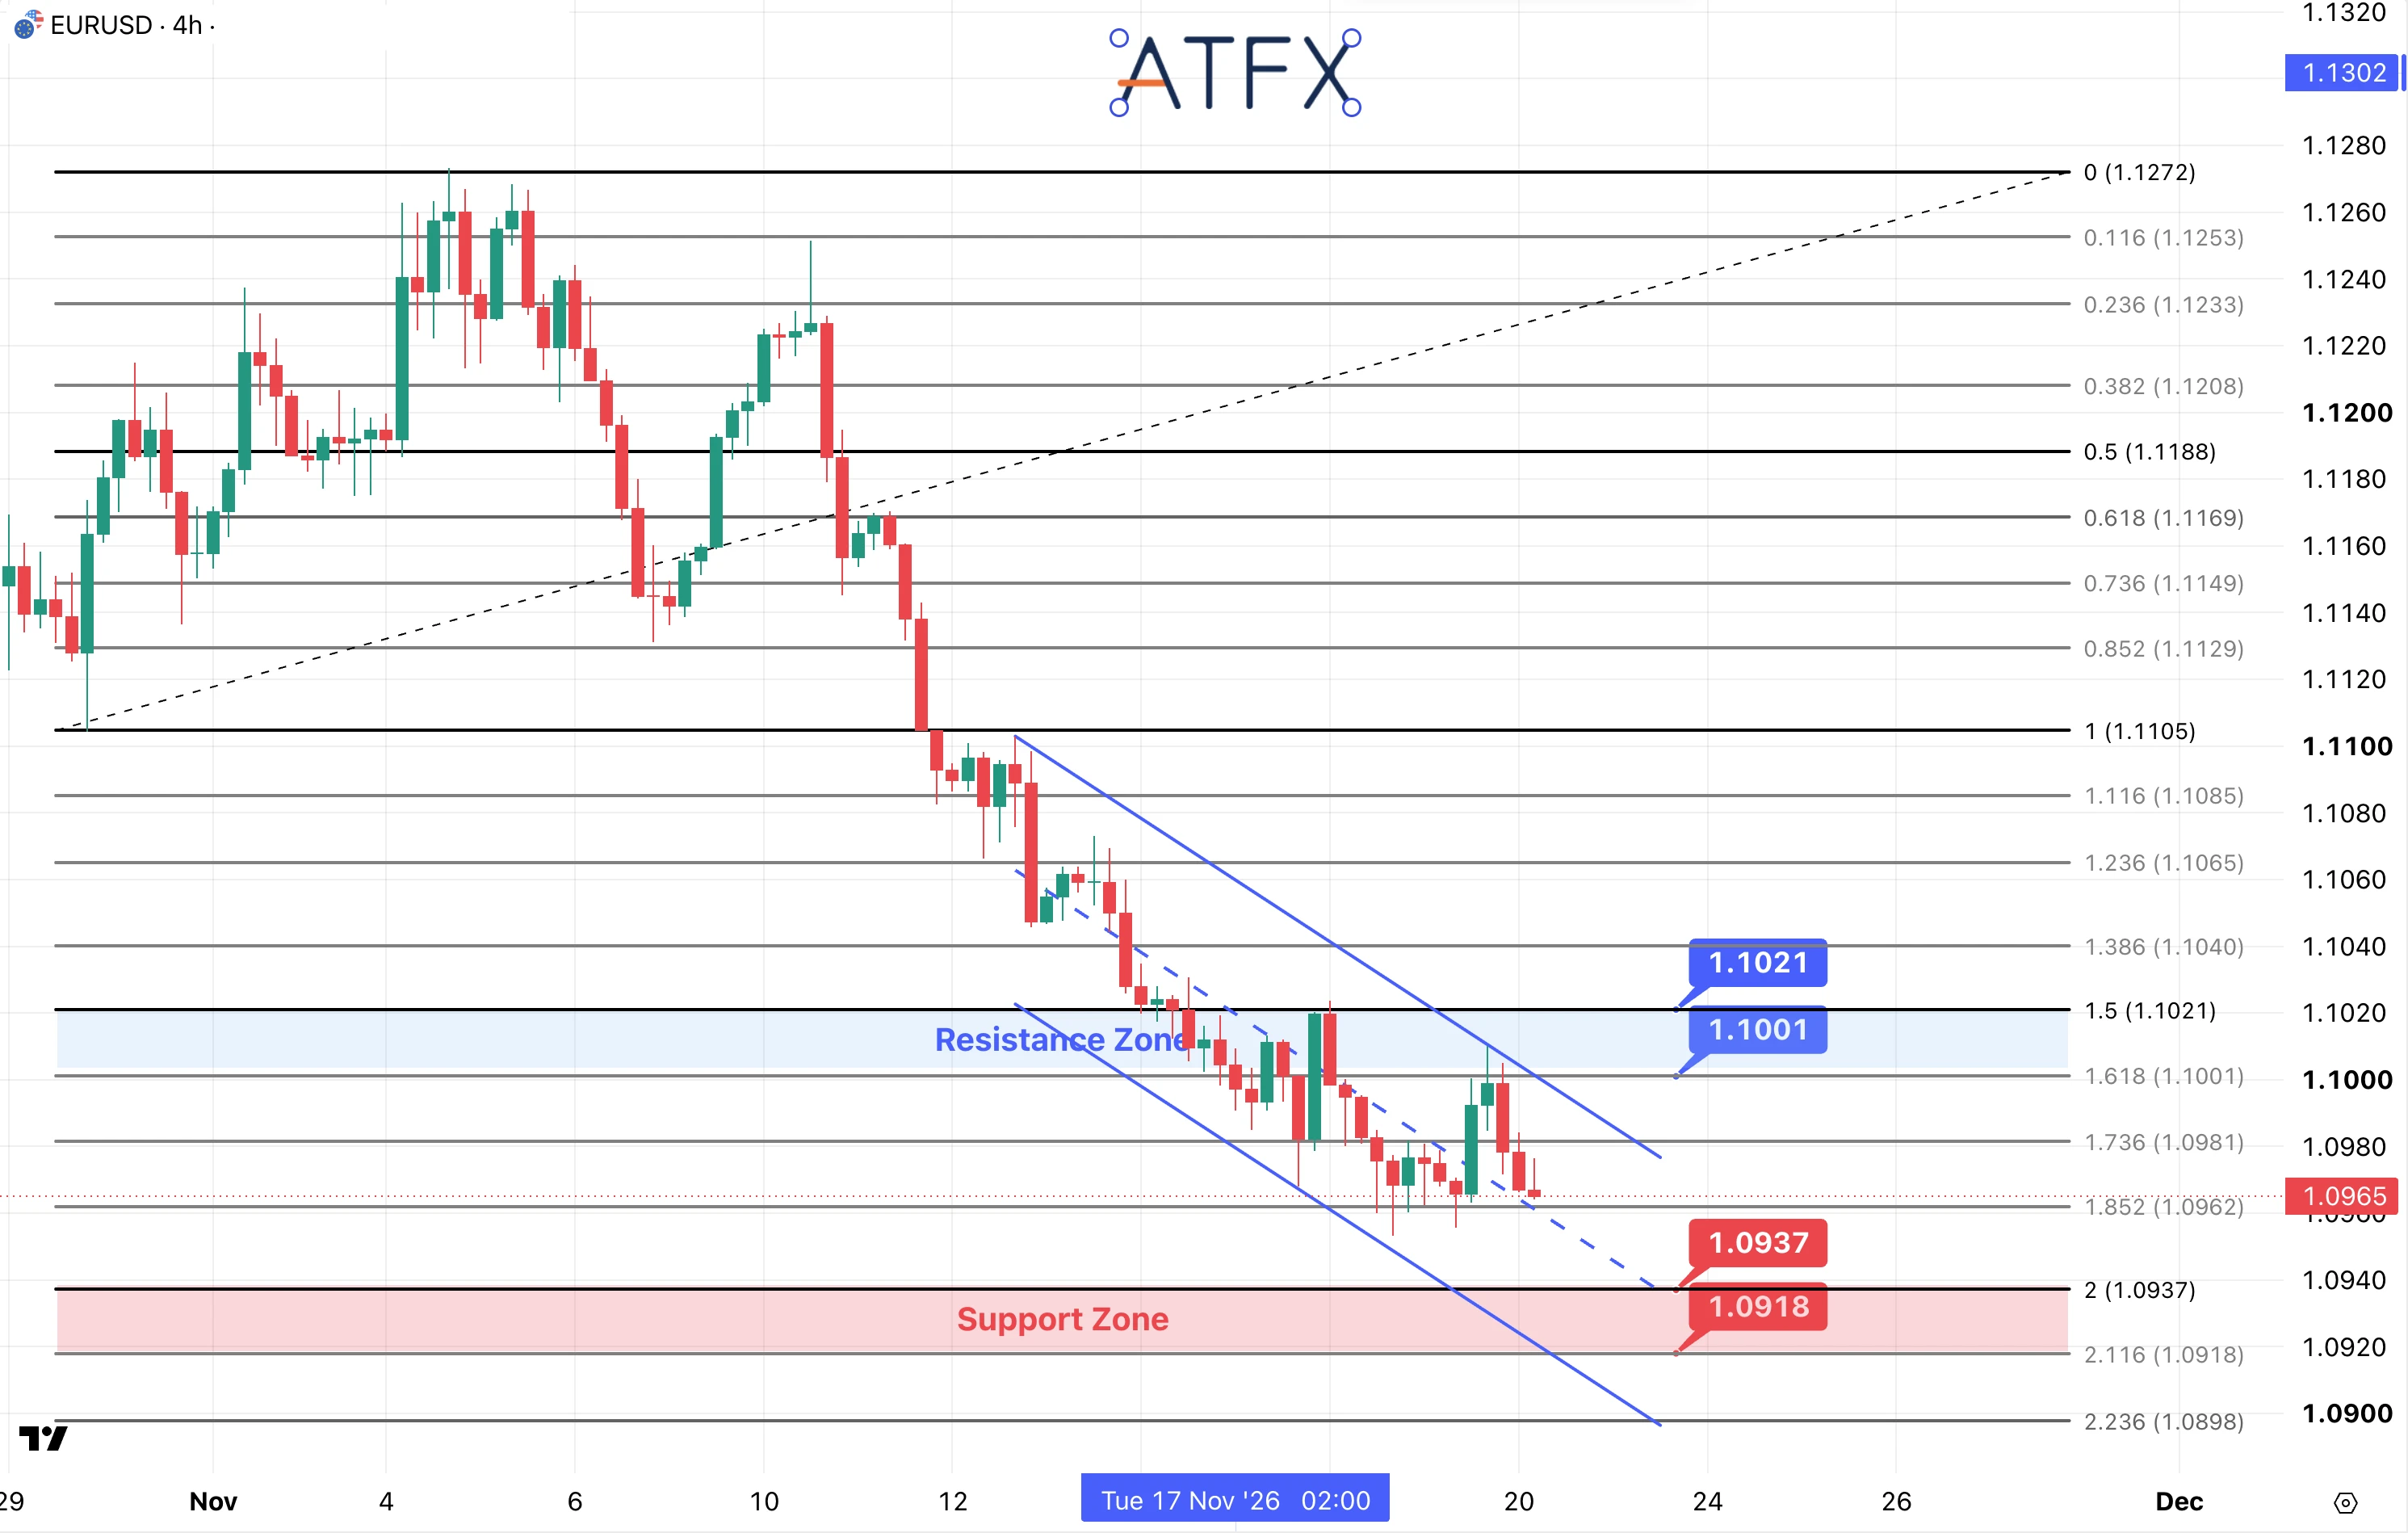
- Resistance: 1.1001 / 1.1021
- Support: 1.0937 / 1.0918
Analyst’s View: Weaker US jobless claims and manufacturing data failed to weaken the dollar. Calls for further ECB tightening offer some euro support, but dollar demand and Fed hike expectations remain dominant. Lagarde’s remarks and the US Michigan survey could change the balance.
EUR/USD is near 1.0965 after another failed recovery toward 1.1001. Price has fallen below 1.0981 and is testing 1.0962 near the descending channel’s midpoint. A break below 1.0962 and the recent lows around 1.0955 would expose 1.0937. Losing that floor would put 1.0918 in focus. Continued dollar strength favours repeated support tests.
Bias: Bearish
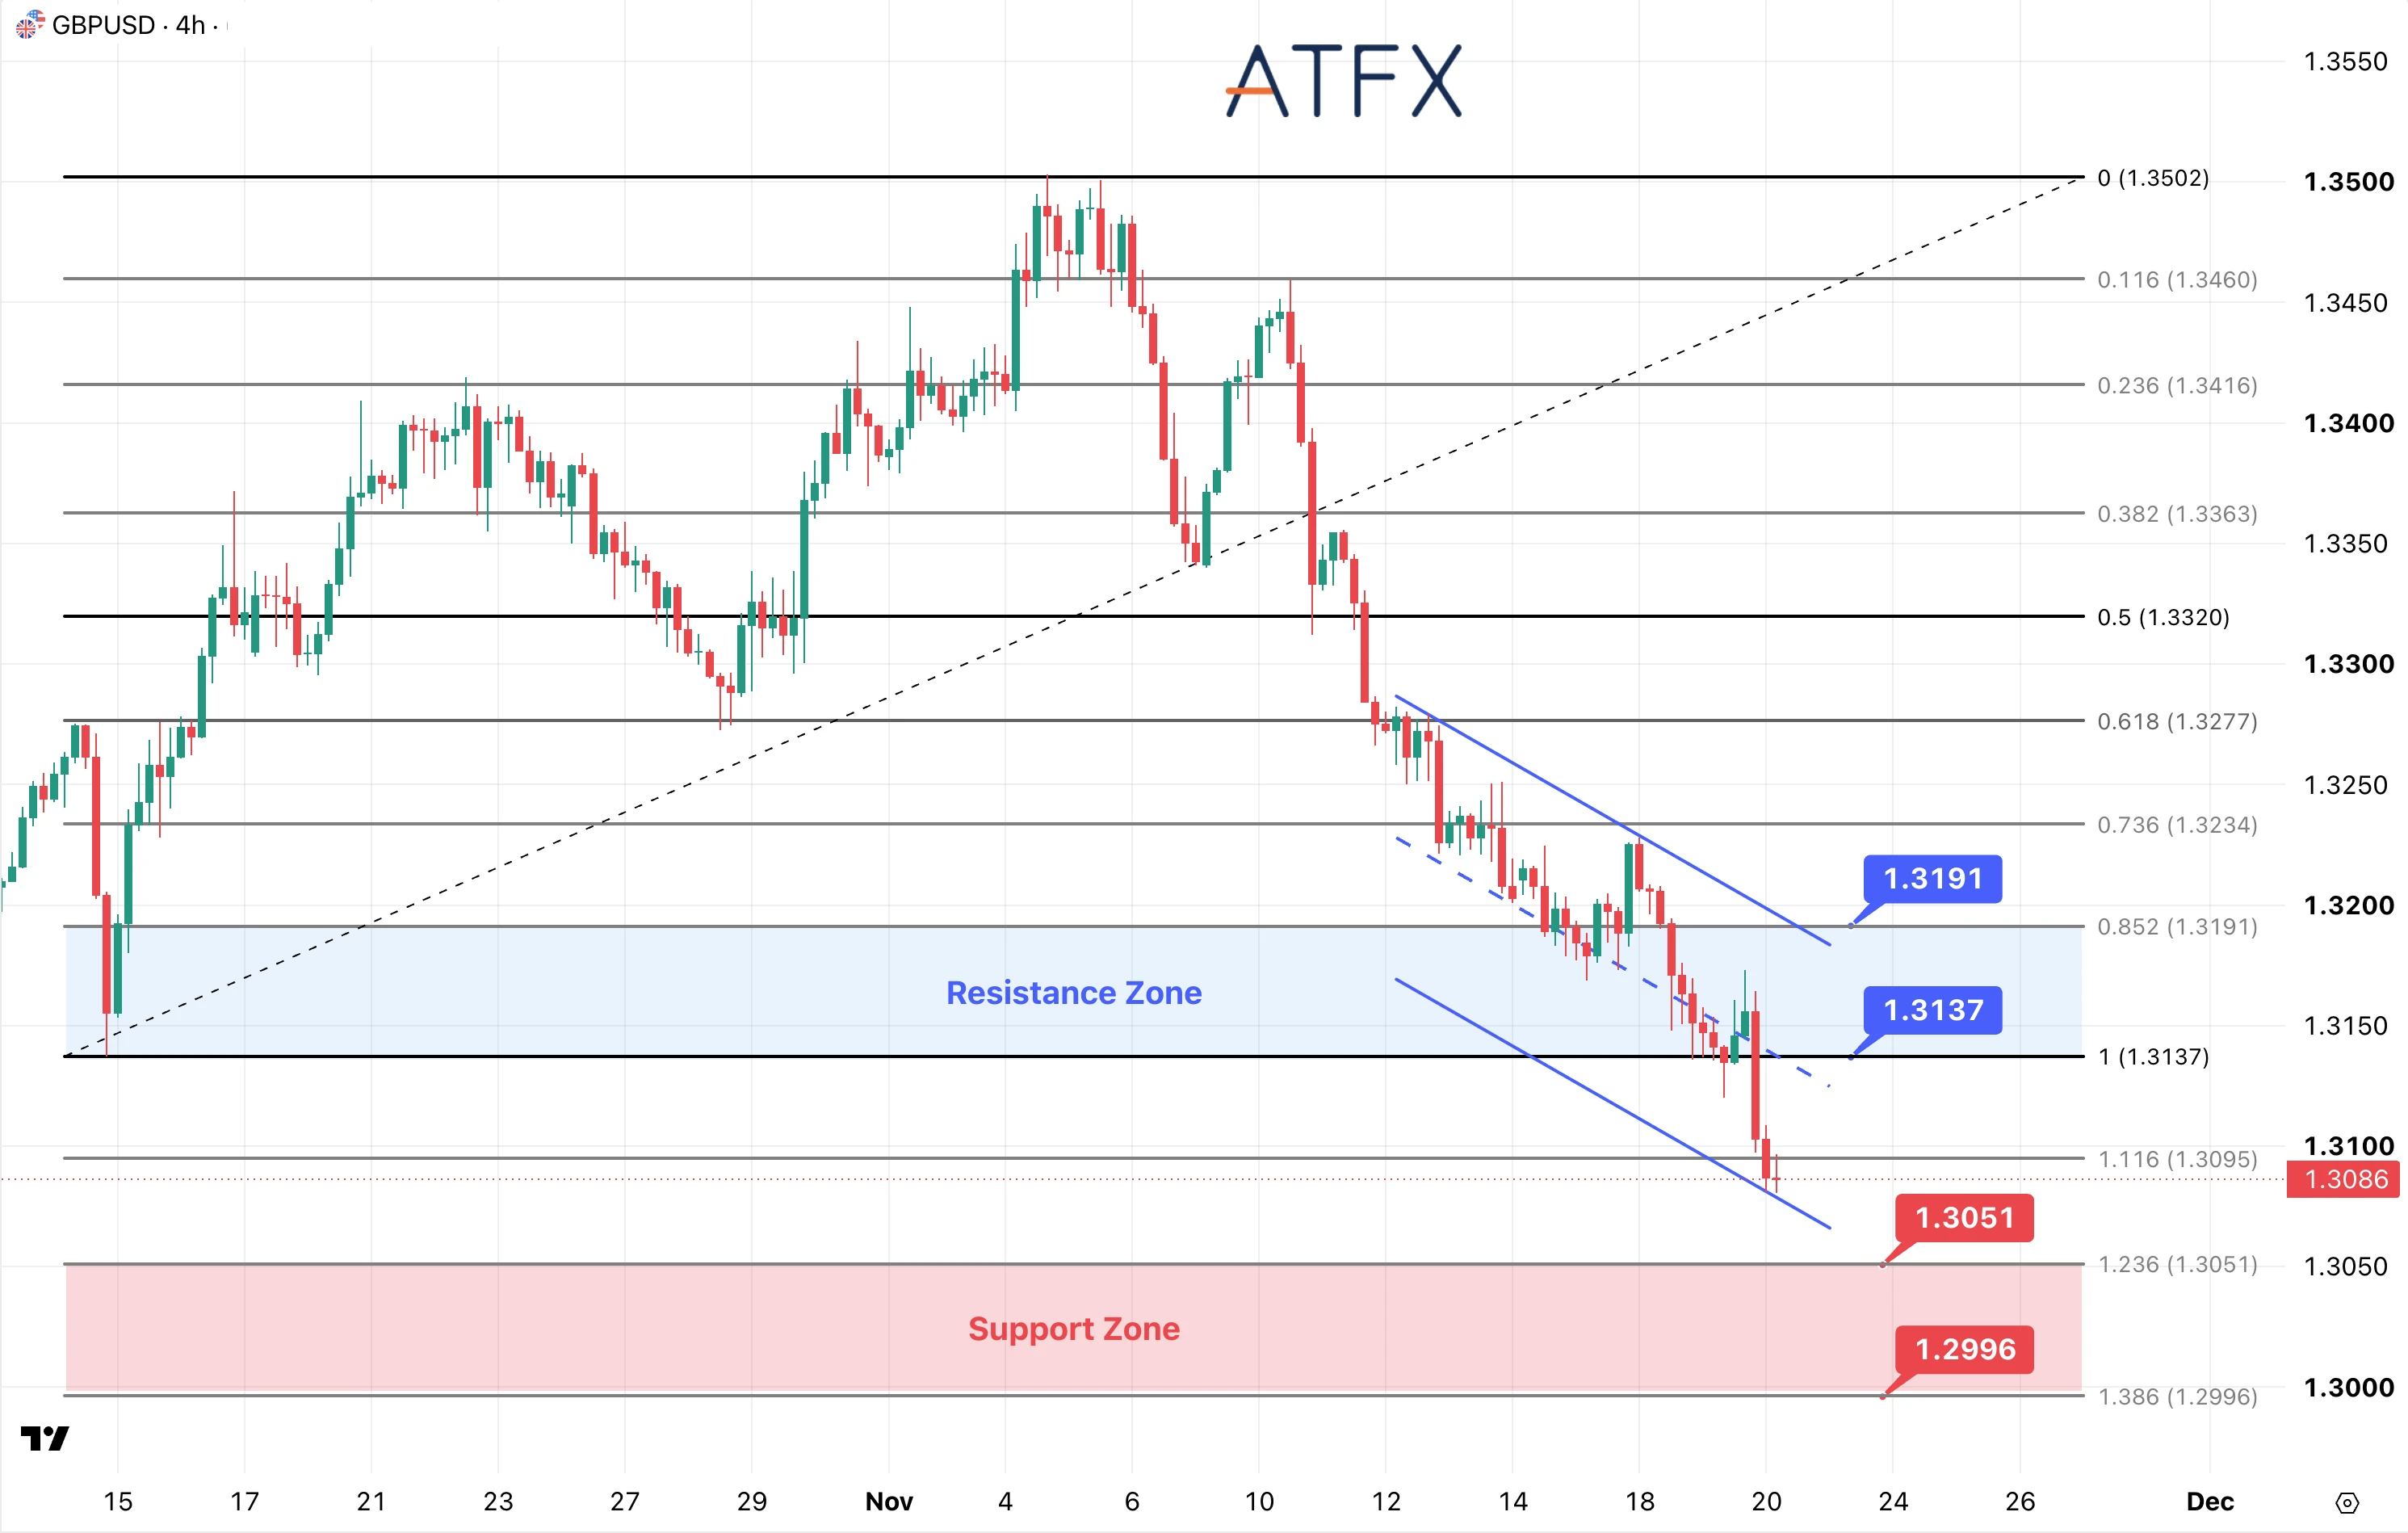
- Resistance: 1.3137 / 1.3191
- Support: 1.3051 / 1.2996
Analyst’s View: Sterling’s new 2026 low reflects broad dollar buying despite Greene’s argument for tighter BoE policy. The modest improvement in UK consumer confidence offers limited relief. October retail sales are forecast flat on the month after a 0.4% fall; a miss could deepen growth concerns.
GBP/USD is near 1.3086 after breaking 1.3137 and 1.3095. Price is approaching the descending channel’s lower boundary, with the latest rebound quickly reversed. The next marked support is 1.3051. Failure to hold the recent lows would expose 1.3051. A sustained break there would bring 1.2996 into view, close to the psychological 1.3000 level.
Bias: Bearish
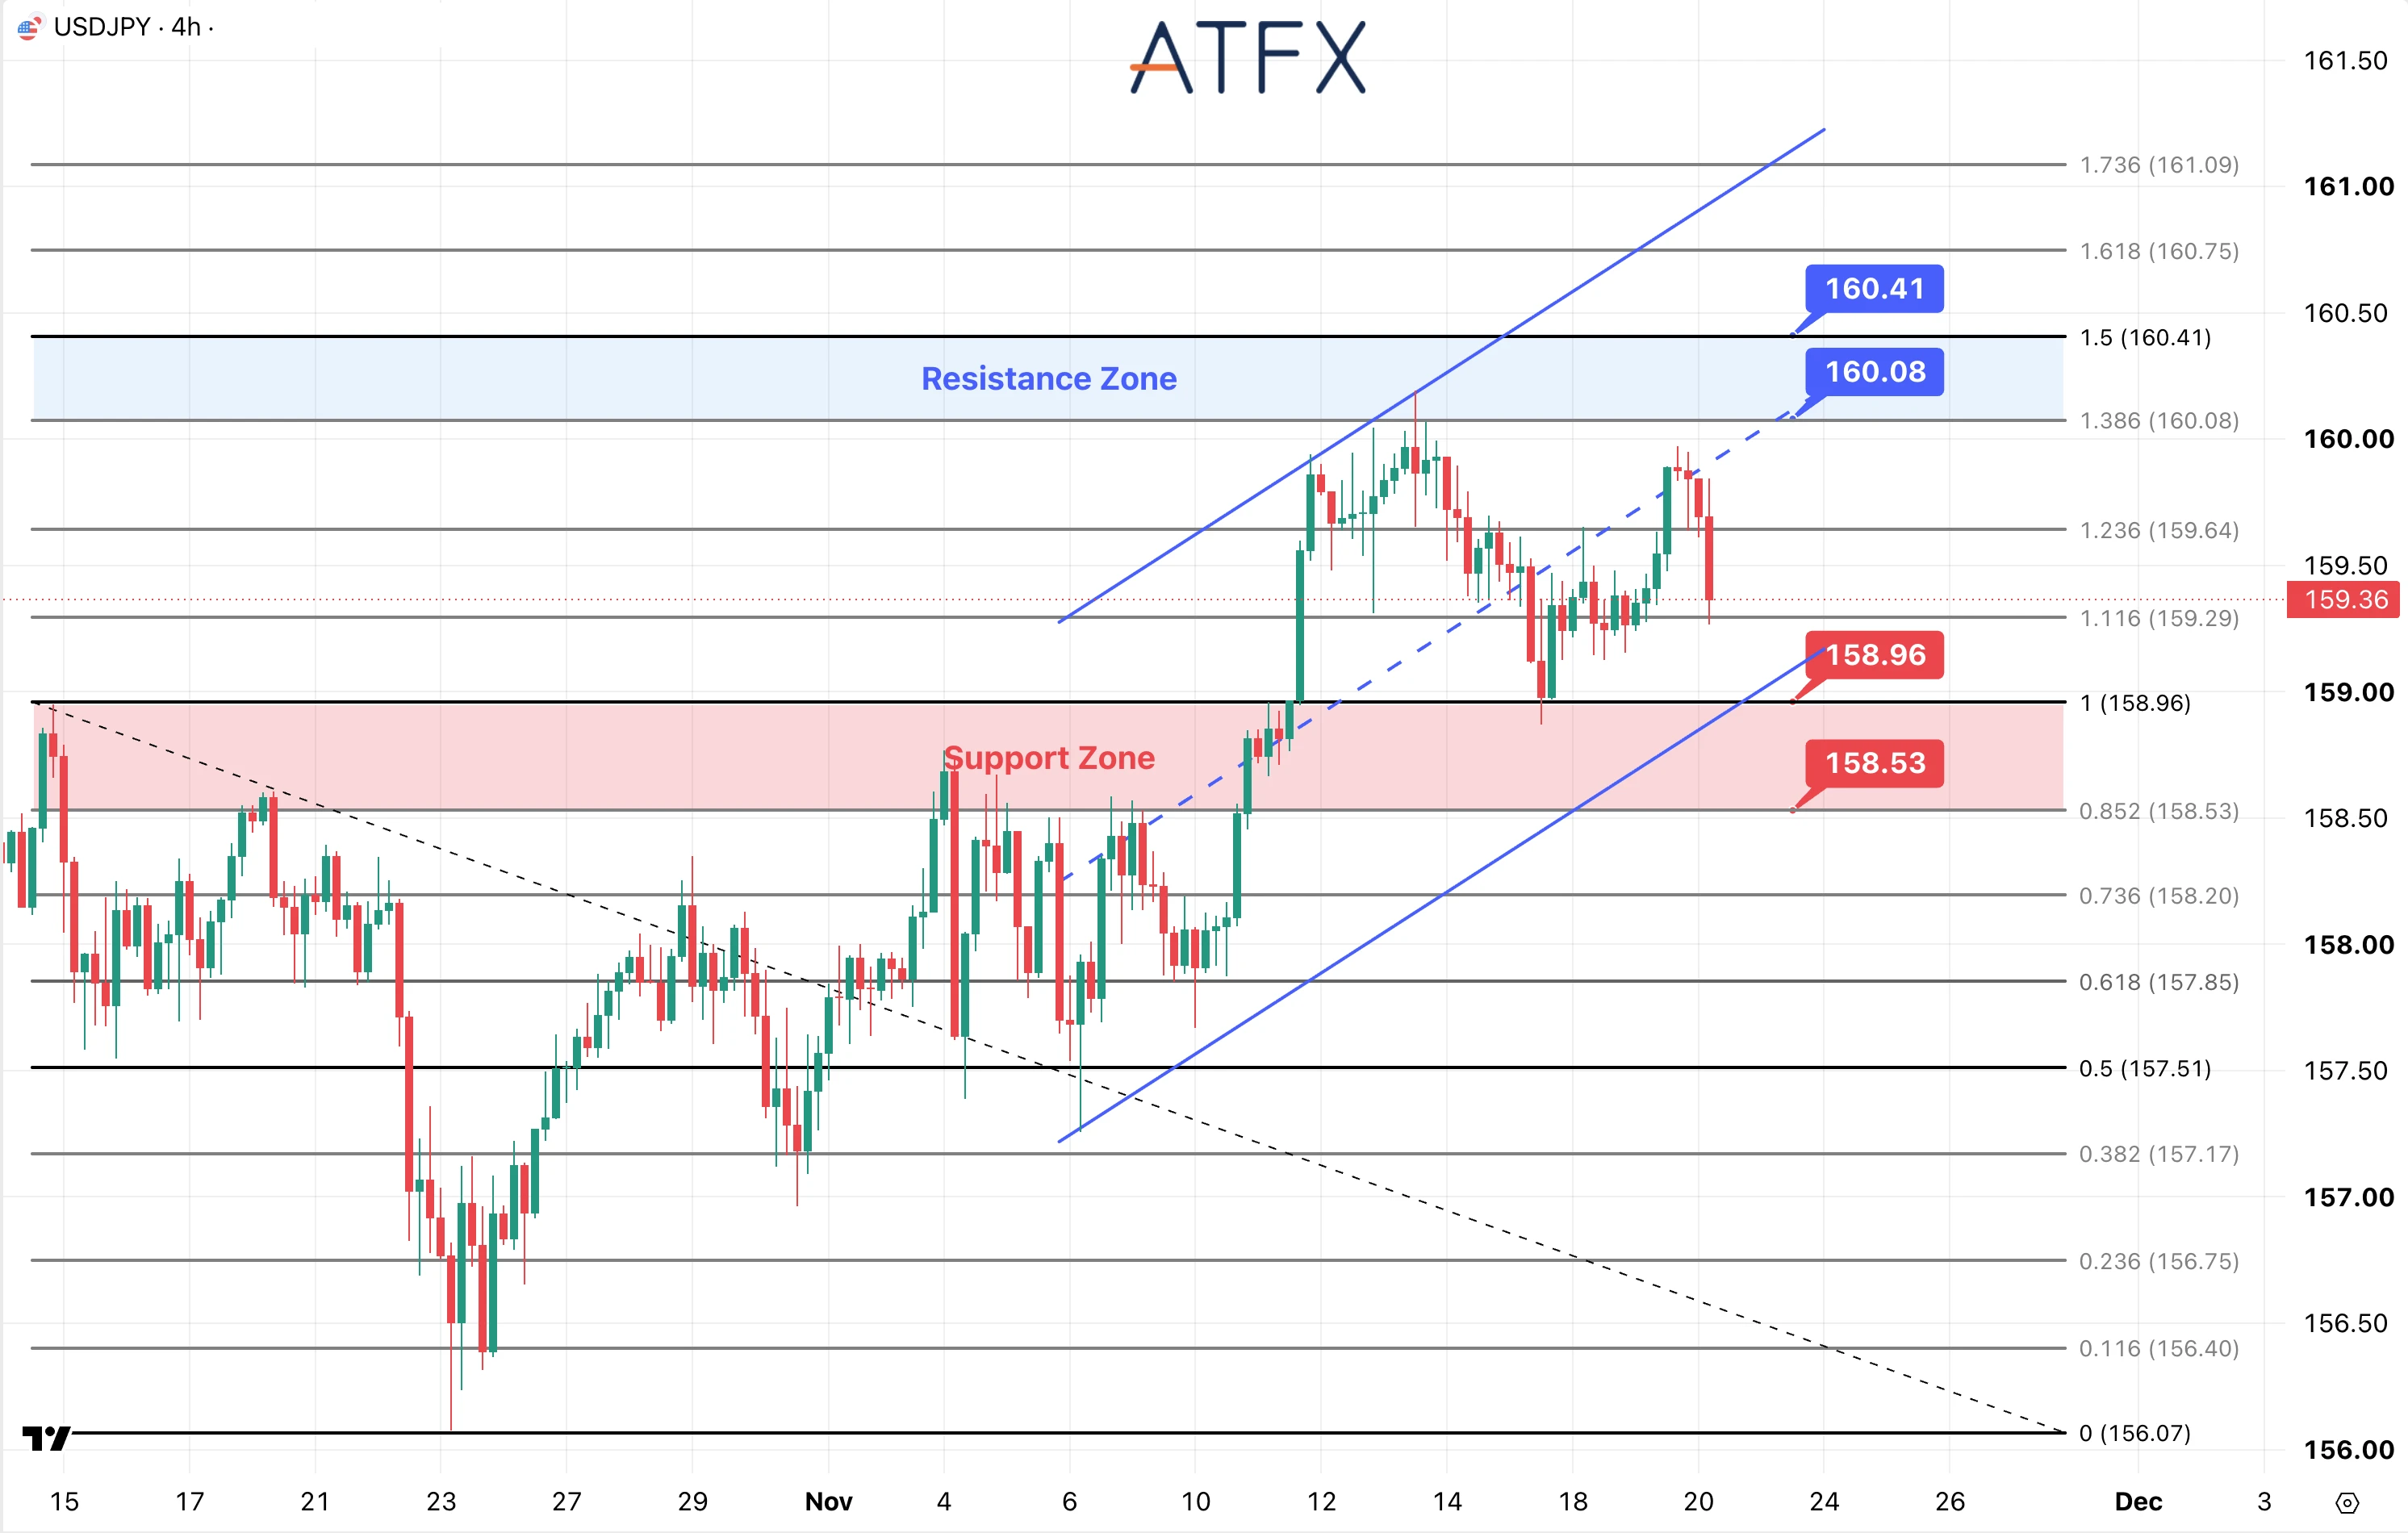
- Resistance: 160.08 / 160.41
- Support: 158.96 / 158.53
Analyst’s View: Japan’s October core CPI accelerated to 2.2% from 2.1%, although it missed the 2.3% forecast. That supports December BoJ hike expectations. Fed tightening still supports the dollar, while intervention concerns near 160 limit confidence in chasing USD/JPY higher.
USD/JPY is near 159.36 after a rebound toward 160 quickly reversed. Price is testing 159.29, with the rising channel’s lower boundary beneath it. The large bearish candle weakens the immediate recovery without yet breaking the broader channel. Below 159.29, watch 158.96, where horizontal support meets the rising channel area.
Bias: Cautiously bearish
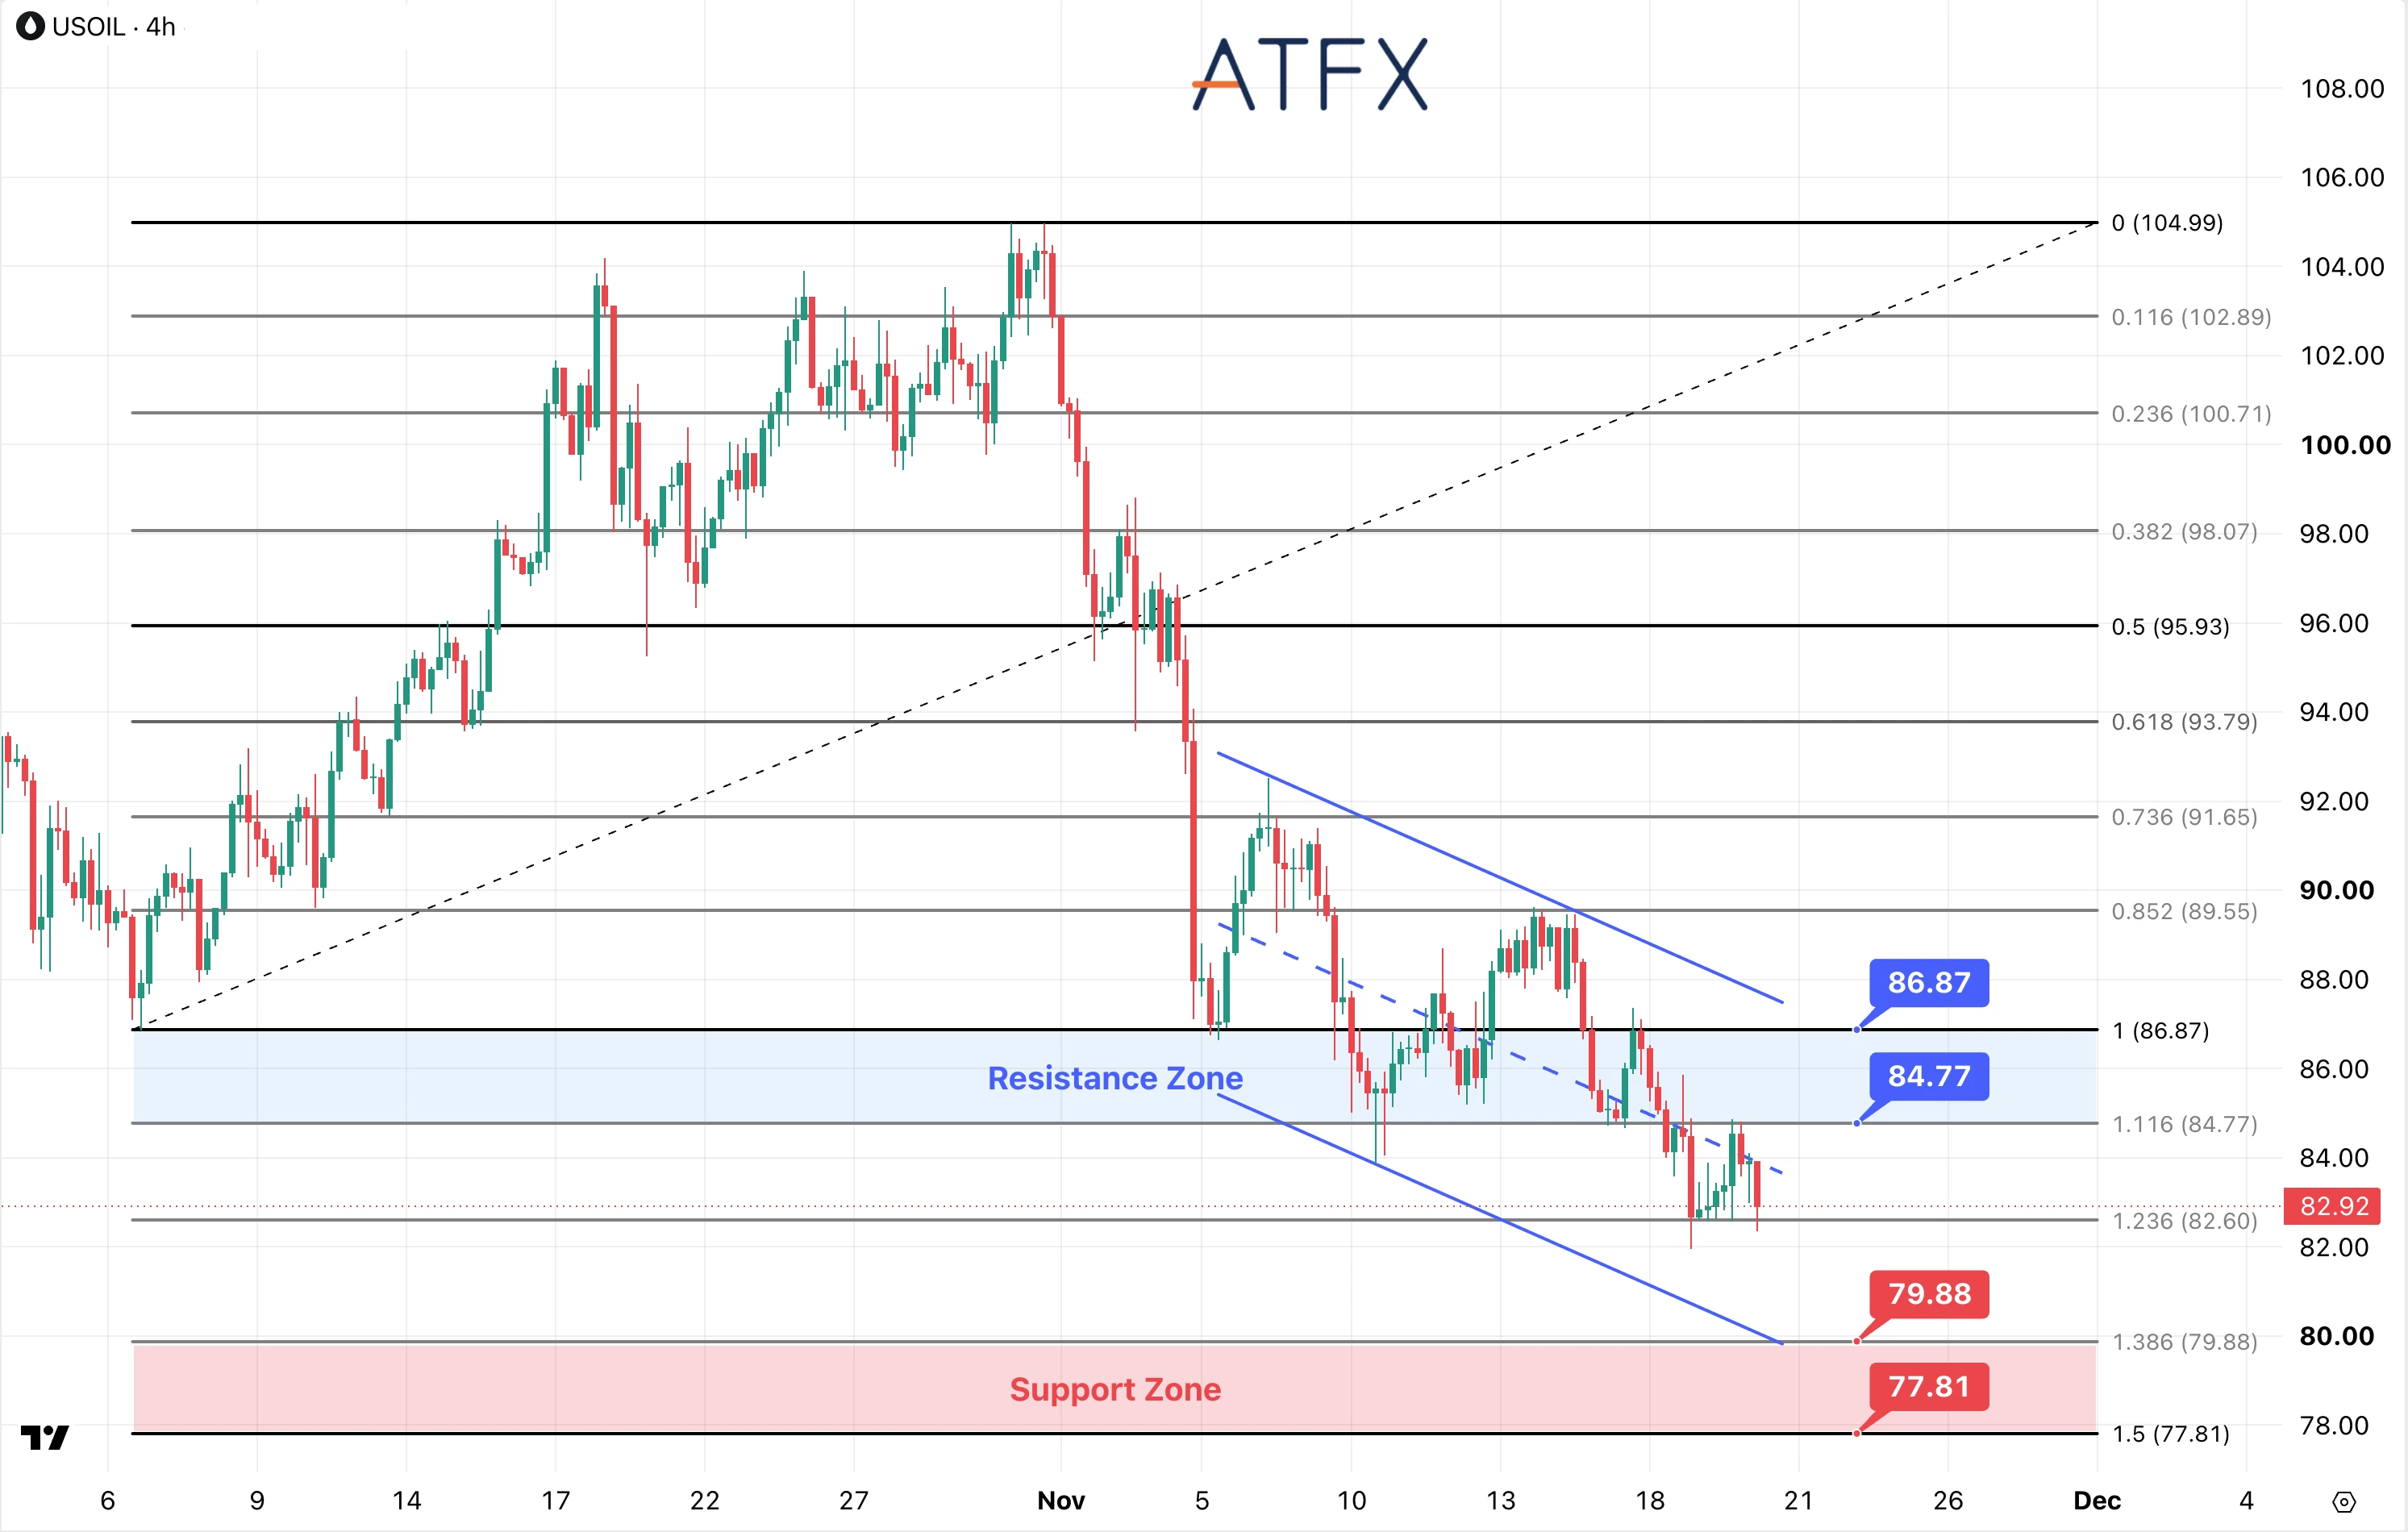
- Resistance: $84.77 / $86.87
- Support: $79.88 / $77.81
Analyst’s View: Fears of renewed US strikes on Iran and reported Hormuz disruptions support oil, while recovering supply and rising inventories limit gains. Today’s December WTI expiry may cause differences between futures quotes and the USOIL chart.
WTI is near $82.92 after failing at $84.77. Price is testing $82.60 inside a descending channel, showing that geopolitical headlines have yet to produce a sustained recovery. A break below $82.60 and the recent low near $82 would expose $79.88. Losing that support would bring $77.81 into focus.
Bias: Bearish
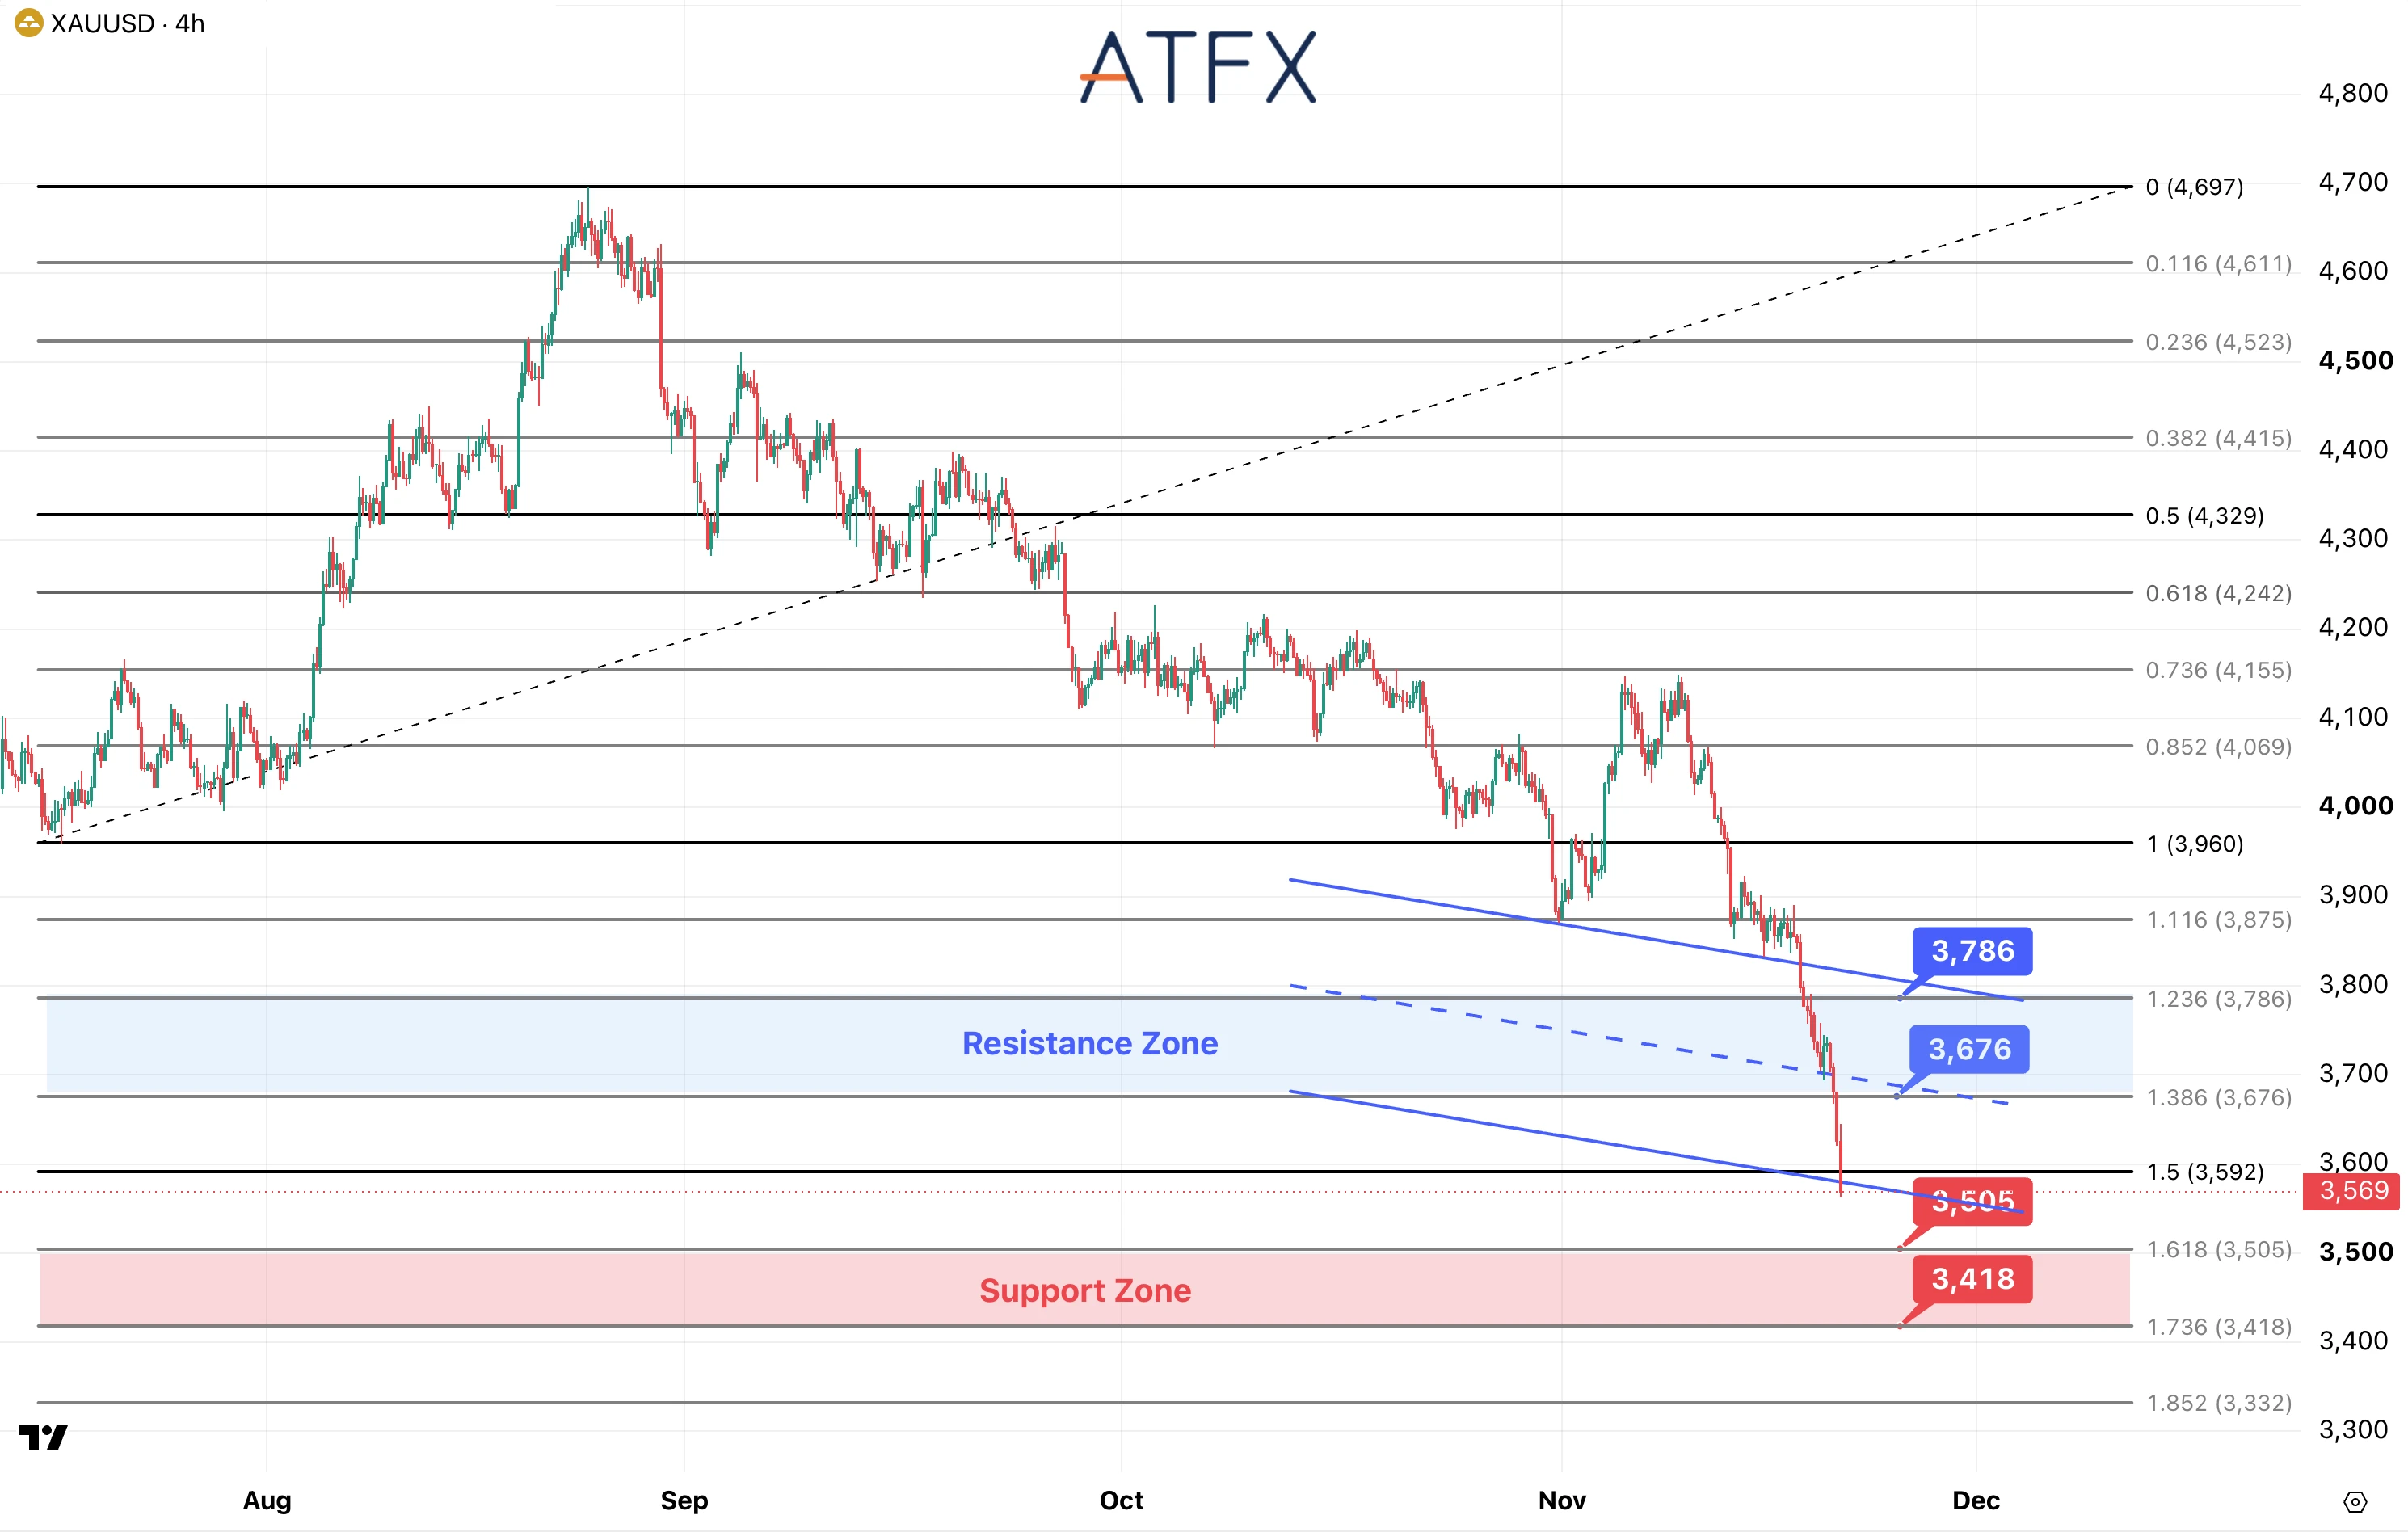
- Resistance: $3,676 / $3,786
- Support: $3,505 / $3,418
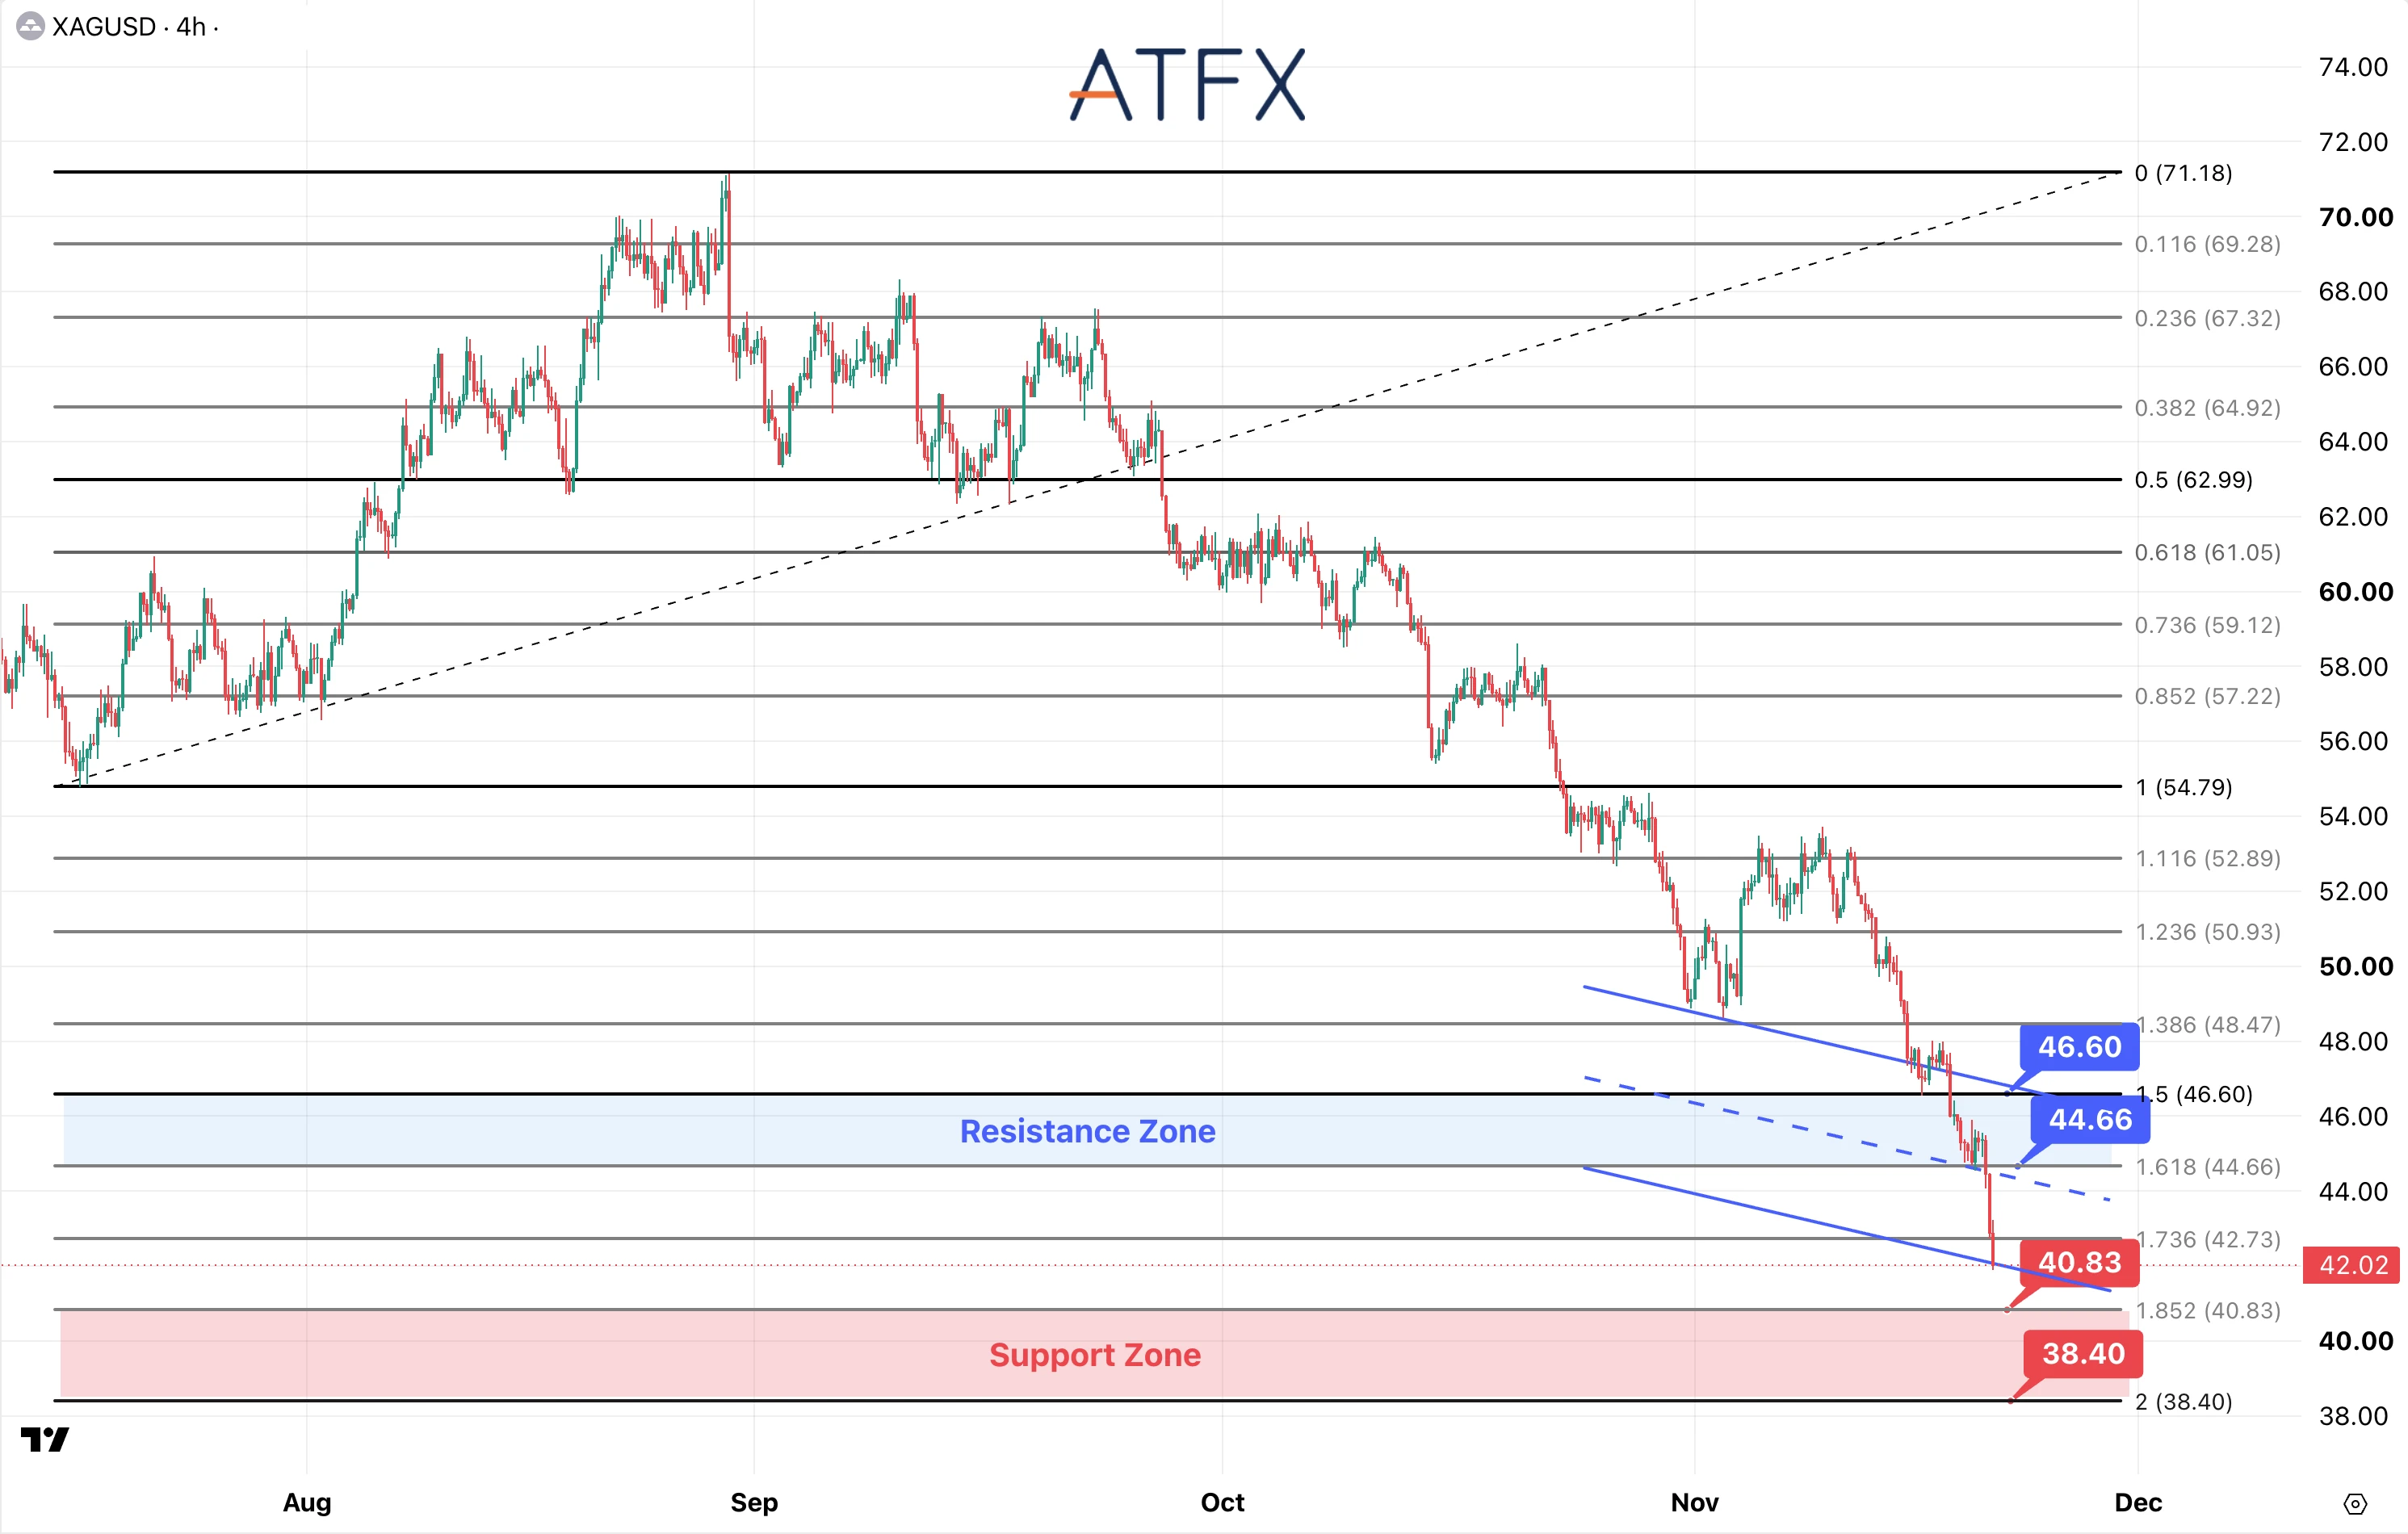
- Resistance: $44.66 / $46.60
- Support: $40.83 / $38.40
Analyst’s View: Gold is falling alongside equities as dollar strength and Fed hike expectations outweigh its defensive appeal. Its deep market also makes it a source of cash when investors face losses or higher margin requirements elsewhere. This liquidity interpretation helps explain weakness despite lower closing Treasury yields.
Gold is near $3,569 after breaking $3,676 and $3,592. Price is testing the descending channel’s lower edge after a rapid sequence of red candles, with no confirmed reversal. Failure to recover $3,592 leaves $3,505 exposed. A decisive break there would bring $3,418 into view.
Silver is near $42.02 after breaking $44.66 and $42.73. The wider four-hour chart shows a prolonged decline, with the latest drop reaching the lower boundary of a descending channel. The $40.83–$38.40 support zone is now in view. Continued trading below $42.73 keeps $40.83 vulnerable. Failure there would expose $38.40.
Bias: Gold & Silver Bearish
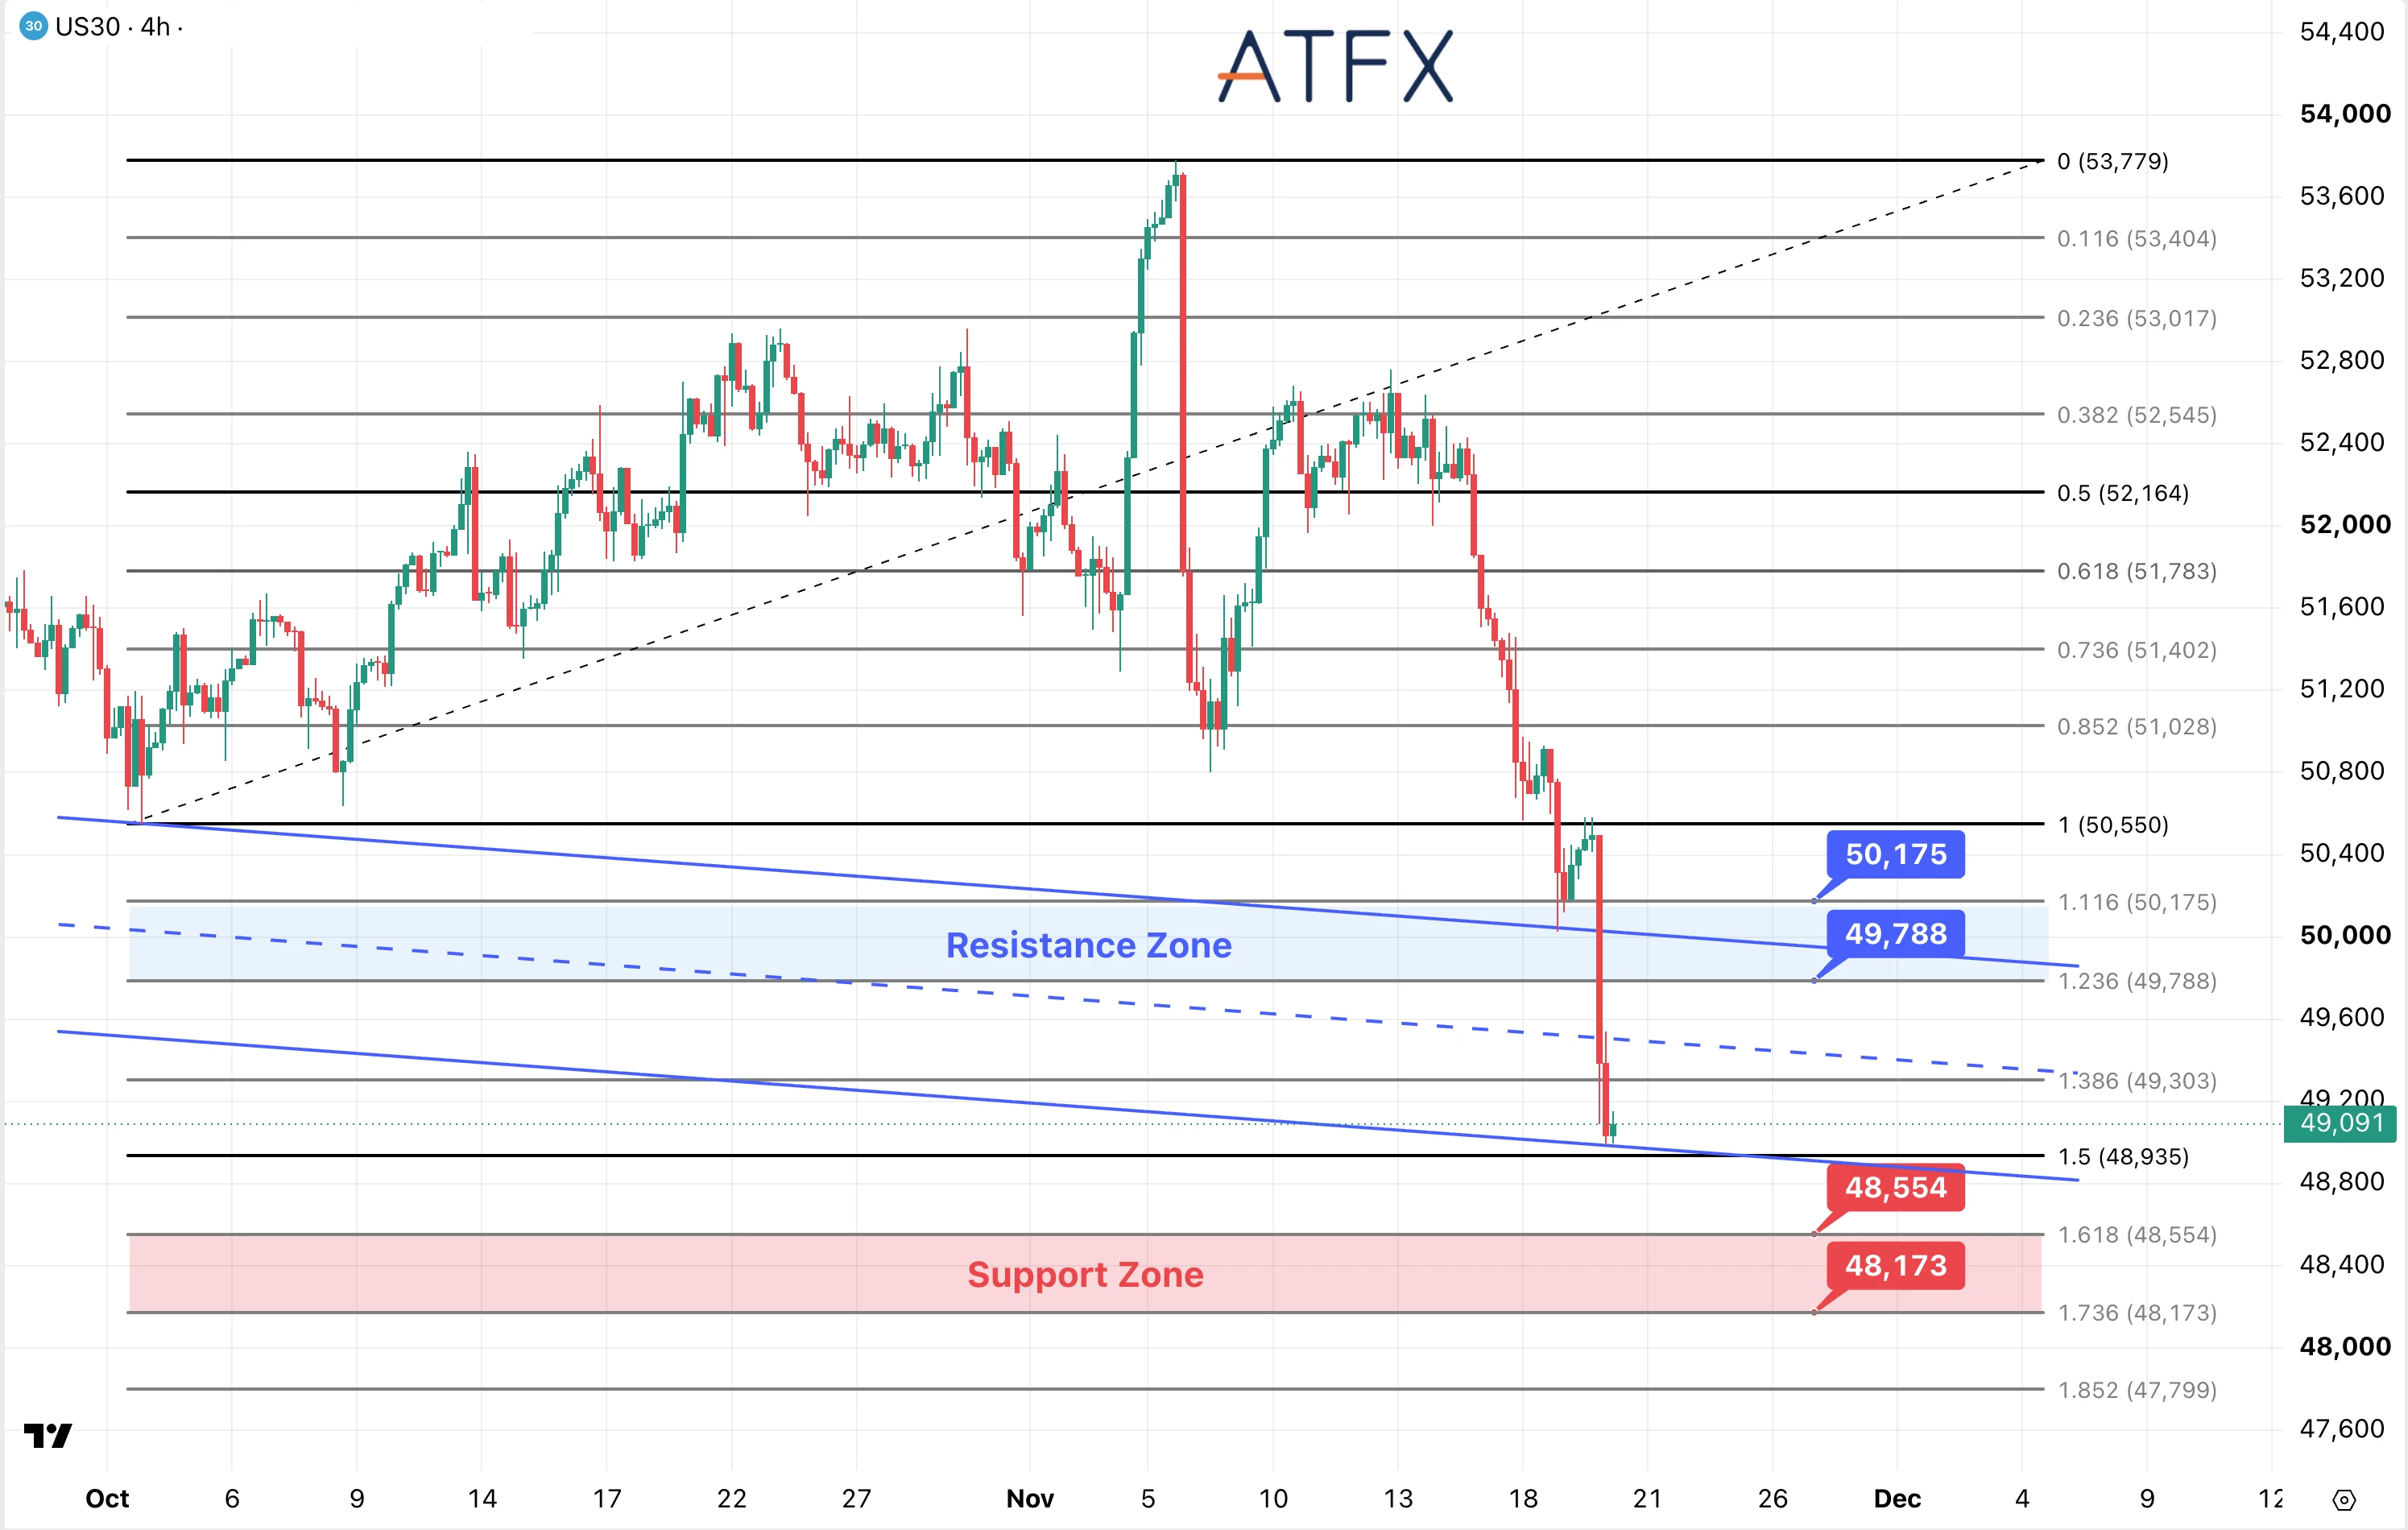
- Resistance: 49,788 / 50,175
- Support: 48,554 / 48,173
Analyst’s View: The cash Dow lost more than 1,100 points as selling spread beyond technology. ANT’s positive debut failed to support broader confidence. With the S&P 500 also below its 200-day average, investors need evidence of wider buying before treating an index rebound as a durable recovery.
US30 is near 49,091 after a recovery toward 50,550 reversed sharply. Price broke 50,175, 49,788 and 49,303 before pausing near 48,935 at the descending channel’s lower boundary. A small green candle shows limited stabilisation after the selloff. A sustained break below 48,935 would expose 48,554.
Bias: Bearish
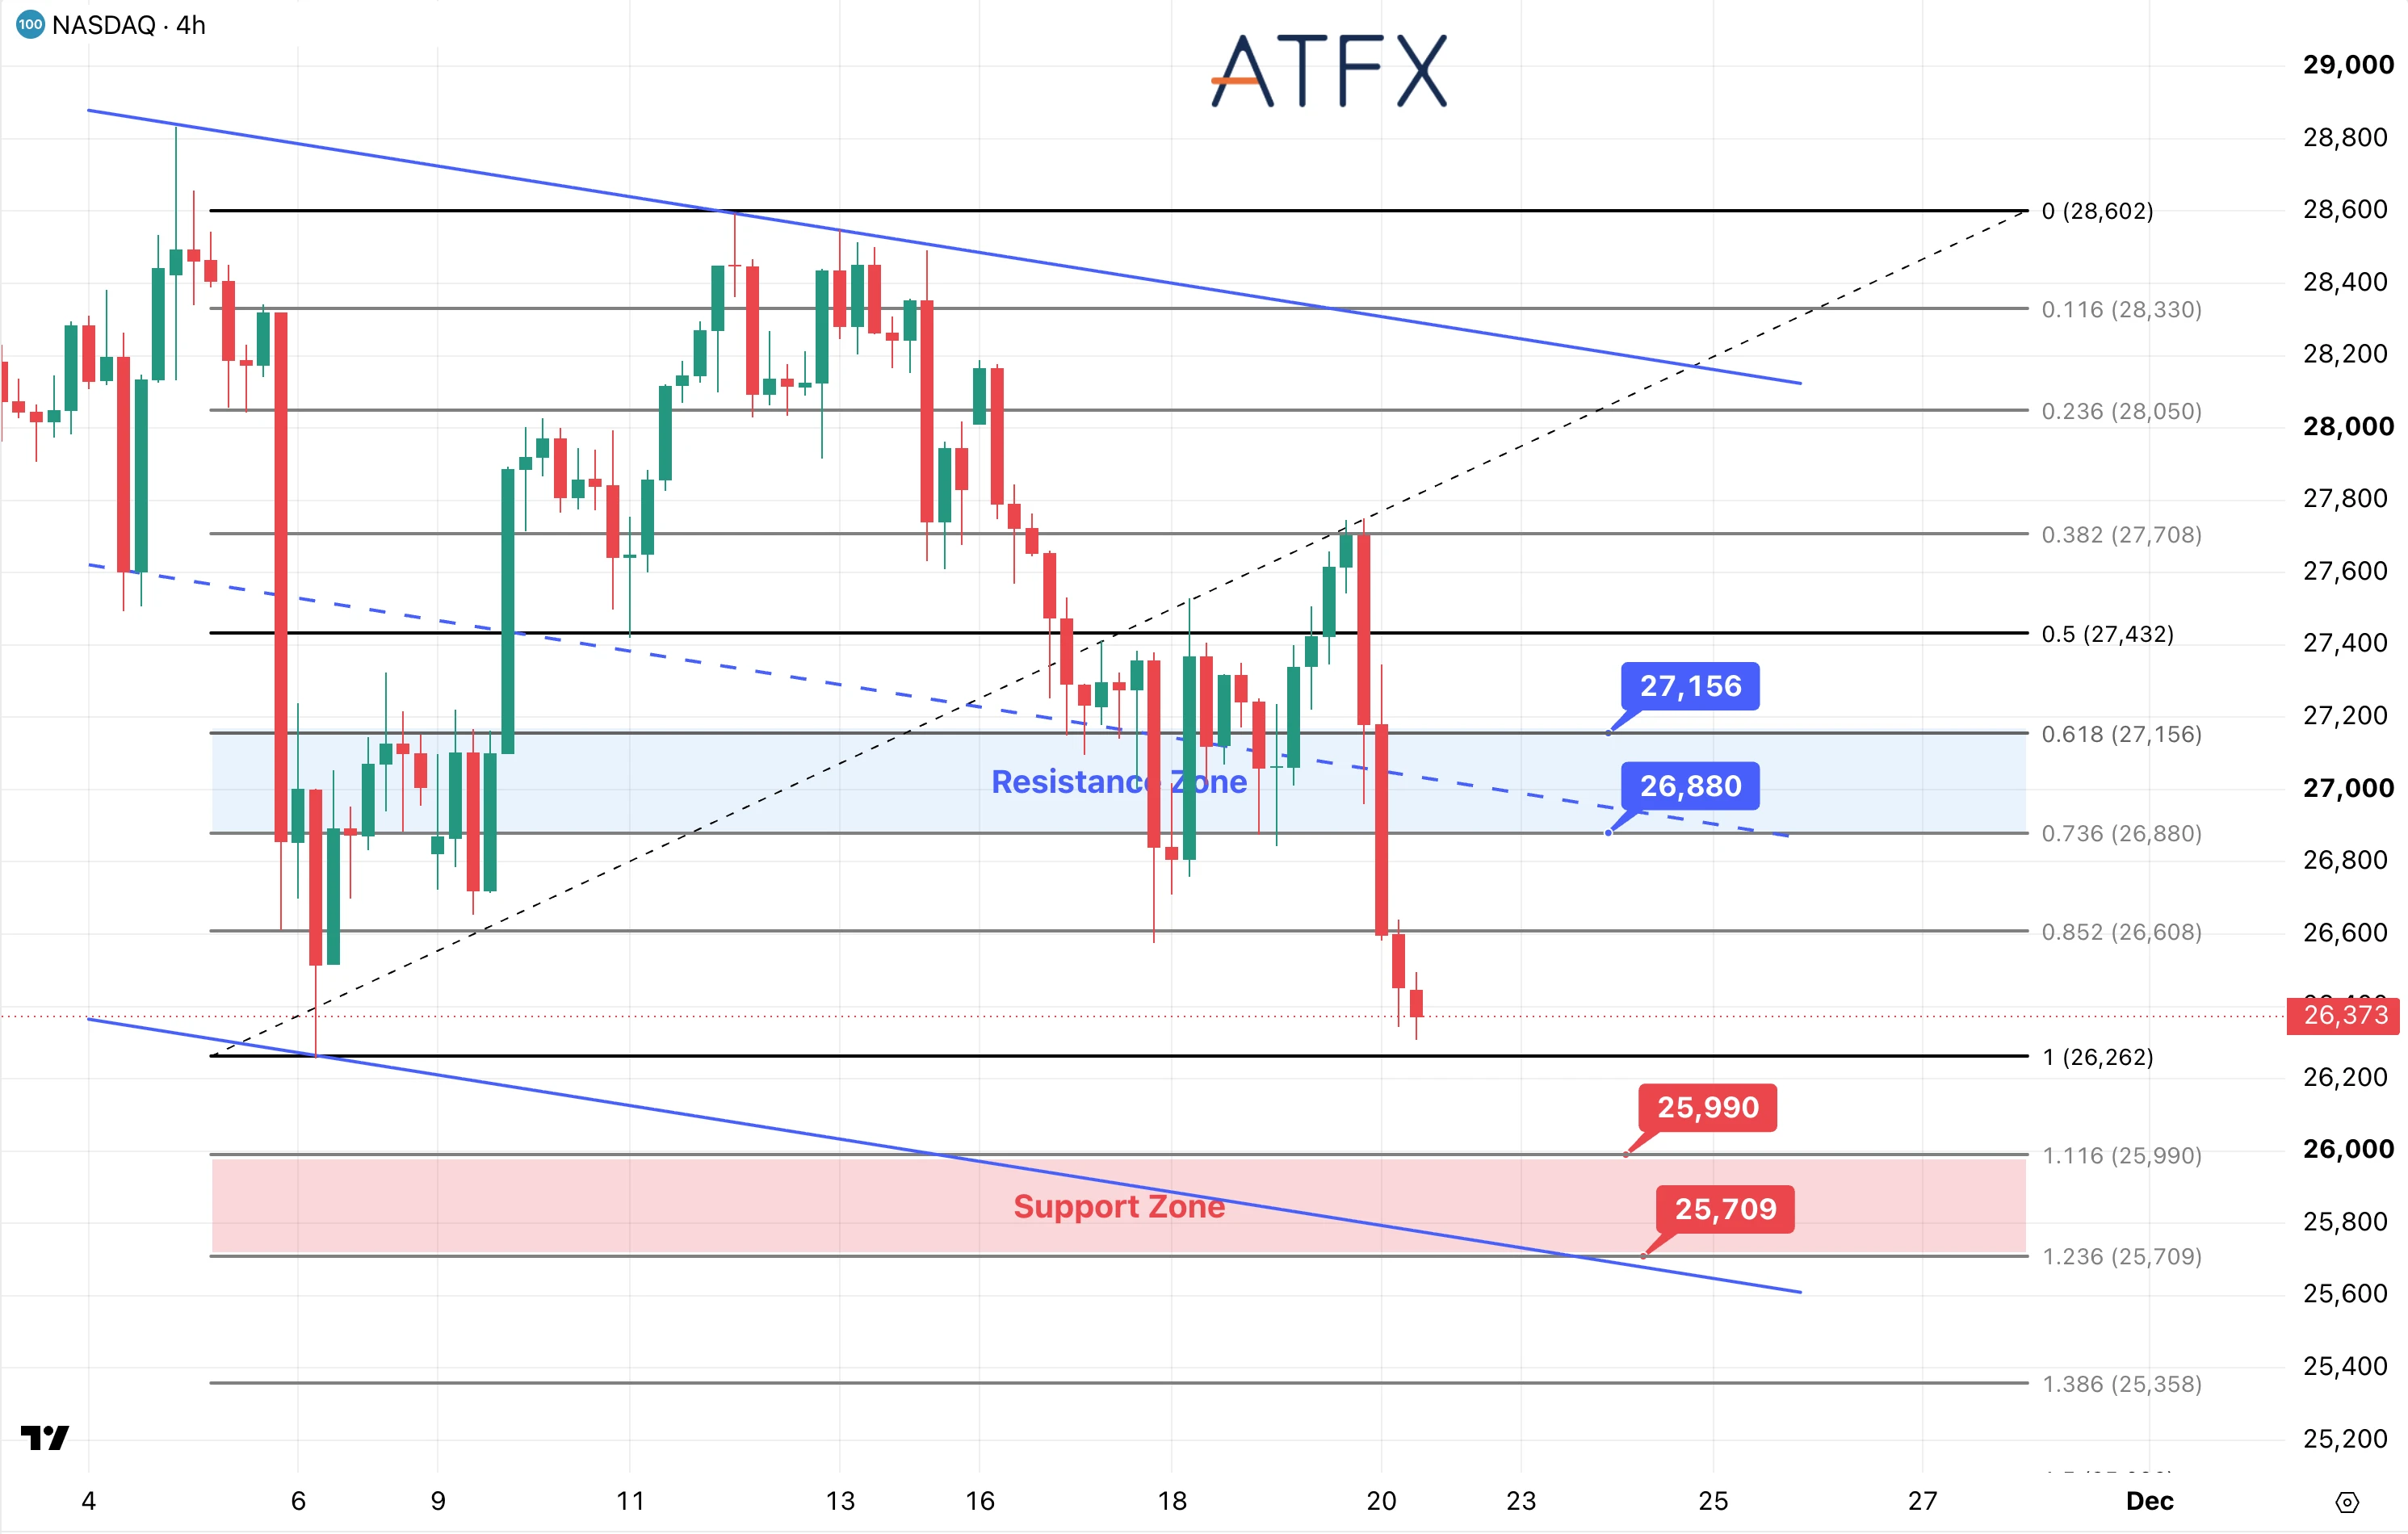
- Resistance: 26,880 / 27,156
- Support: 25,990 / 25,709
Analyst’s View: ANT closed above its offer price but faded from its opening trade. Nvidia and other AI-linked shares continued falling, showing that demand for one new listing has not repaired concerns about financing costs and future AI returns.
NAS100 is near 26,373 after a rebound to 27,708 collapsed. Price broke 27,156, 26,880 and 26,608 in quick succession and is approaching the 26,262 swing low. The descending channel remains intact, with former support now overhead. A decisive break below 26,262 would expose 25,990. Continued selling could reach 25,709 near the lower channel.
Bias: Bearish
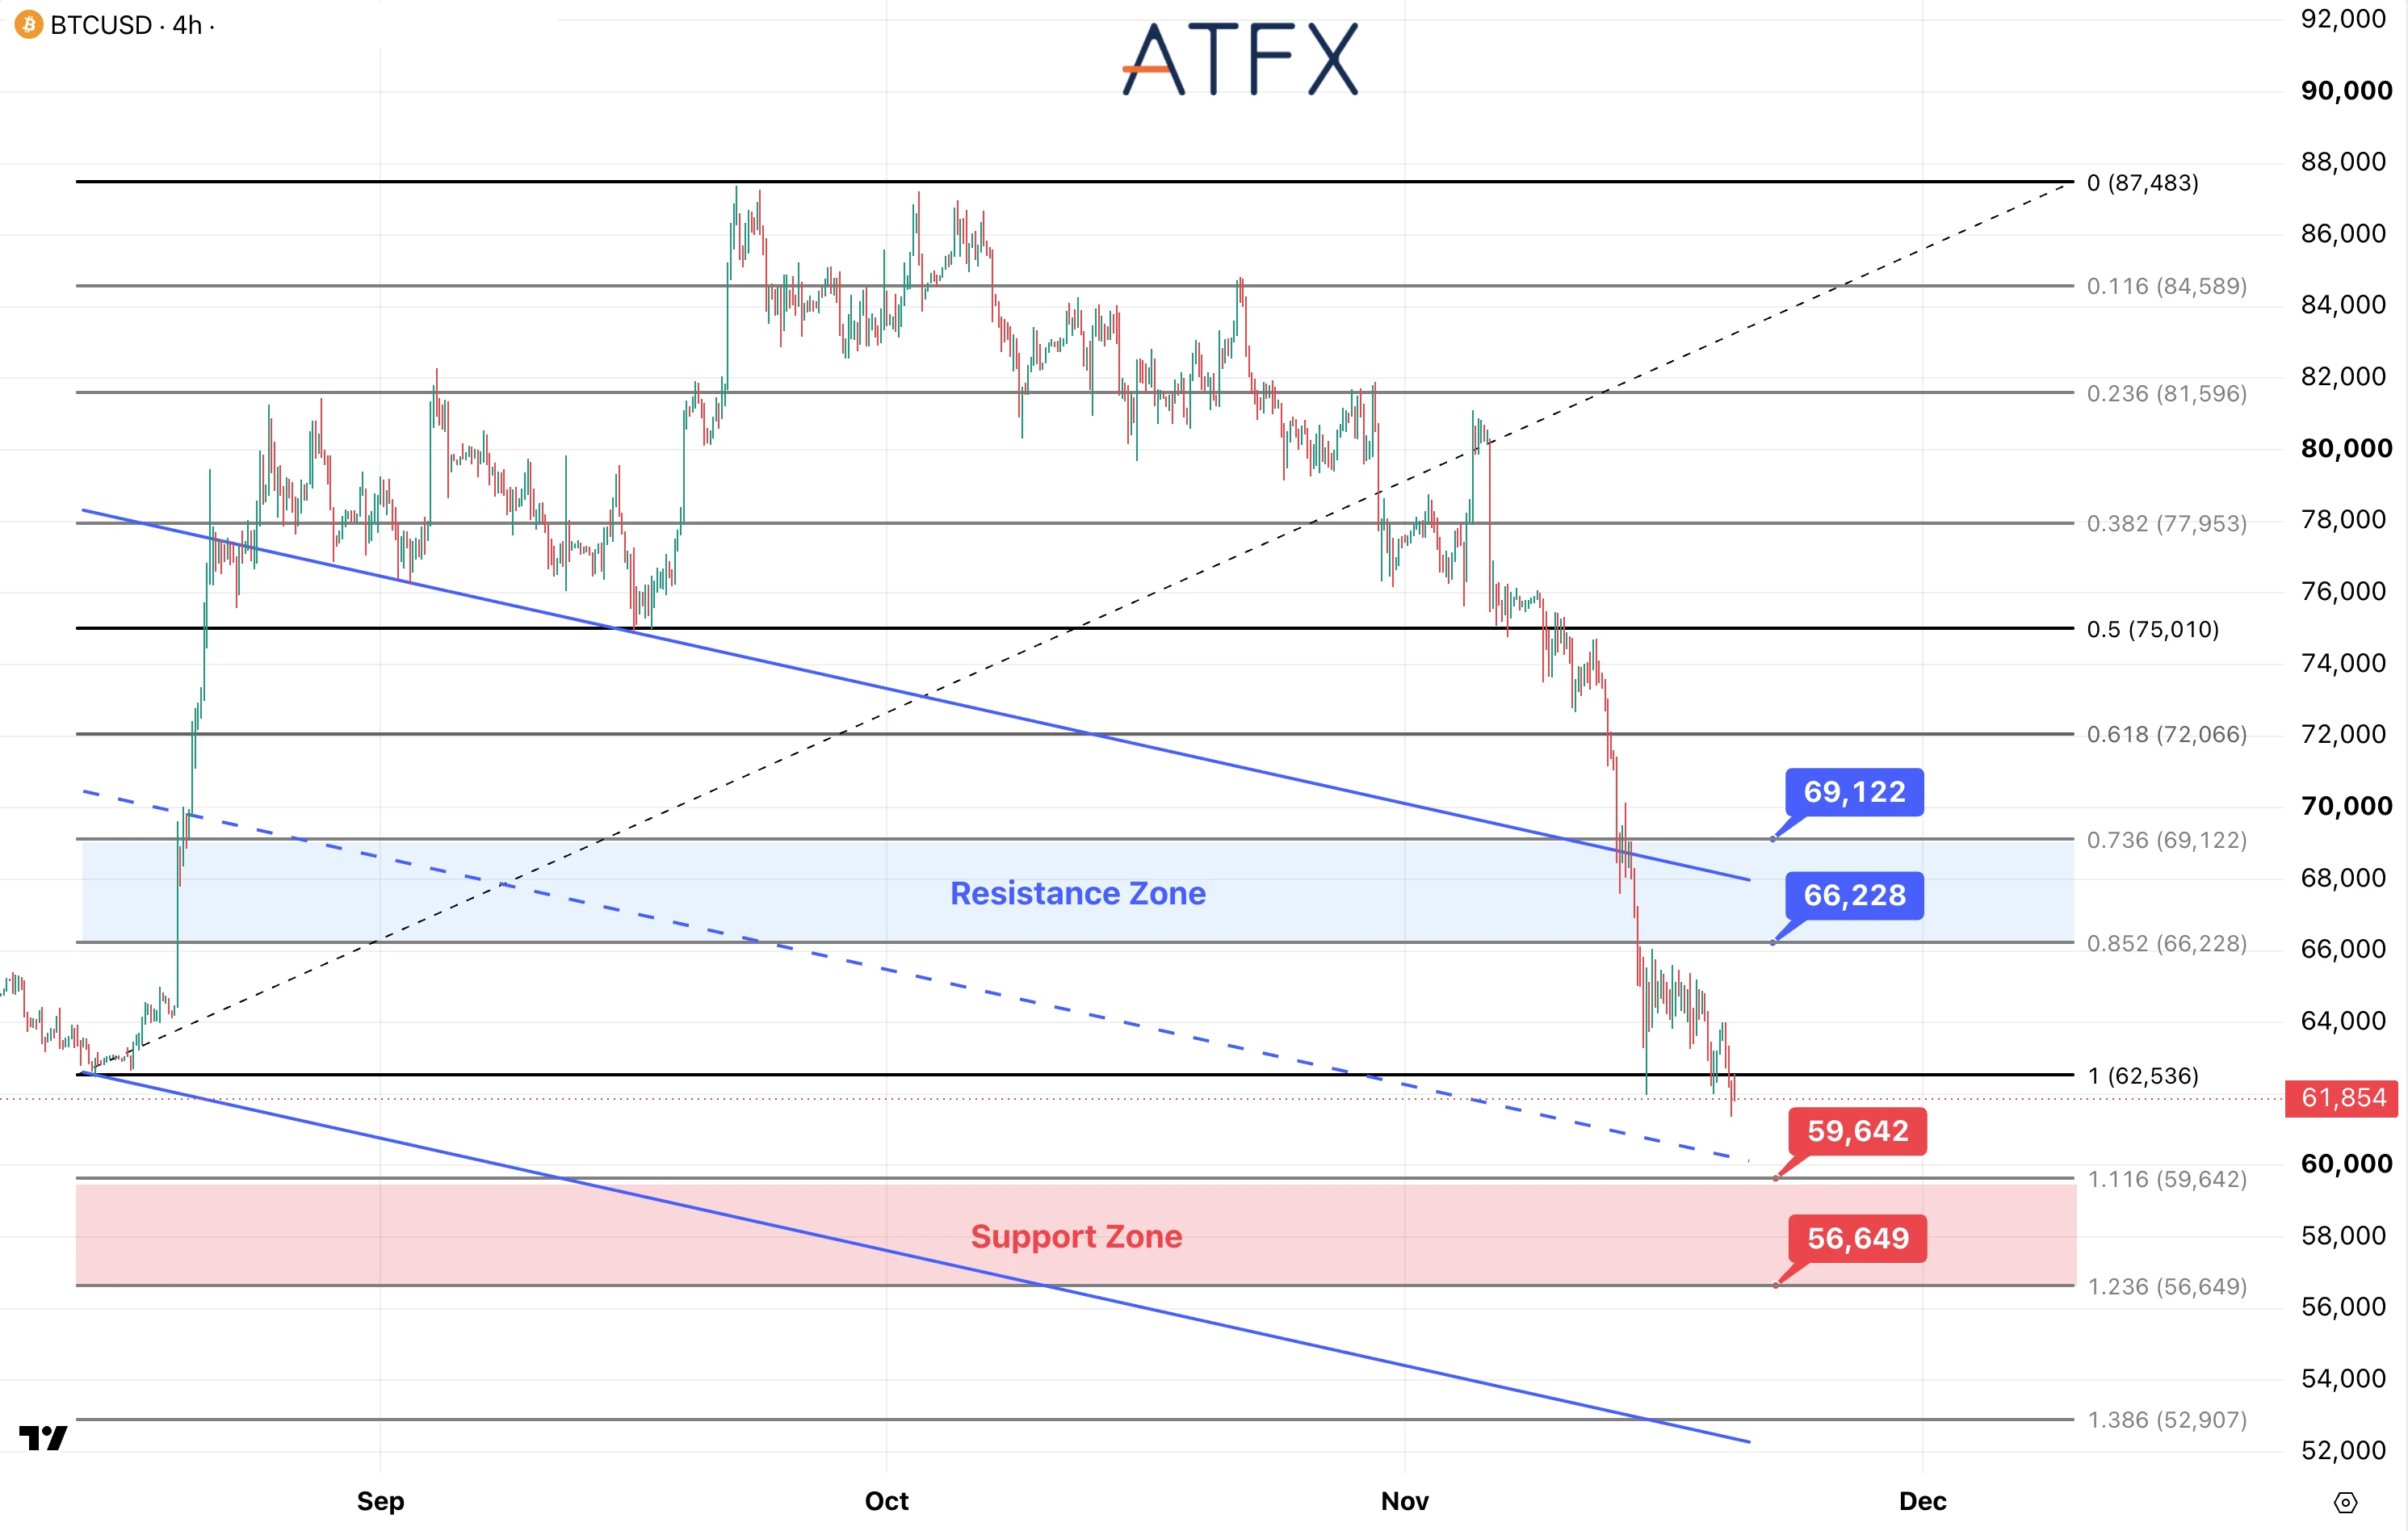
- Resistance: $66,228 / $69,122
- Support: $59,642 / $56,649
Analyst’s View: Bitcoin remains near a four-month low as Fed hike expectations and the equity rout reduce demand for risk. Its decline alongside metals fits a broader move toward cash. ANT’s debut failed to improve wider risk appetite, leaving Bitcoin vulnerable to further reductions in speculative positions.
Bitcoin is near $61,854, below the former $62,536 floor. Rebounds below $66,228 have produced lower highs, and price is moving toward the descending channel’s midpoint. The latest break weakens the earlier consolidation around $62,000–$65,000—failure to regain $62,536 leaves $59,642 as the next marked support. A sustained break would expose $56,649.
Bias: Bearish
Disclaimer: This analysis is for informational purposes only and does not constitute investment advice.