


Key Takeaways
Nvidia’s earnings will test confidence in AI spending after its leadership change. Hong Kong stocks opened lower as Wall Street’s technology sell-off spread to Asian trading. Gold remains below $3,900, and Bitcoin is consolidating near $65,000. Both face pressure from a strong dollar and cautious demand for non-interest-bearing assets. Today’s Focus: US retail sales and industrial production will test the growth and inflation outlook. Warsh’s completed speech focused on AI and productivity, with no new rate guidance. Nvidia reports around 05:20 Wednesday GMT+8; the Fed’s October meeting minutes follow at 03:00 Thursday GMT+8. |
Global Market Review 17/11/2026
- Monday’s Dow fell 1.41% to 51,608.17, the S&P 500 lost 1.92% to 7,416.59, and the Nasdaq Composite dropped 2.49% to 24,509.76.
- The dollar index (DXY) rose 0.15% to 103.57.
- 2-year and 10-year Treasury yields eased to 4.830% and 5.131%.
- Brent fell 4.19% to $91.82 and WTI lost 3.21% to $85.72 as recovering supply and demand concerns outweighed geopolitical risk.
- Gold declined 0.76% to $3,850.97.
- These snapshot prices differ from the later chart readings used below.
Economic Calendar
Key Events on November 17 (GMT+8)
| Time (GMT+8) | Event | Importance |
|---|---|---|
| 01:00 | US Fed Chair Kevin Warsh speech | ★★★ |
| 08:30 | Australia RBA Meeting Minutes | ★★★ |
| 15:00 | UK September Unemployment Rate | ★★ |
| 18:00 | Eurozone November ZEW Economic Sentiment | ★★ |
| 21:15 | US ADP Weekly Employment Change | ★★ |
| 21:30 | US October Retail Sales (MoM) | ★★★ |
| 22:15 | US October Industrial & Manufacturing Production (MoM) | ★★ |
Key Events on November 18 (GMT+8)
| Time (GMT+8) | Event | Importance |
|---|---|---|
| 05:20 | Nvidia earnings | ★★★ |
| 05:30 | US API Crude Oil Inventory Change | ★★ |
| 15:00 | UK October CPI & PPI (YoY) | ★★★ |
| 18:00 | Eurozone October Final CPI (YoY) | ★★★ |
| 21:30 | US October Building Permits (Preliminary) & Housing Starts | ★★ |
| 22:25 | ECB President Christine Lagarde Speaks | ★★★ |
| 23:00 | US October Pending Home Sales (MoM) | ★★ |
Markets Analysis 17/11/2026
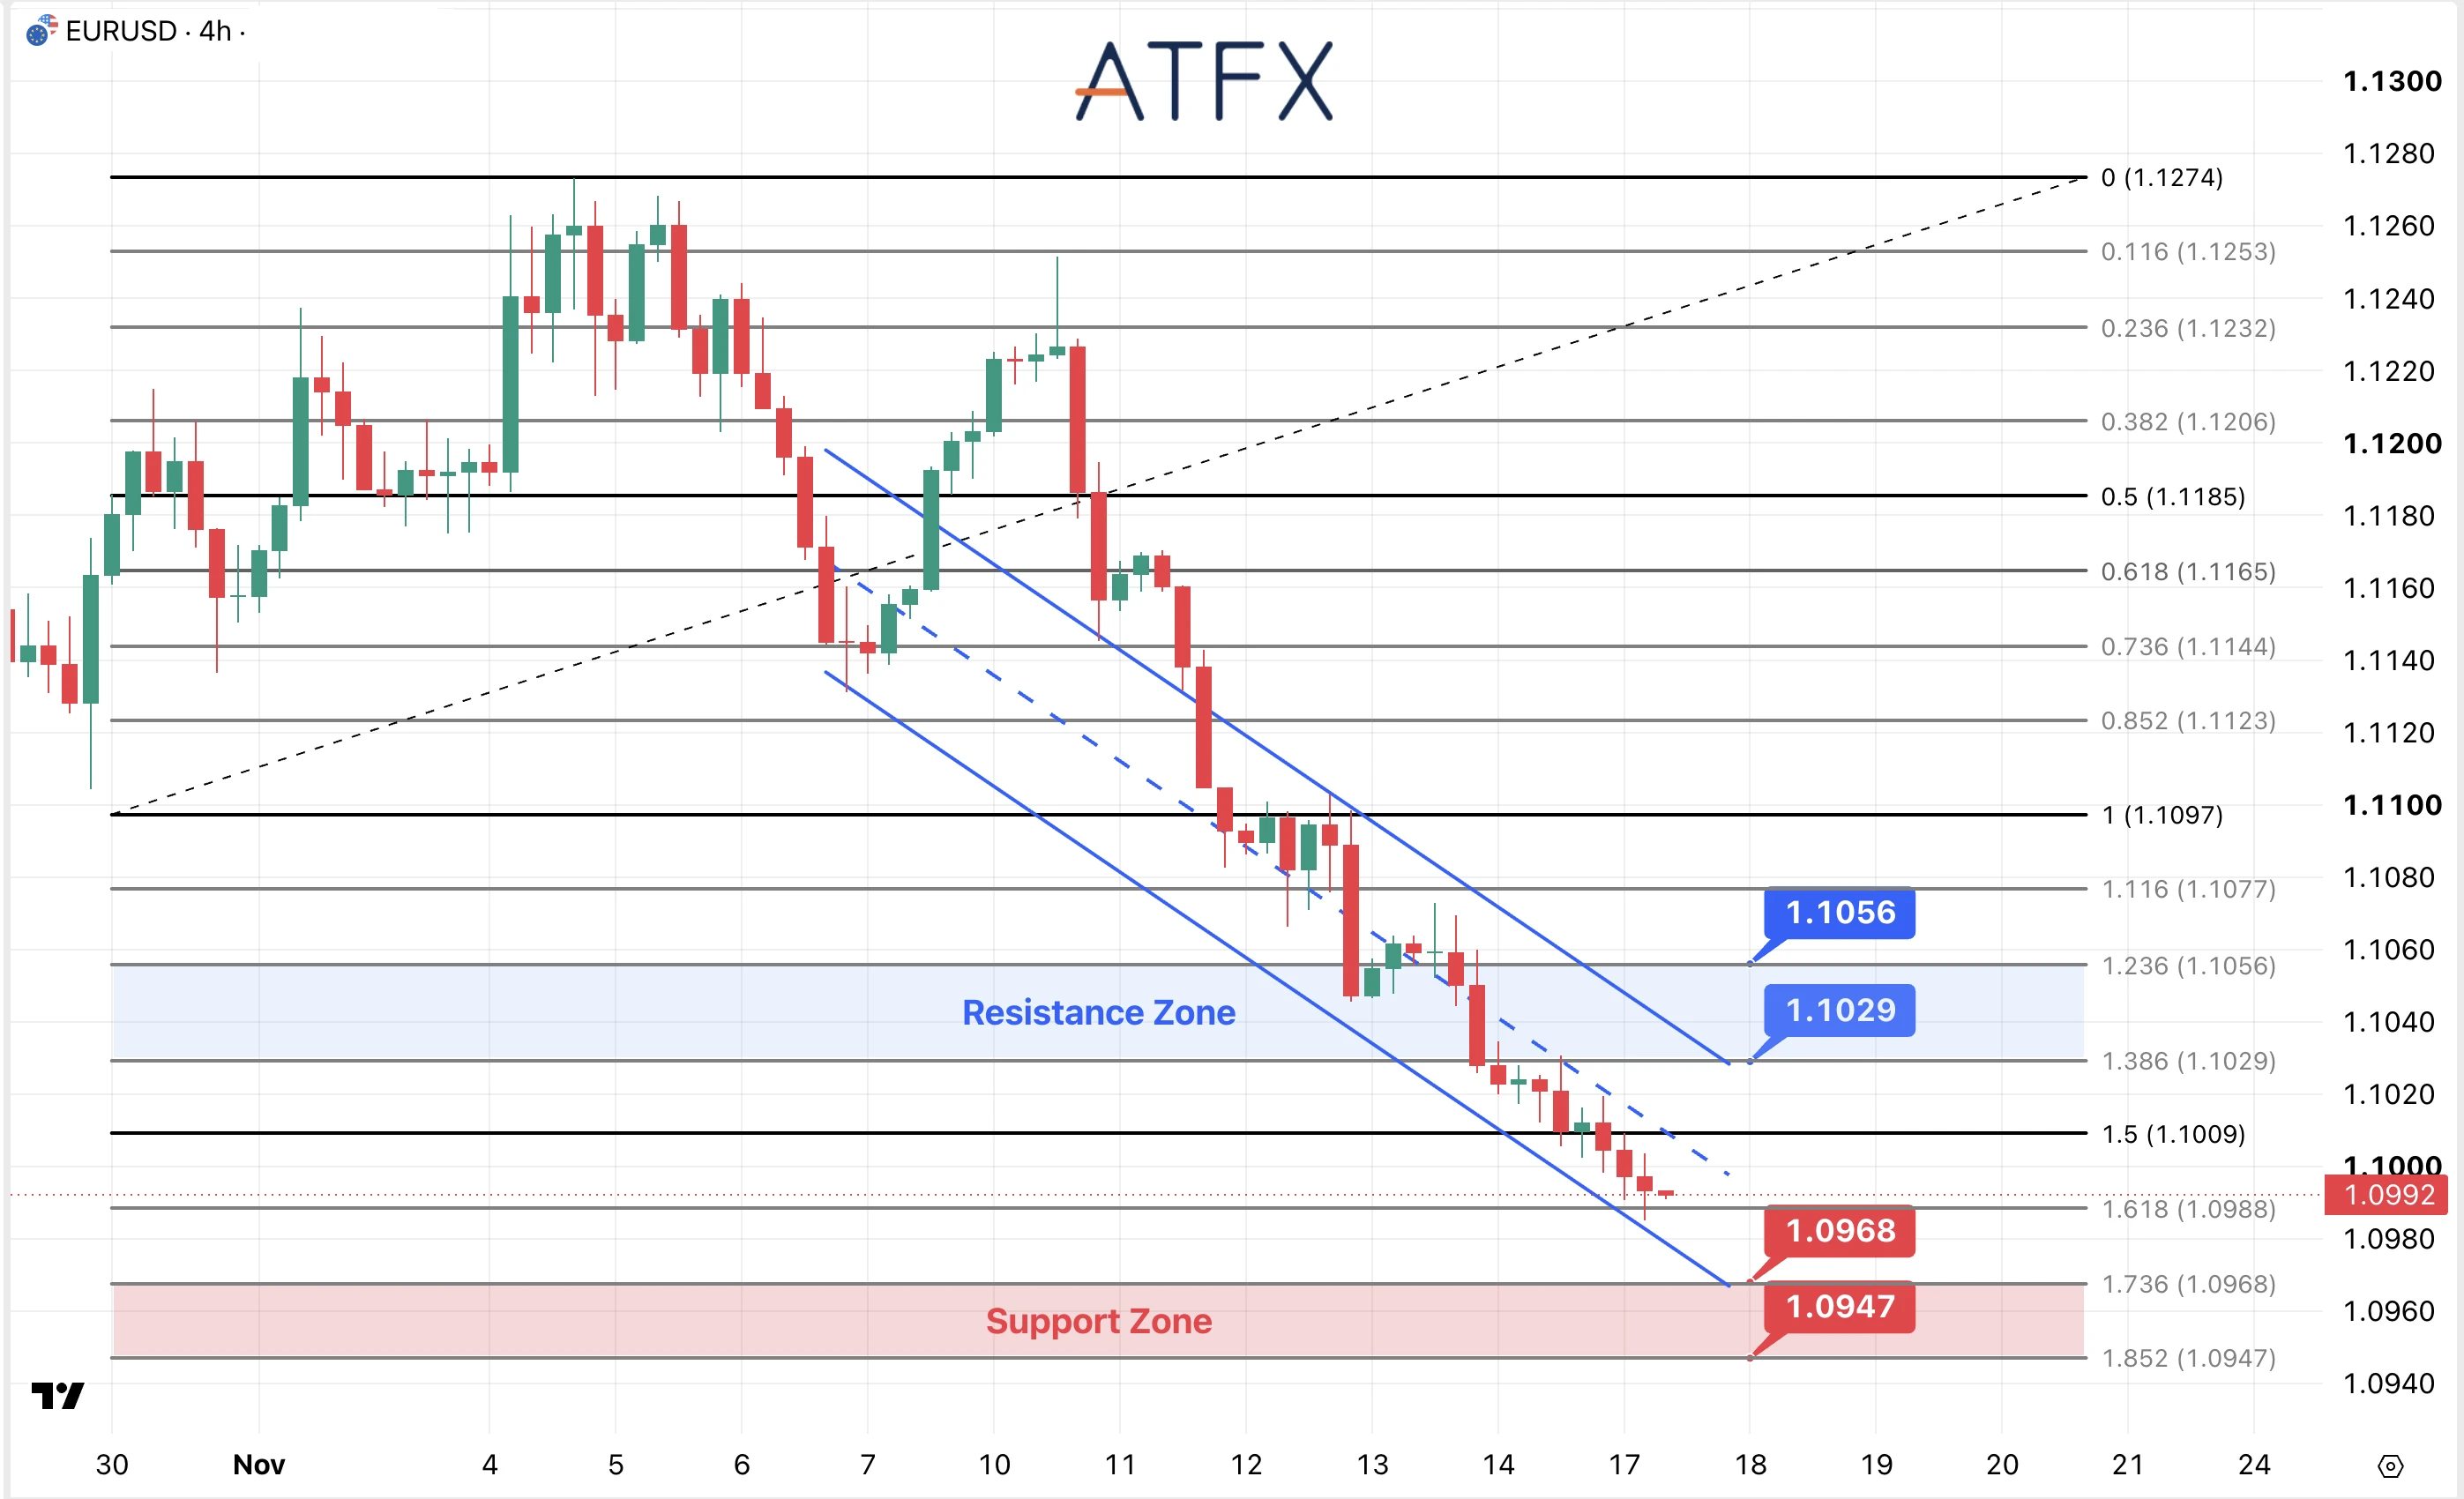
- Resistance: 1.1029 / 1.1056
- Support: 1.0968 / 1.0947
Analyst’s View: The firm dollar and expectations of further US rate increases continue to weigh on the euro. Today’s US retail sales and the eurozone ZEW survey could shift the balance between US policy expectations and concerns about European growth.
EUR/USD is near 1.0992, below 1.1000 and in a descending channel. Lower highs and lows show sellers still control the trend. The small candles near 1.0988 suggest a pause, but do not yet signal recovery.
A break below 1.0988 would put 1.0968 and the lower channel area in focus. Failure to hold there would expose 1.0947. Stronger US data could reinforce this downside scenario by supporting the dollar.
Bias: Bearish
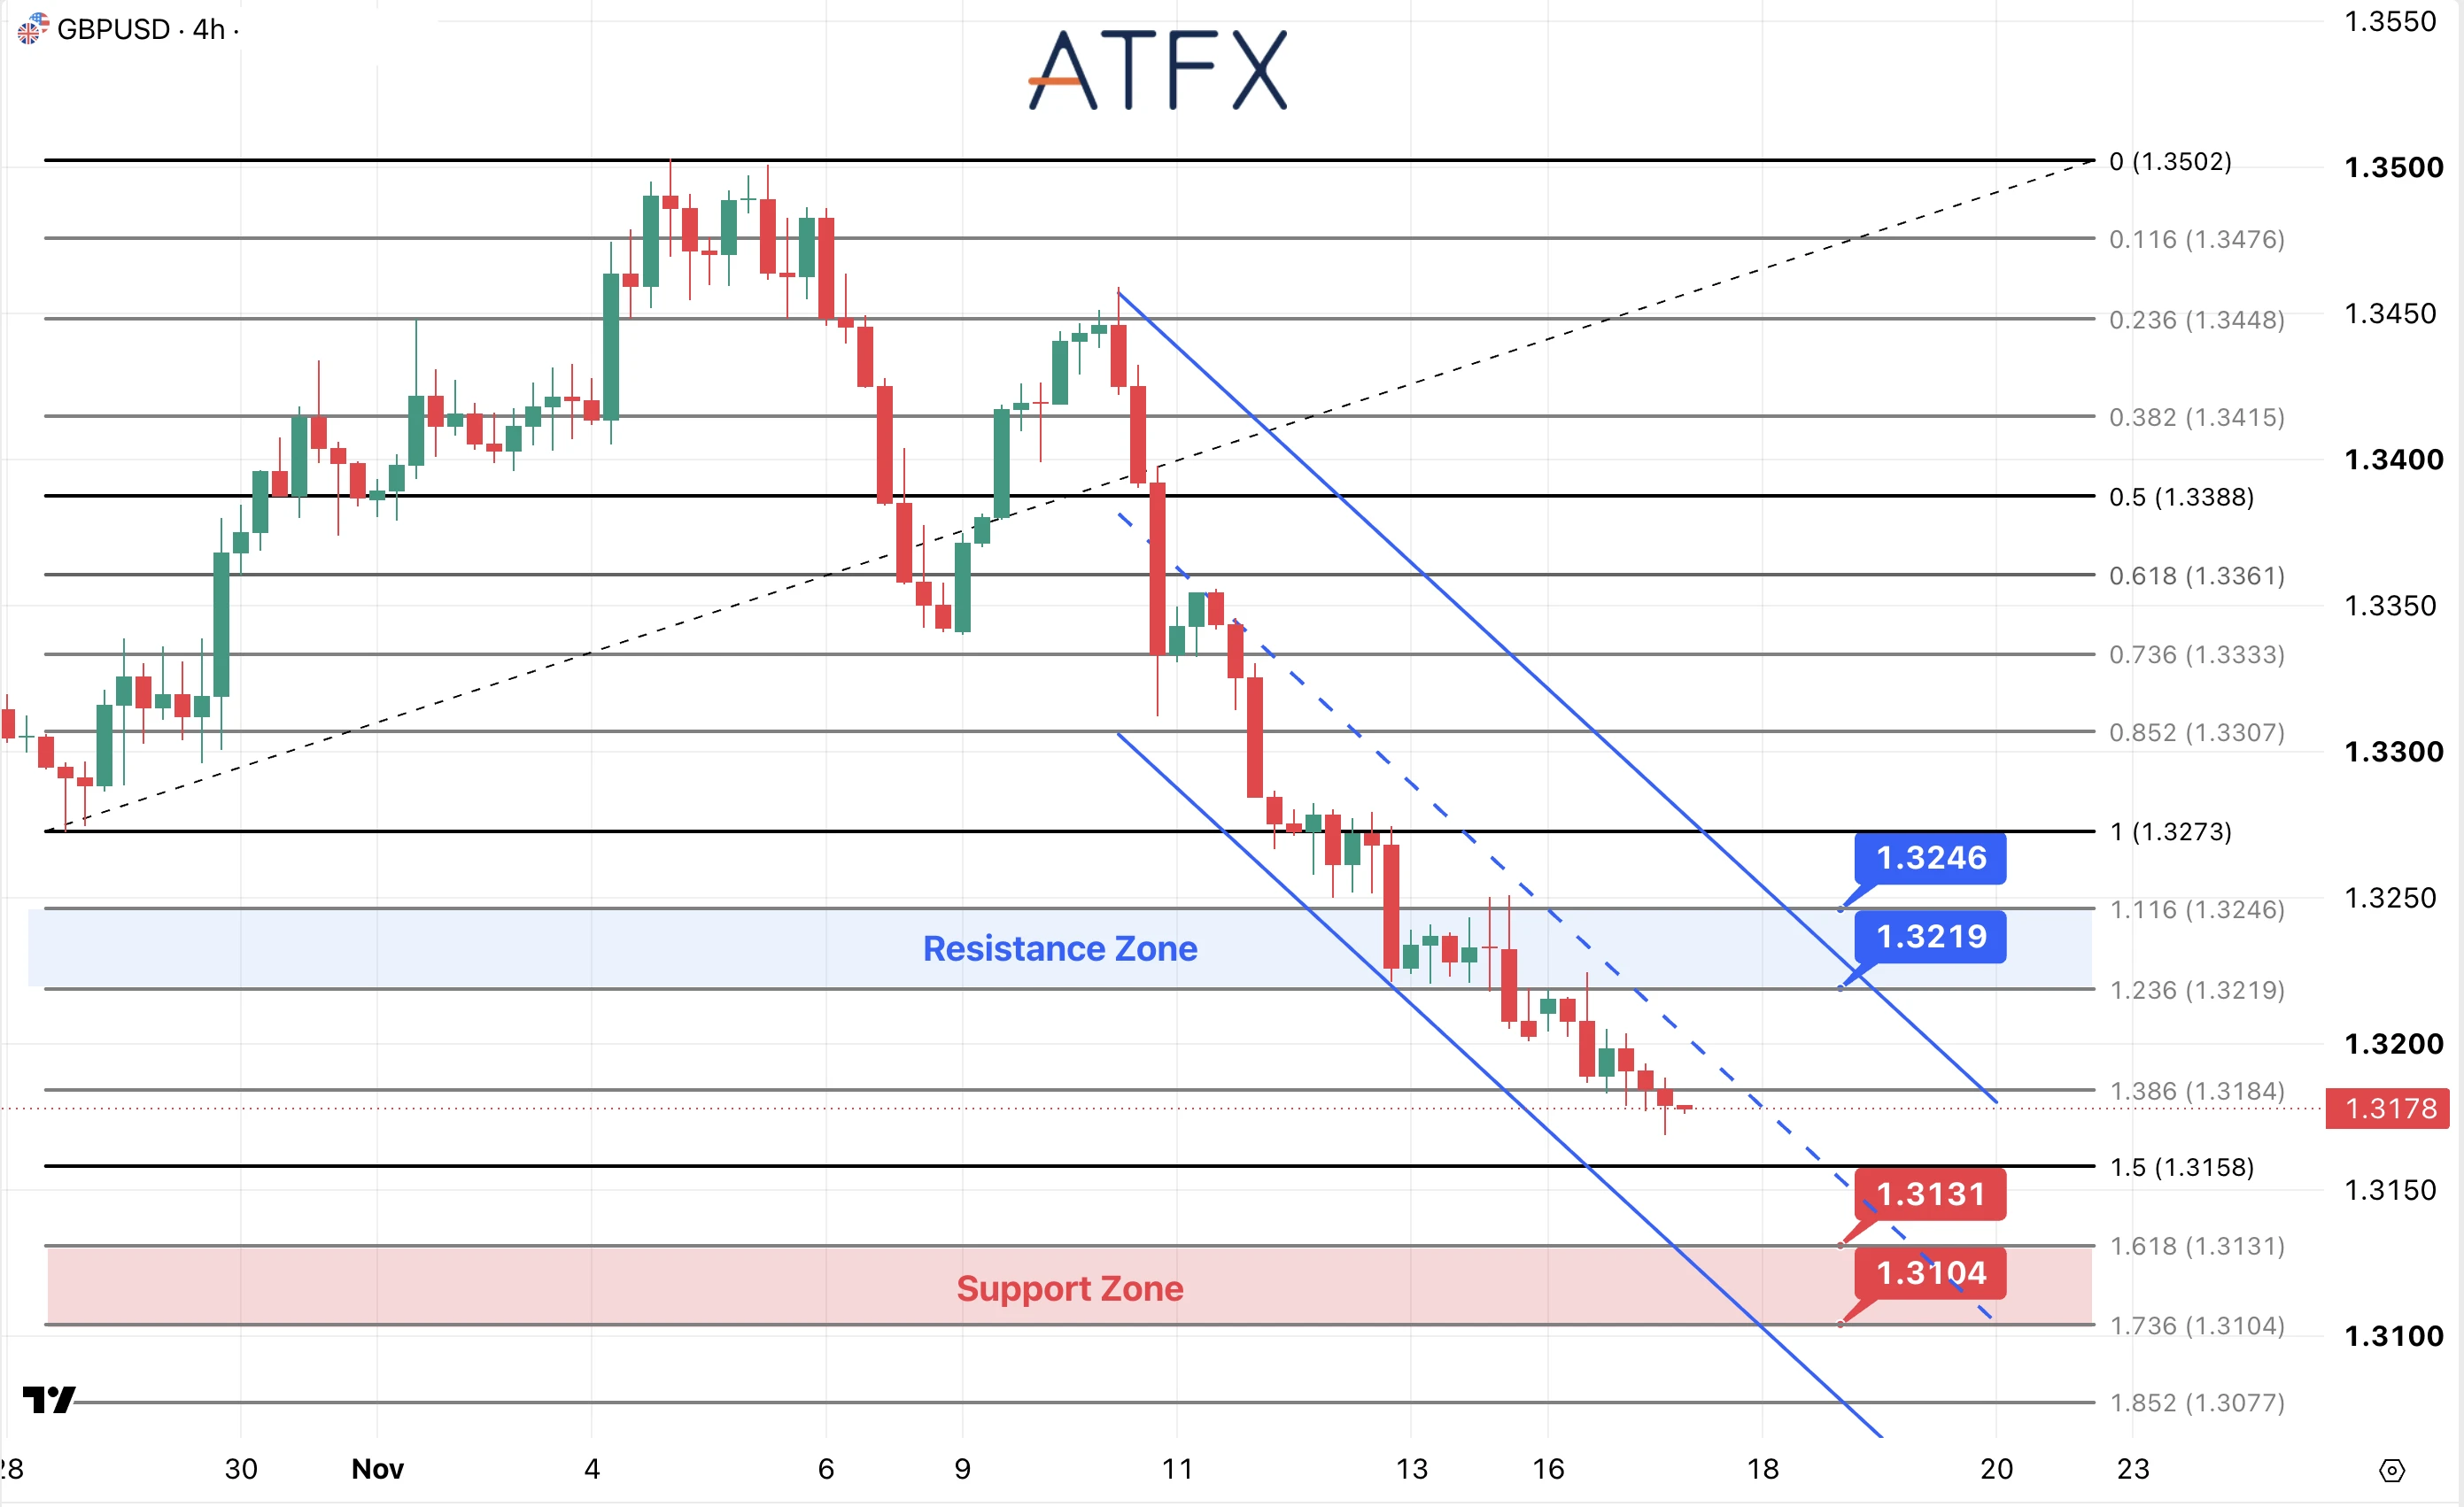
- Resistance: 1.3219 / 1.3246
- Support: 1.3131 / 1.3104
Analyst’s View: Sterling is under pressure from a stronger dollar ahead of the UK employment report. Wednesday’s UK inflation data is the next domestic test: weak hiring could weigh on growth expectations, while persistent inflation could keep interest rates elevated.
GBP/USD is near 1.3178 after slipping below 1.3184. Price remains in a steep descending channel. Smaller candles suggest the decline has slowed, but the lower-high sequence remains intact.
Reclaiming 1.3184 would open the way toward 1.3219. A move into the 1.3219–1.3246 resistance zone would test whether buyers can overcome the falling channel’s upper boundary.
If selling resumes, 1.3158 is the next level before 1.3131. A break below 1.3131 would expose 1.3104. Brief rebounds that stall below resistance would leave the broader decline intact.
Bias: Bearish
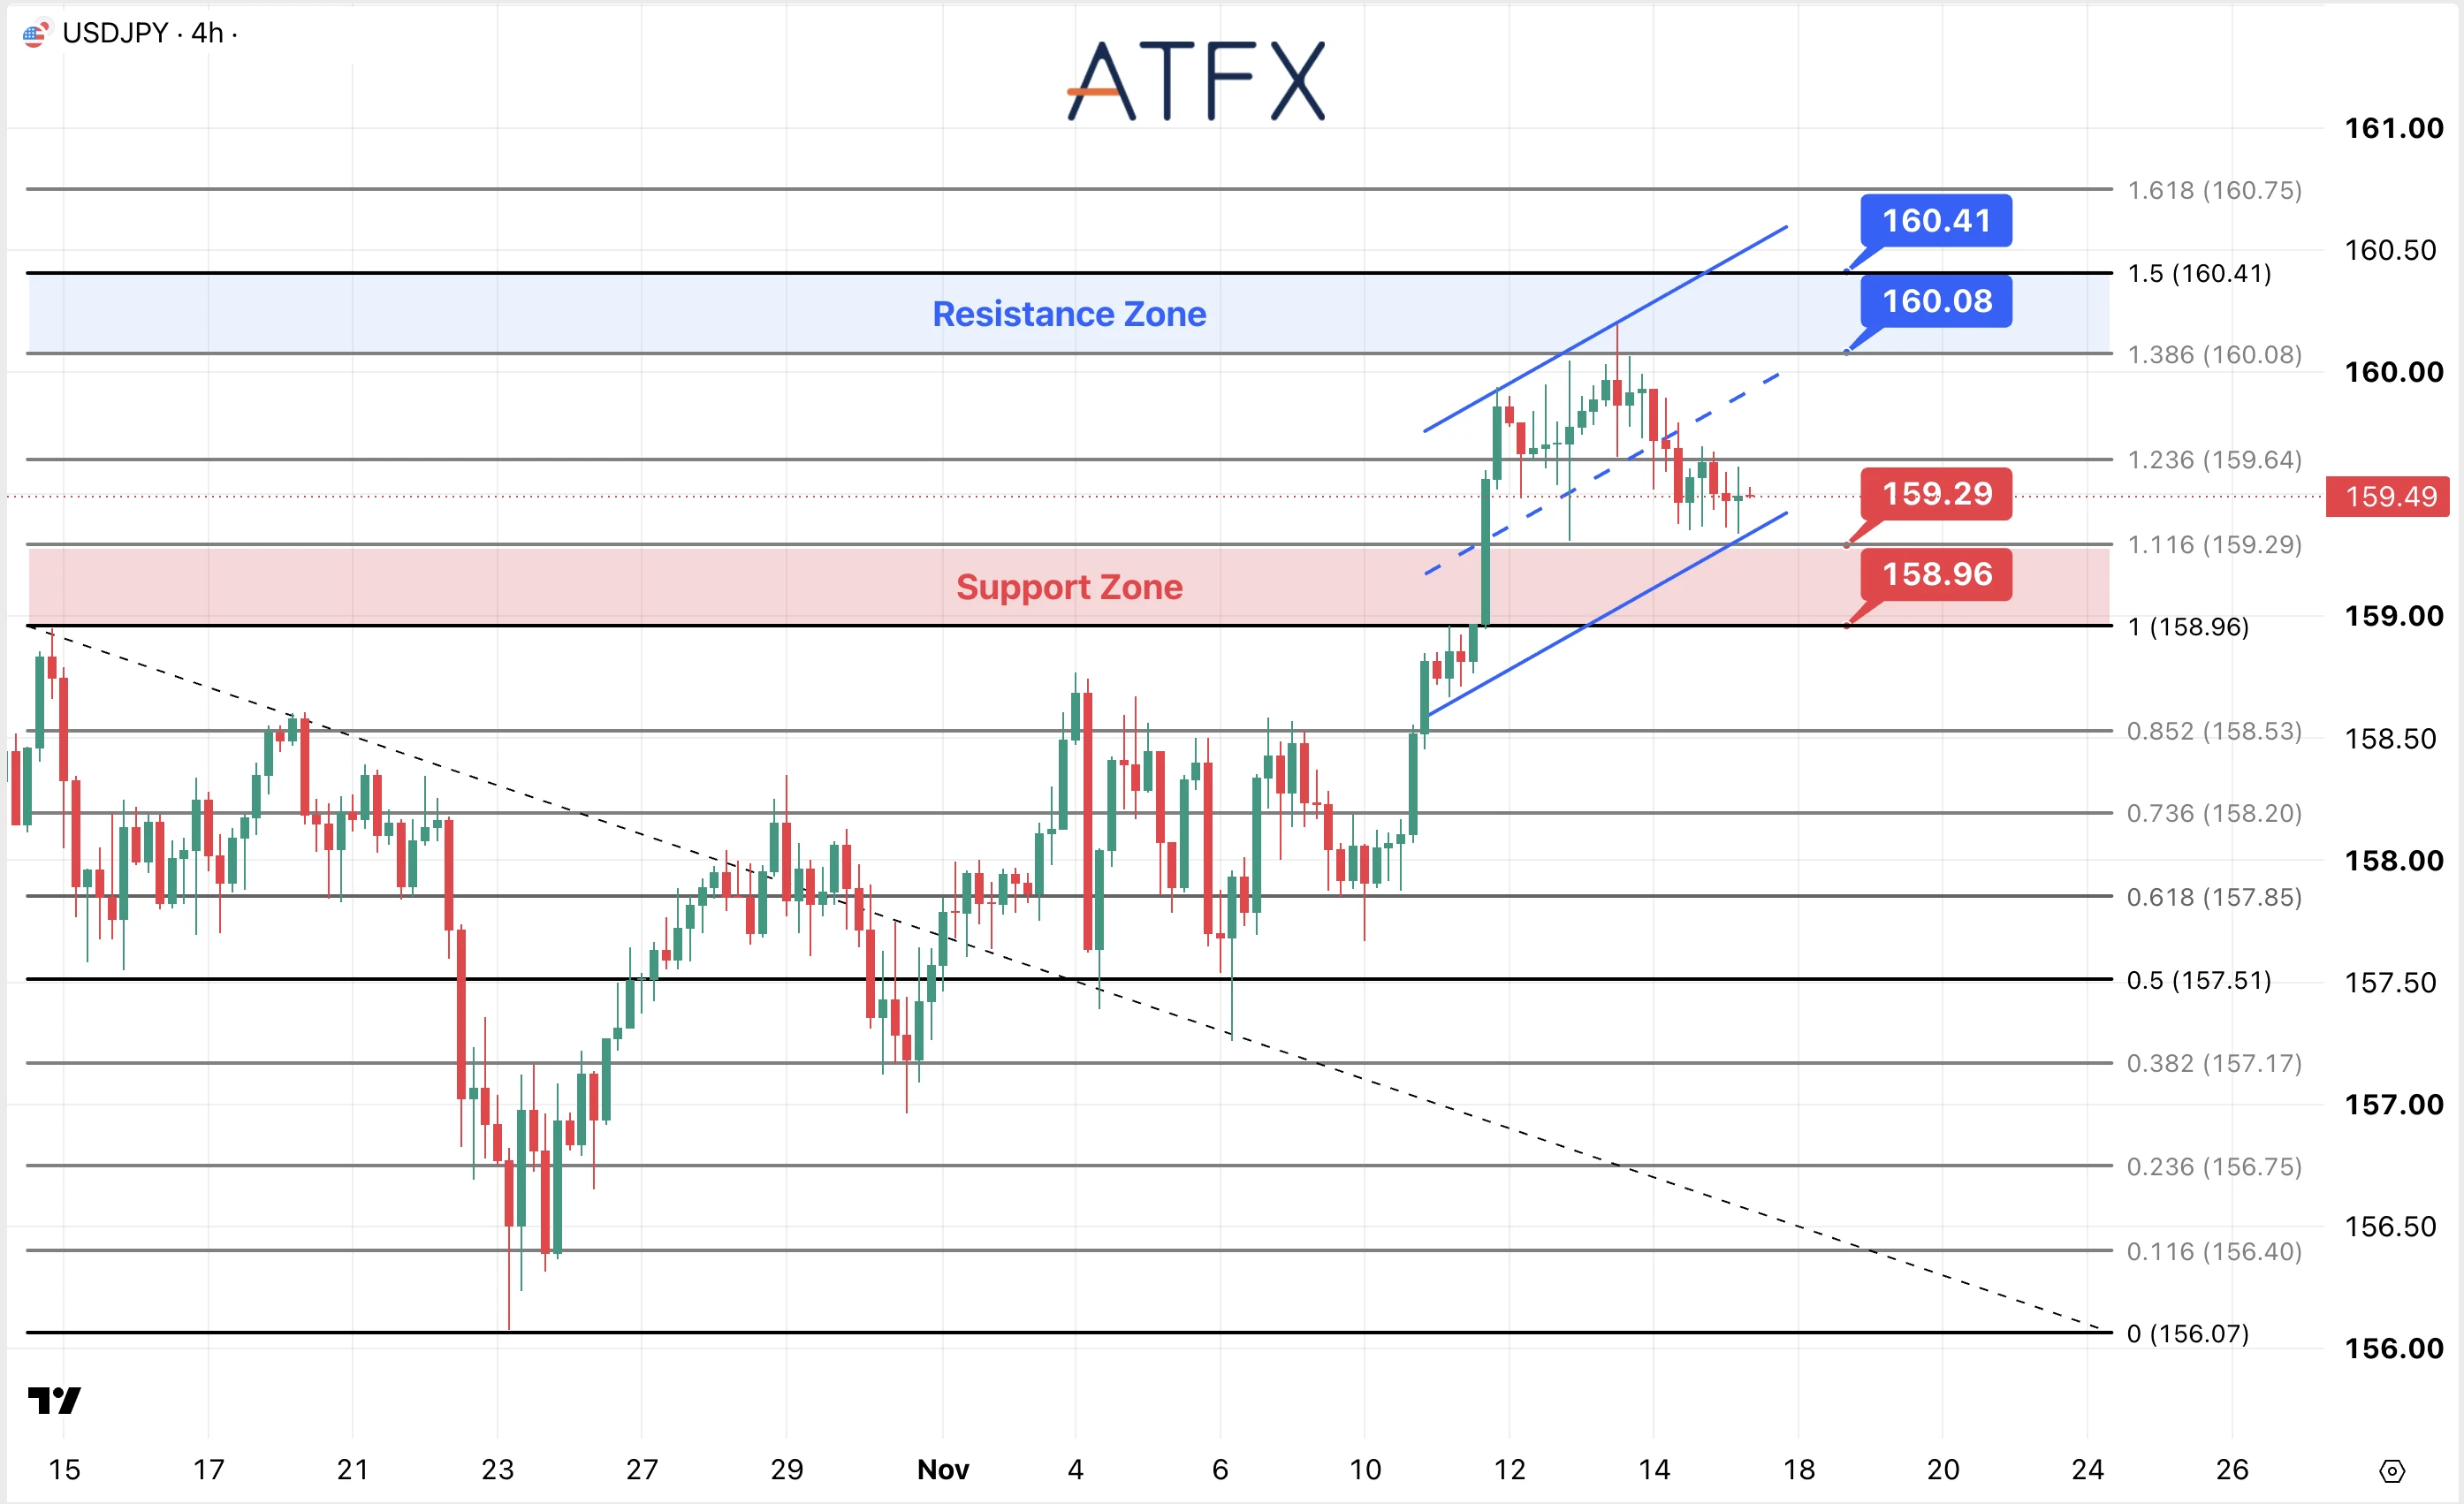
- Resistance: 160.08 / 160.41
- Support: 159.29 / 158.96
Analyst’s View: High US yields support the dollar, while weaker equity markets can boost demand for the yen as a safe-haven currency. Concerns about possible Japanese intervention near 160 also curb confidence in chasing further gains.
USD/JPY is near 159.49 after retreating from 160.08. The rising channel remains intact, though price has slipped below its midpoint and is nearing the lower boundary. This suggests weaker upward momentum, not a confirmed trend reversal. A recovery above 159.64 would improve the near-term picture and bring 160.08 back into focus. Clearing that resistance could extend the advance toward 160.41, though policy headlines could trigger sharp reversals.
Bias: Cautiously bullish
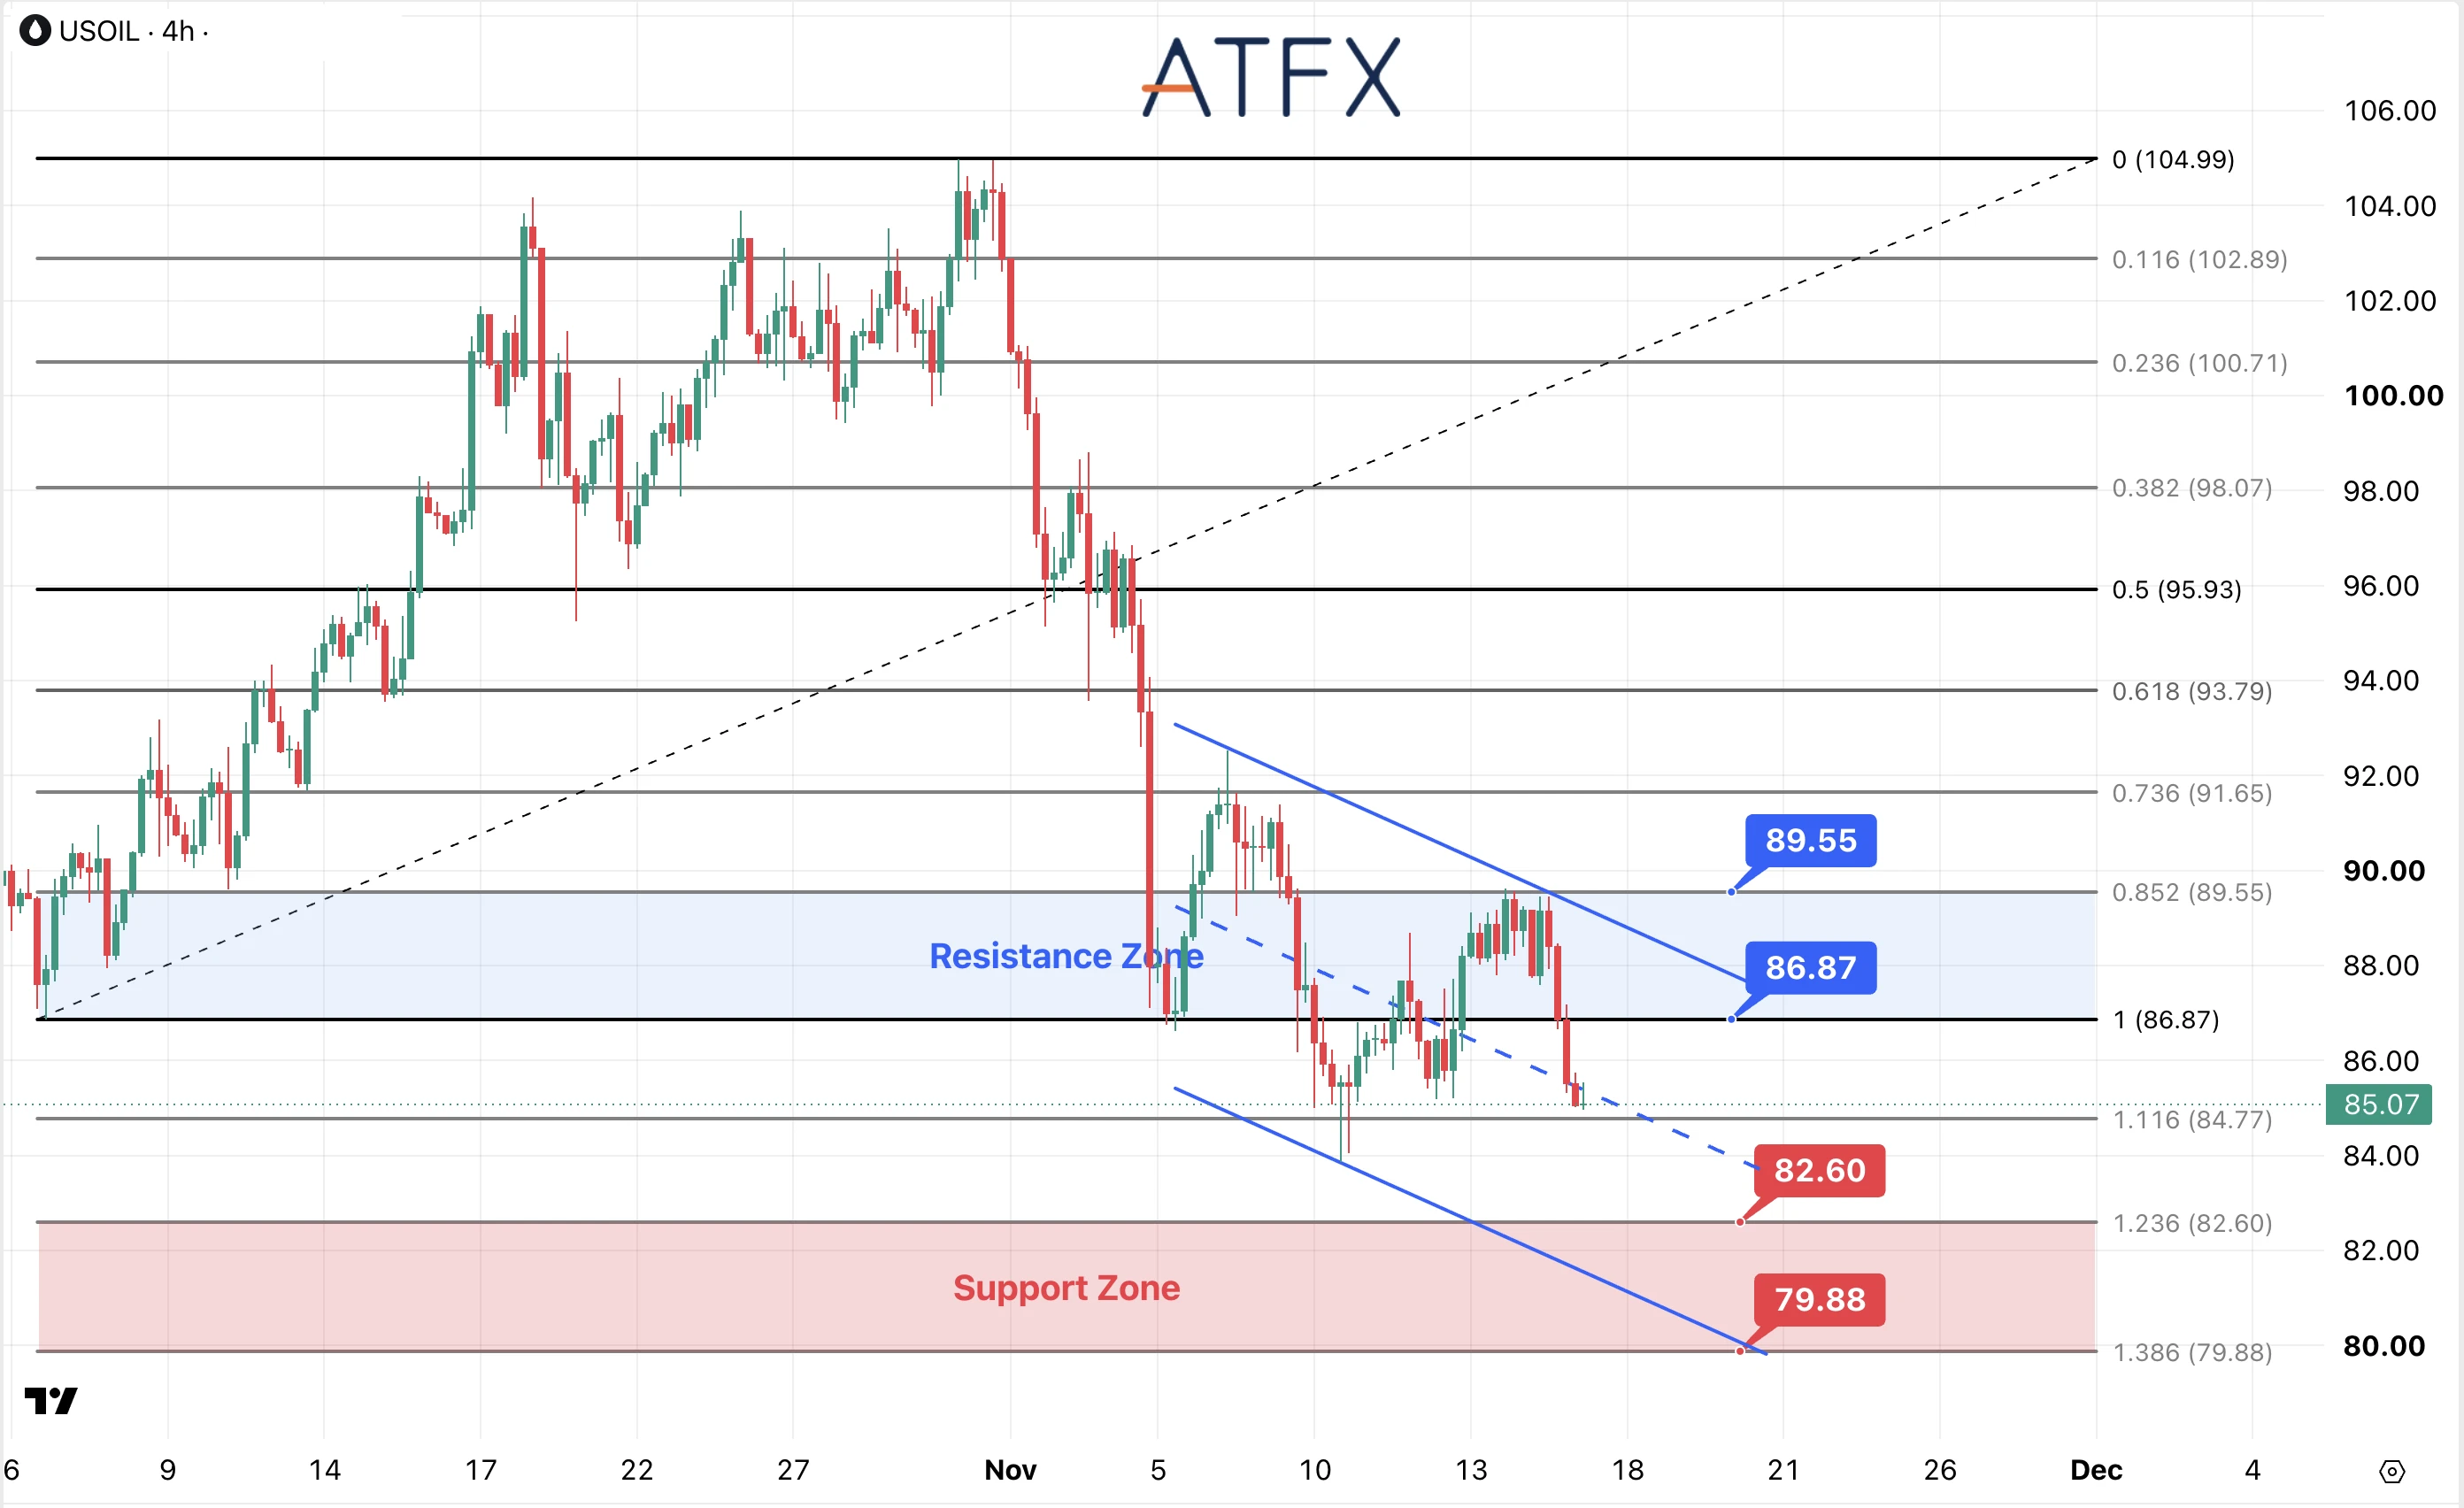
- Resistance: $86.87 / $89.55
- Support: $82.60 / $79.88
Analyst’s View: Oil remains under pressure as recovering supply and demand concerns outweigh the immediate impact of regional tensions. Reports of tanker incidents near Hormuz still leave prices vulnerable to supply headlines. API inventories arrive at 05:30 Wednesday GMT+8, followed by EIA data at 23:30.
WTI is near $85.07 after rebounding, stalled below $89.55. The drop broke $86.87 and pulled price back toward the channel’s midpoint. Nearby $84.77 support is now key for gauging whether selling is accelerating. A sustained move below $84.77 would bring recent lows near $84 into view, followed by $82.60. Failure at $82.60 would expose $79.88, the lower edge of the marked support zone.
Bias: Bearish
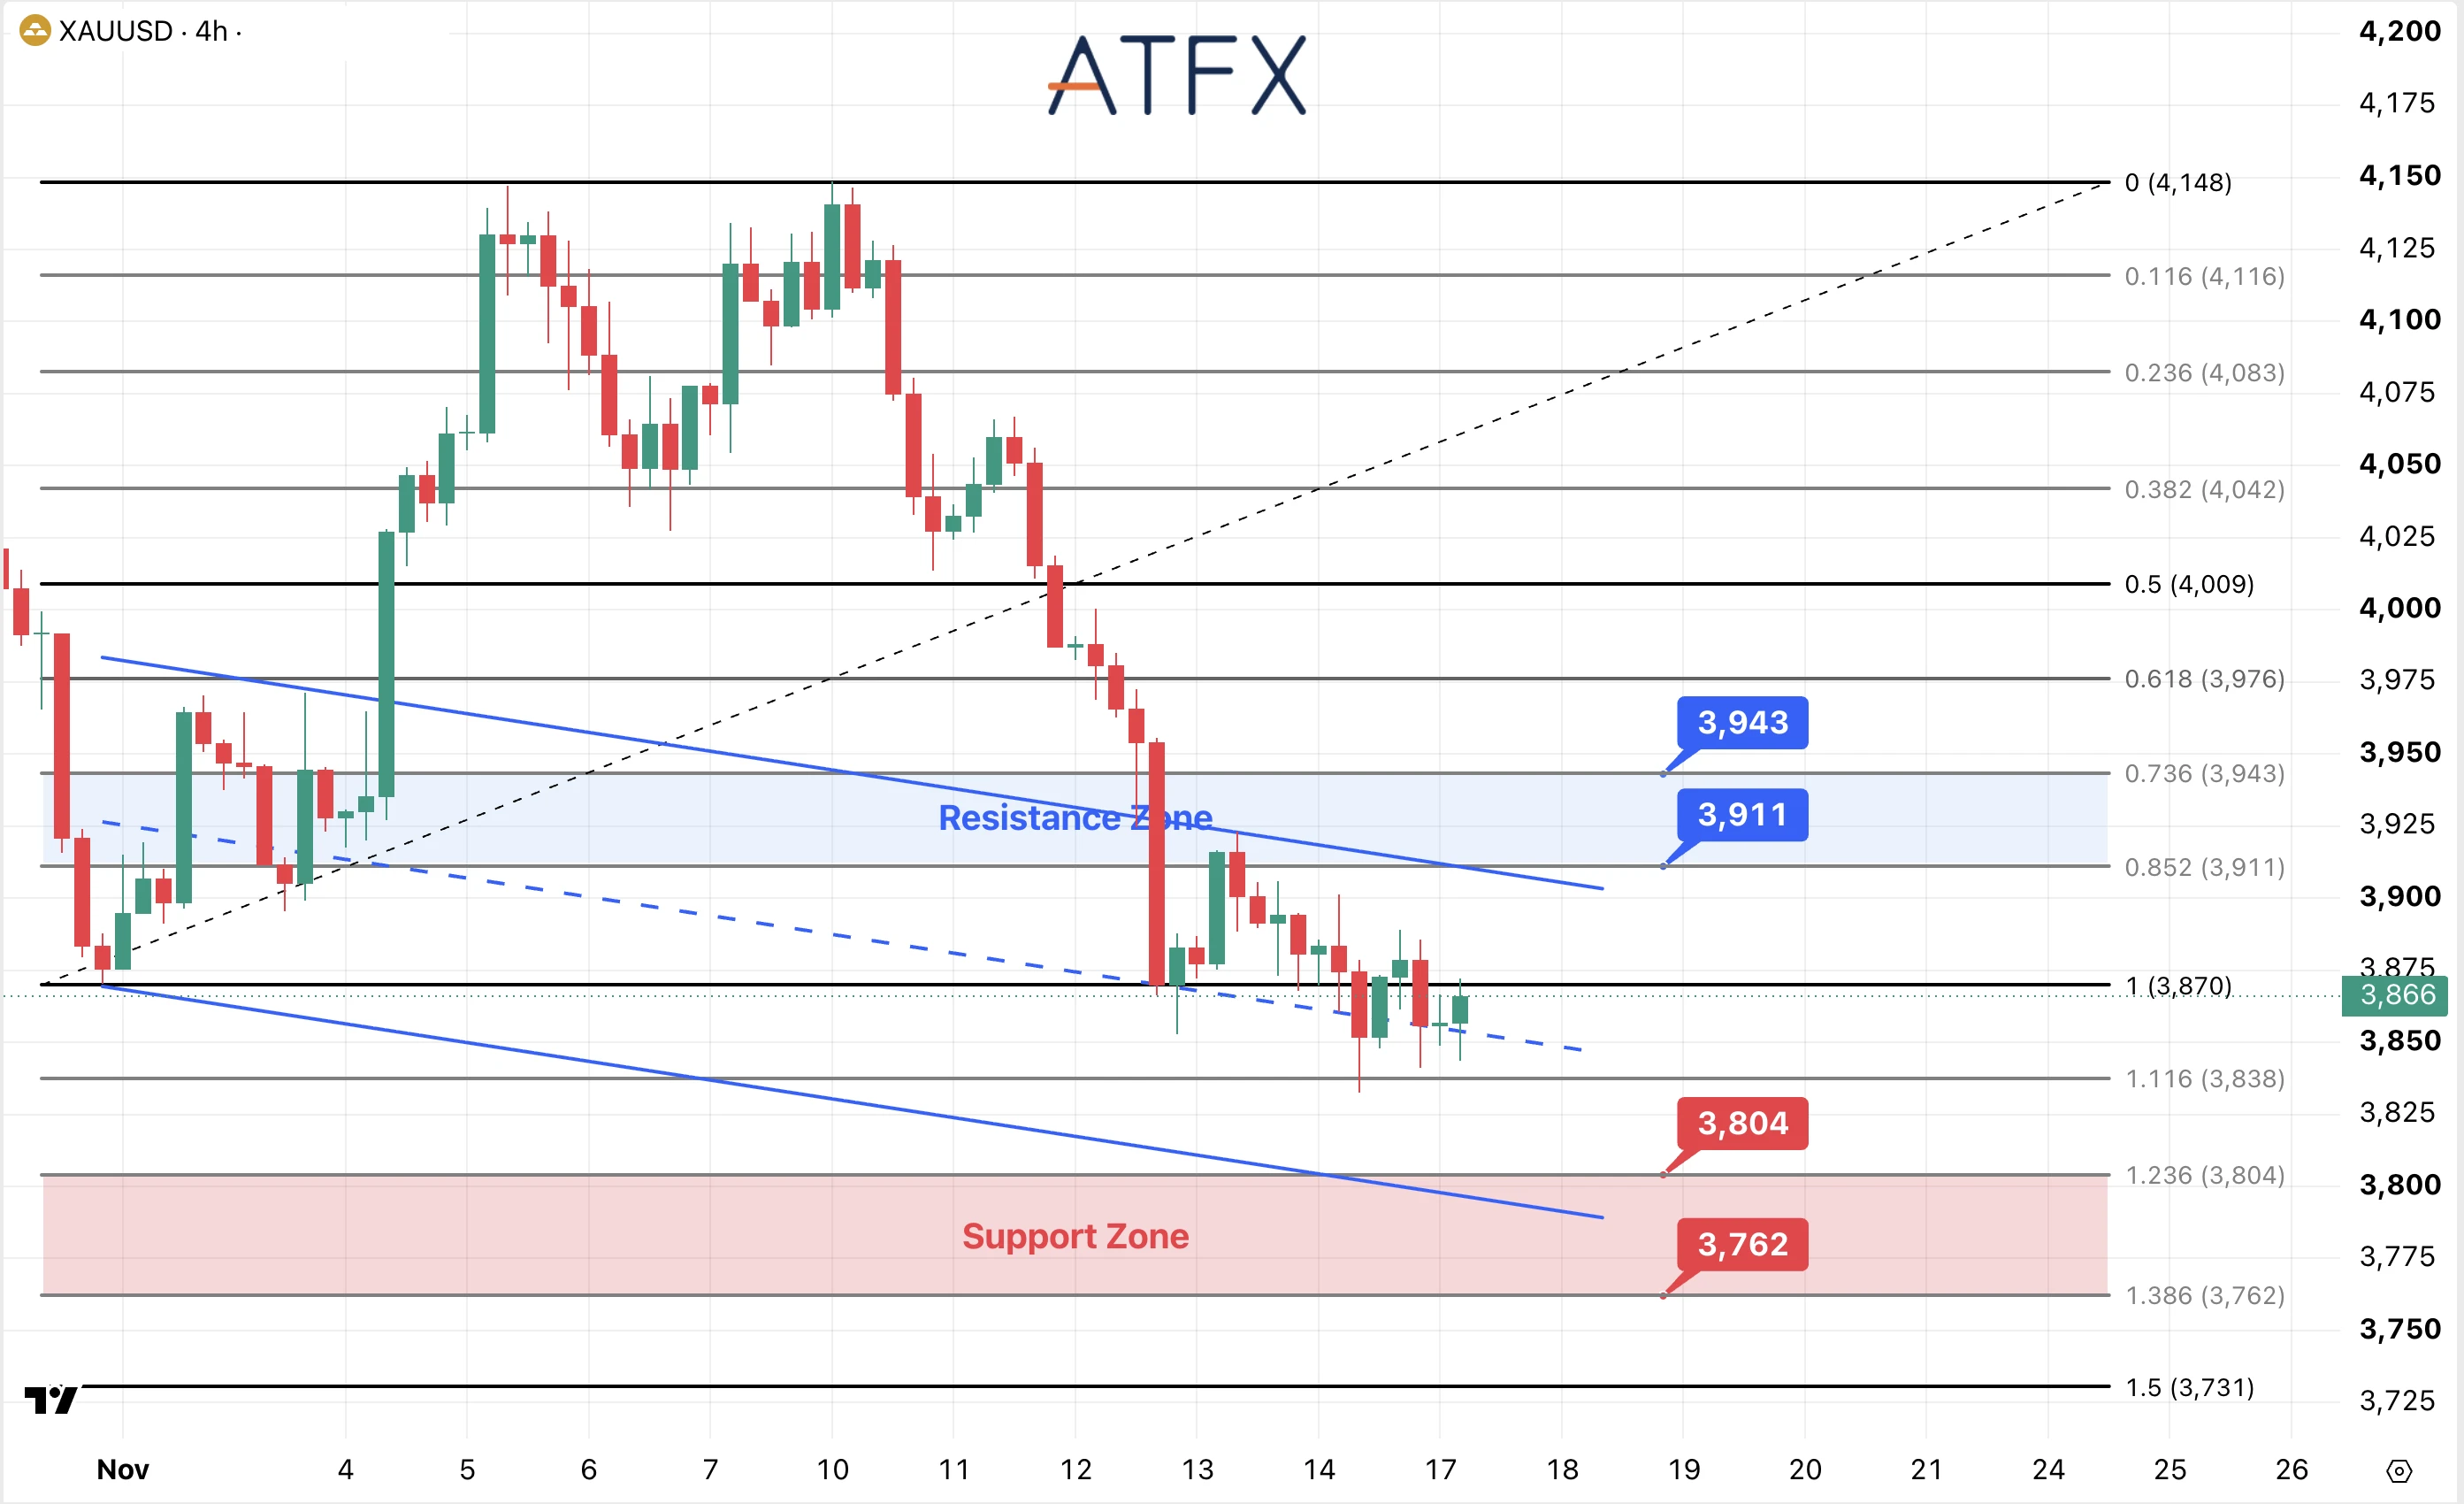
- Resistance: $3,911 / $3,943
- Support: $3,804 / $3,762
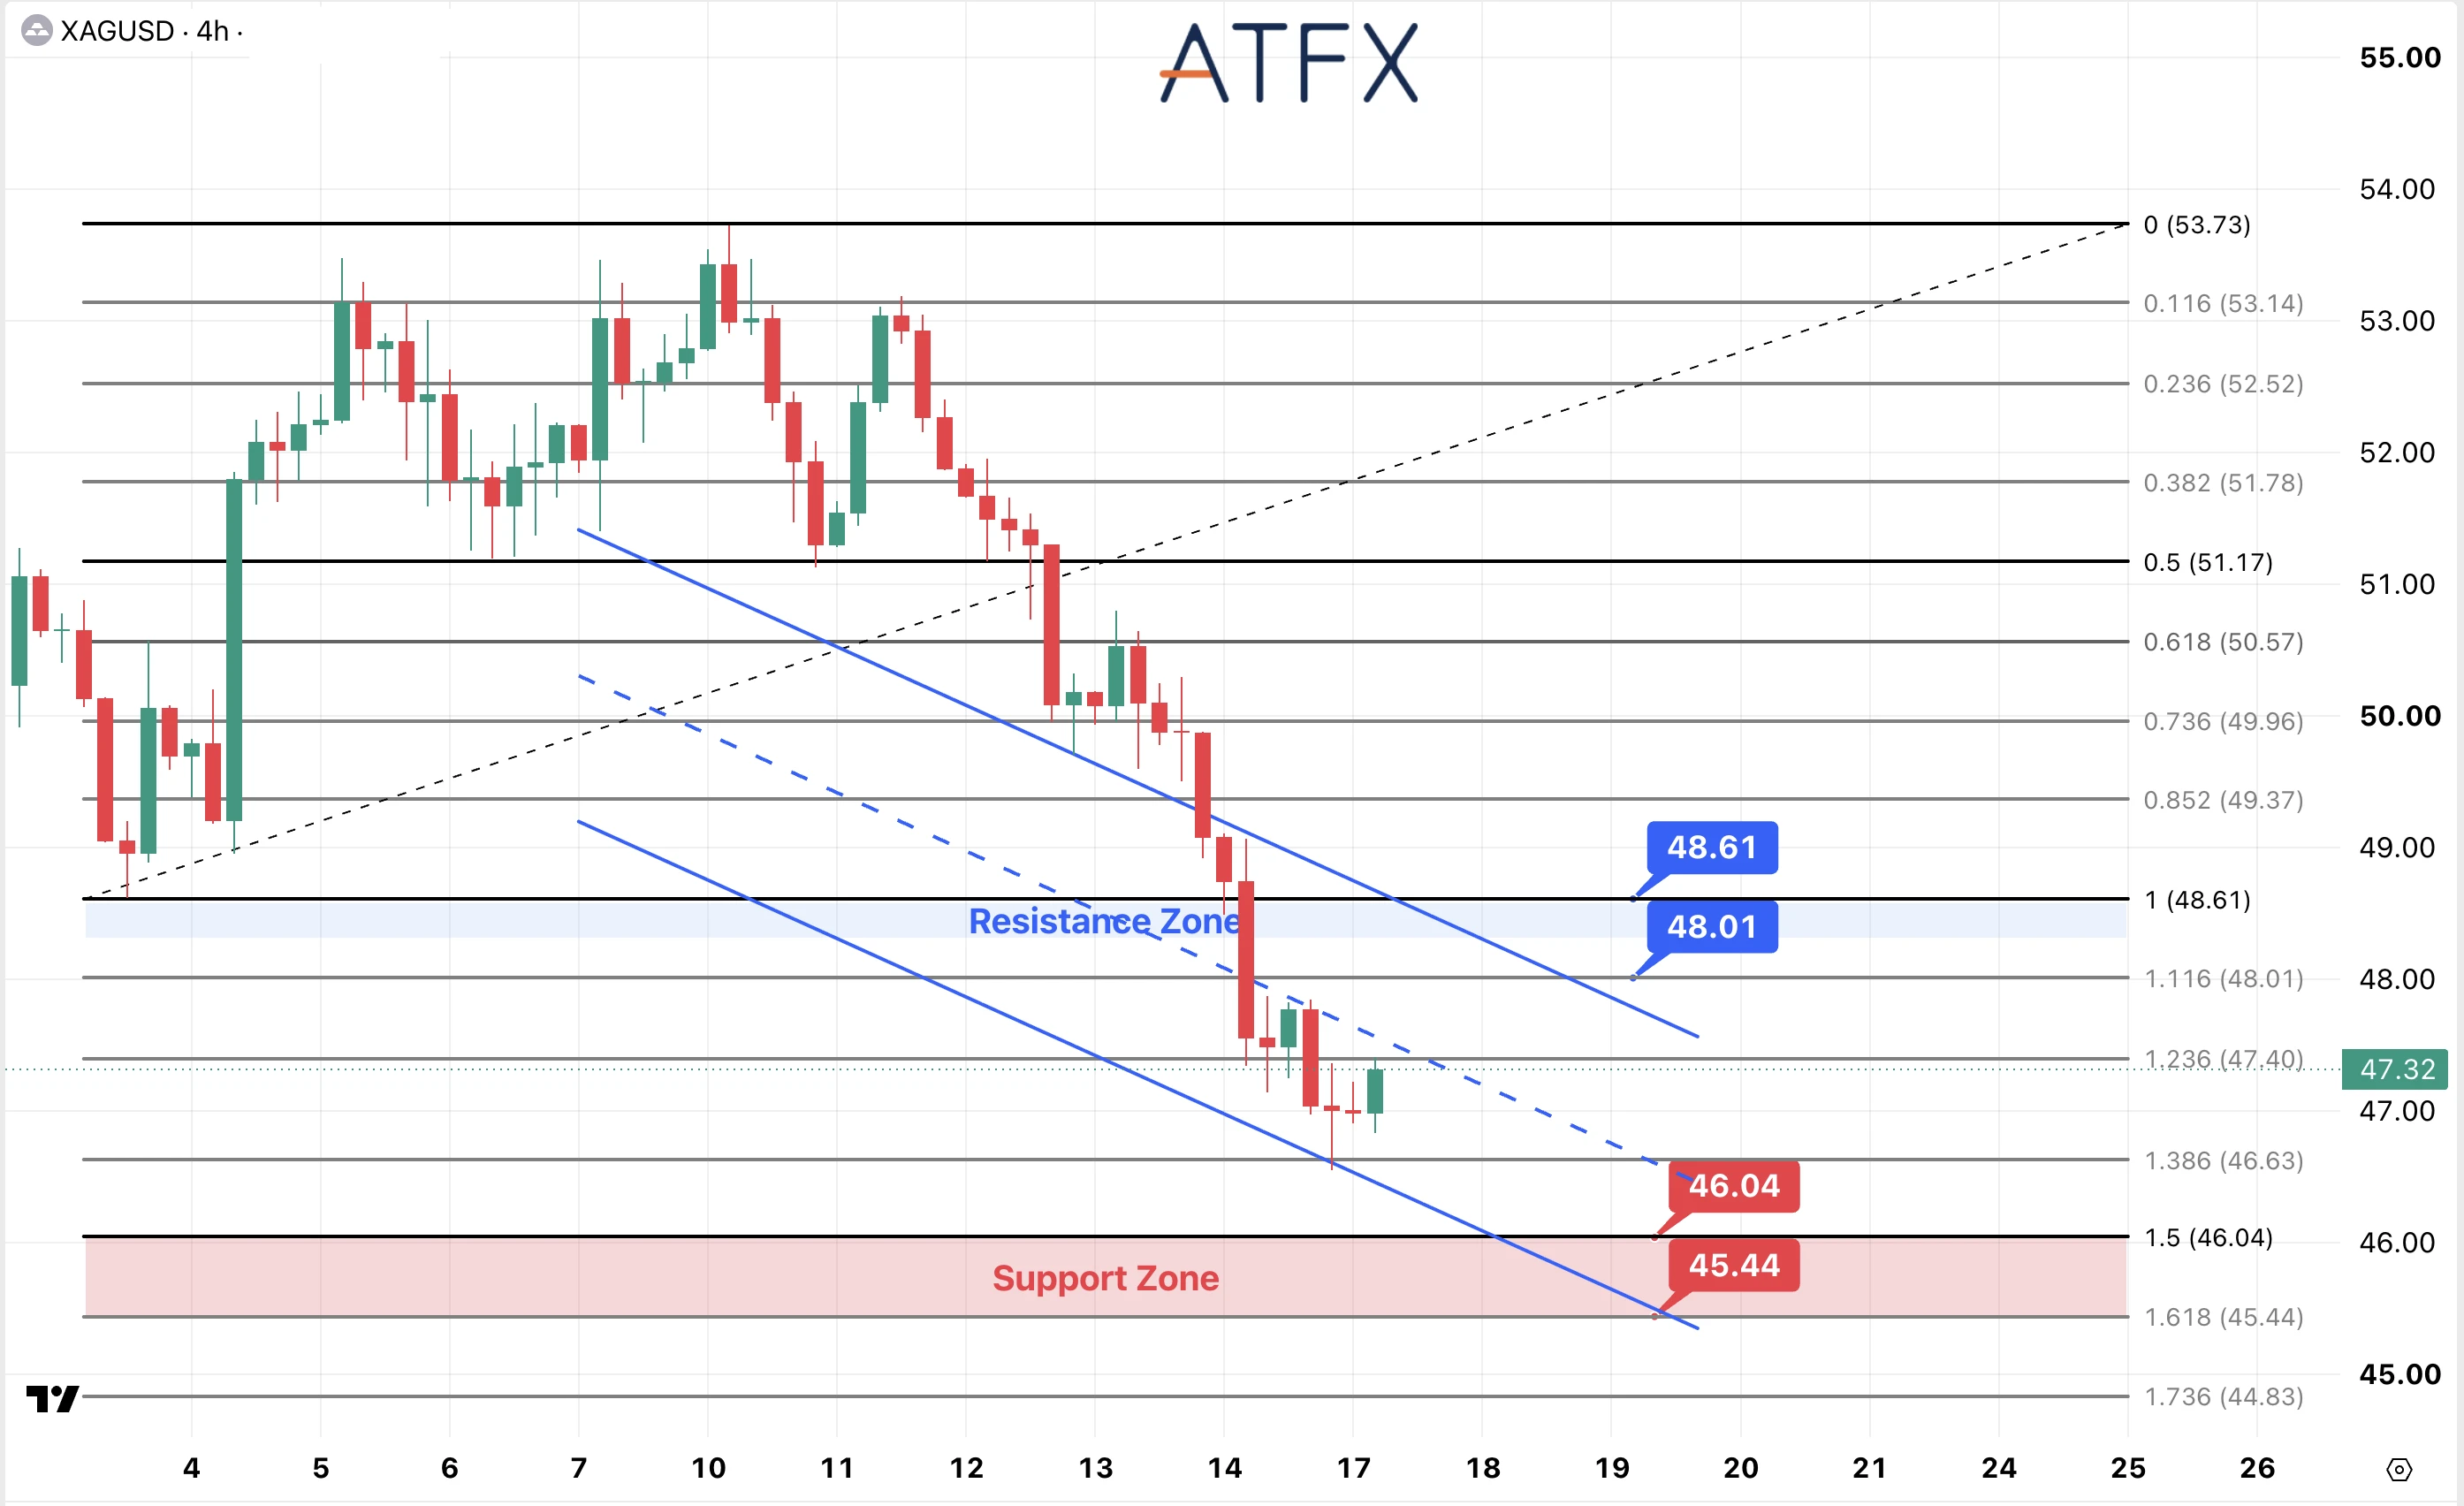
- Resistance: $48.01 / $48.61
- Support: $46.04 / $45.44
Analyst’s View: Gold has struggled to attract defensive buying as the dollar remains firm and Treasury yields stay high. Because it pays no interest, higher bond yields reduce gold’s appeal. US retail sales and the Fed minutes could shift expectations for the next rate decision.
Gold is near $3,866, just below the former $3,870 floor. Buying appeared near $3,838, with intraday lows around $3,832, but rebounds remain trapped in a descending channel. Reclaiming $3,870 would ease selling pressure and open a move toward $3,911. A stronger push could test $3,943, where resistance and the falling channel may attract fresh selling. A drop below $3,838 and recent lows would strengthen the downside case. Next support is $3,804, then $3,762. Holding these lows is needed for a more durable recovery.
Silver is near $47.32 after rebounding from $46.63. The bounce remains below $47.40 and near the midpoint of the descending channel. It has slowed the decline without breaking the lower-high pattern.
If the rebound fades, $46.63 is the first downside checkpoint. A break would expose $46.04 and then $45.44, the marked support zone. Continued weakness in gold or industrial sentiment could keep this area under pressure.
Bias: Gold & Silver Bearish
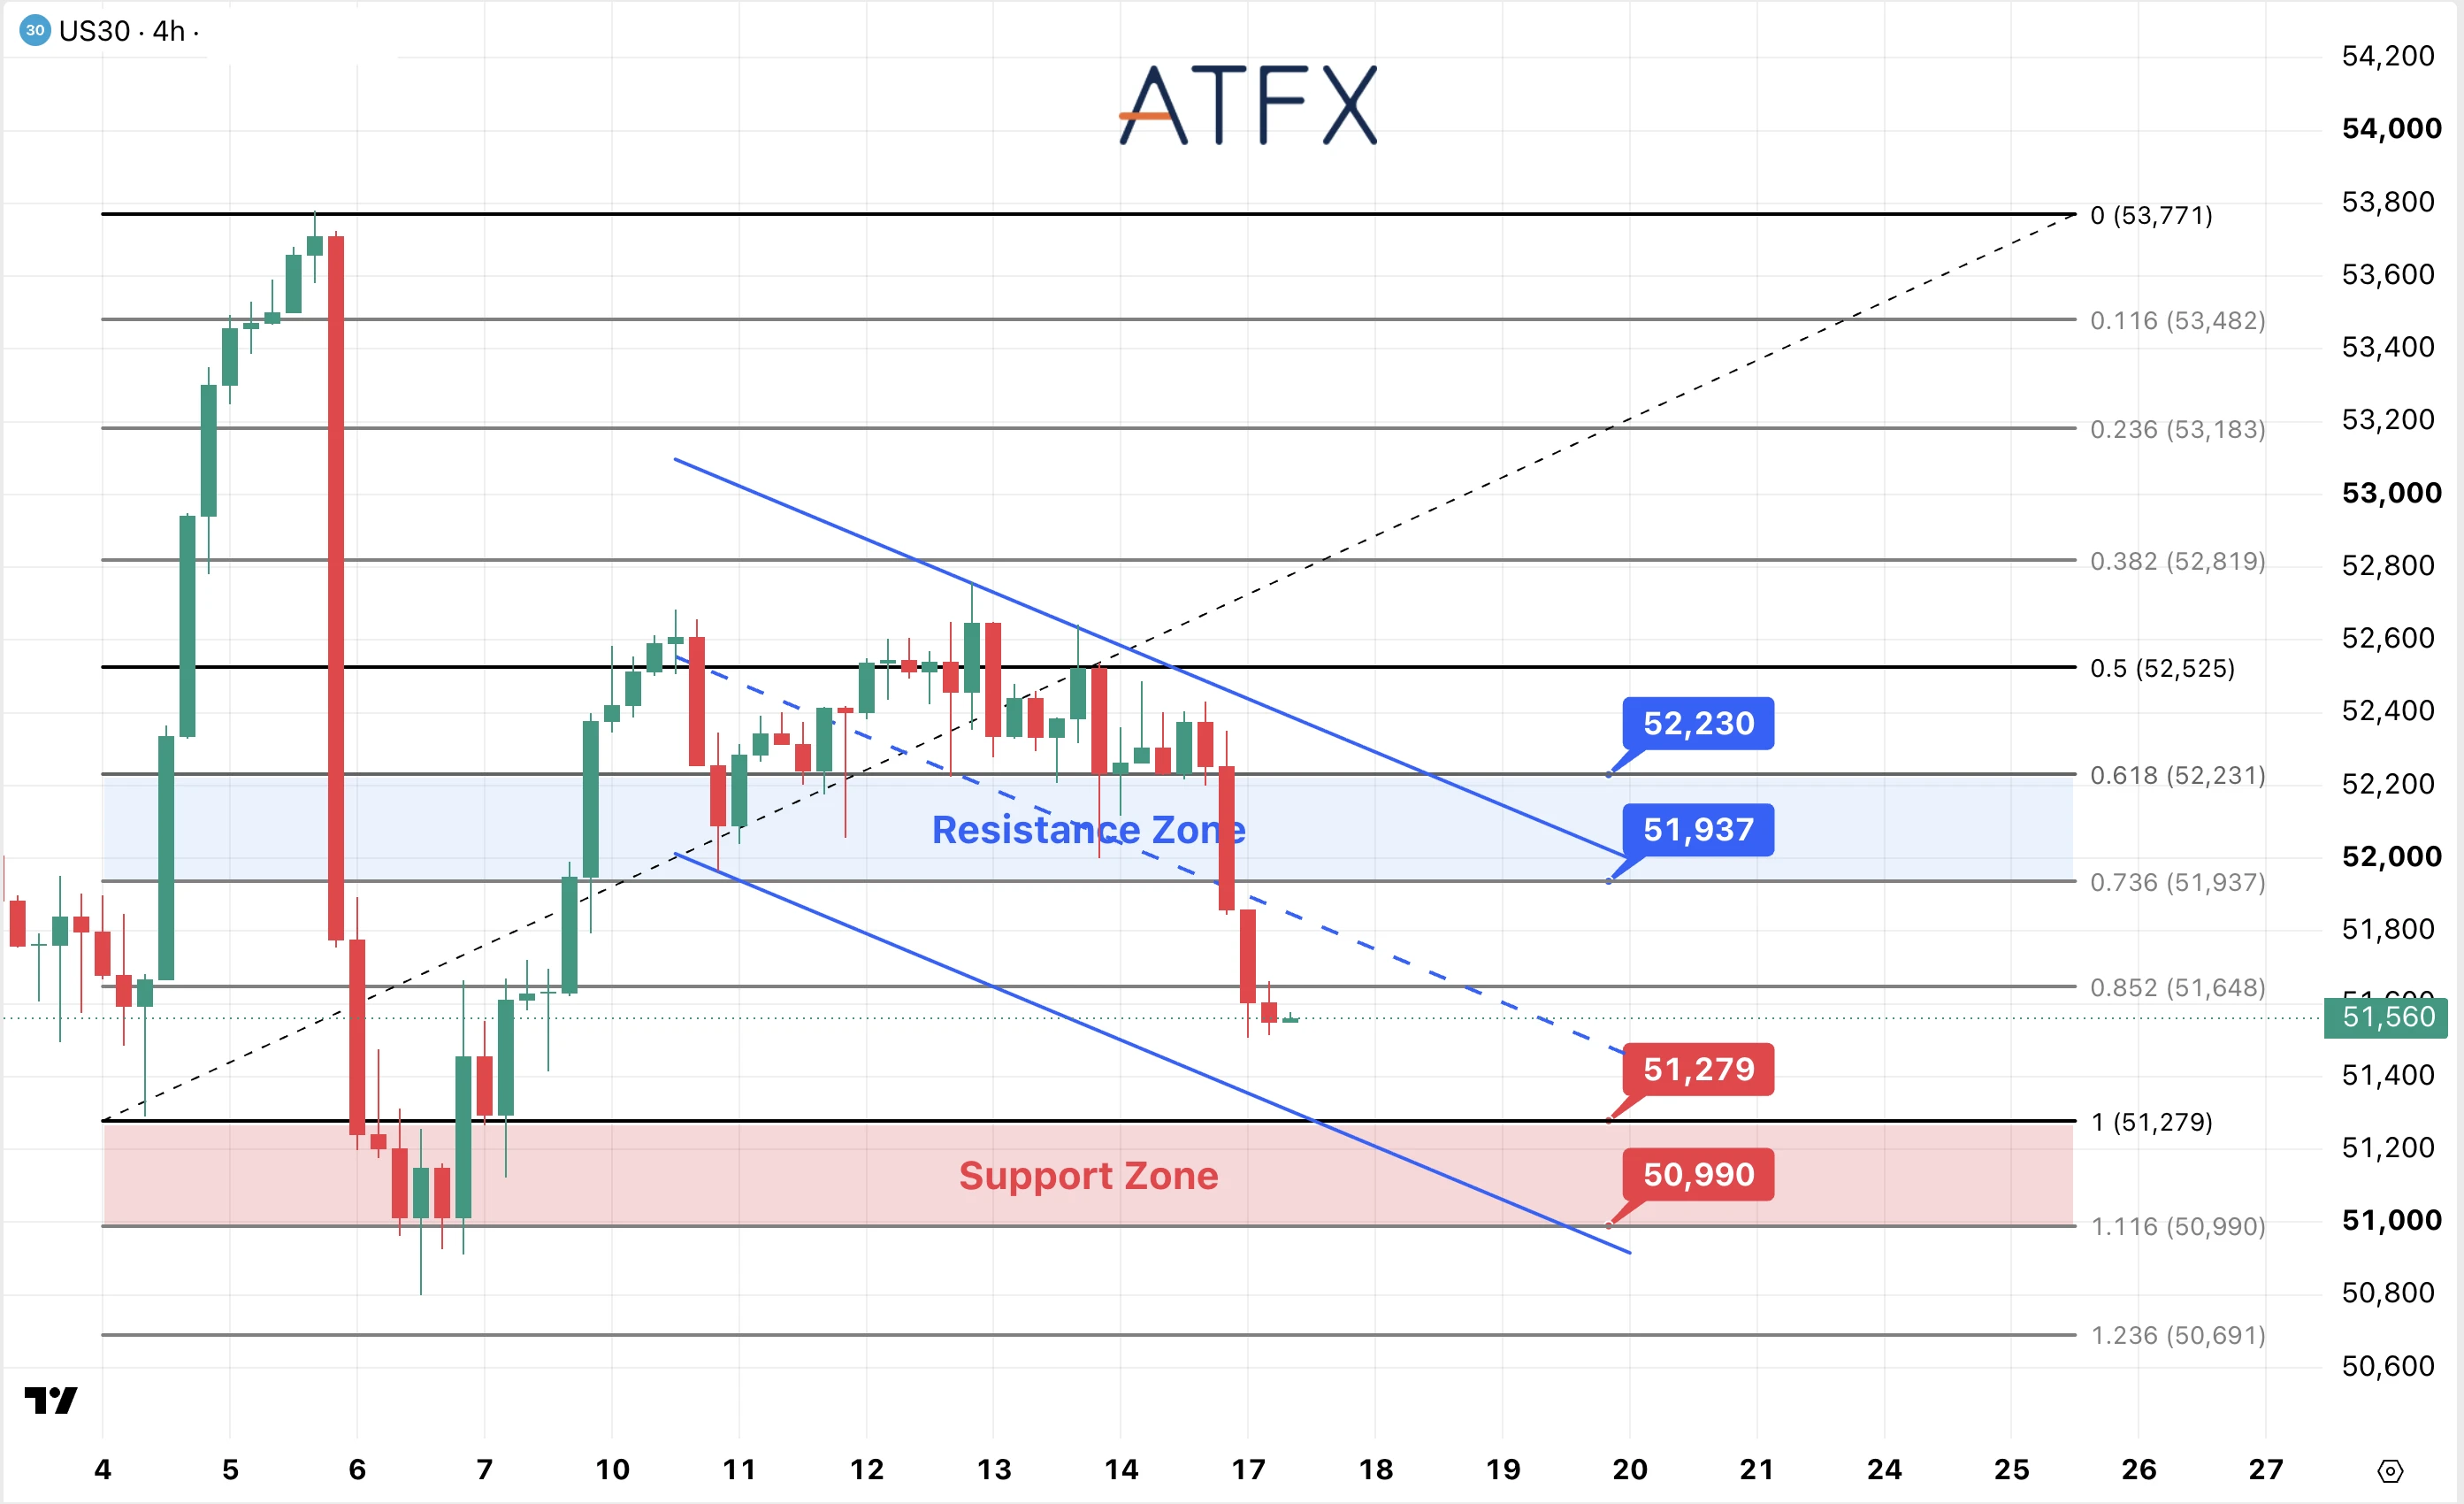
- Resistance: 51,937 / 52,230
- Support: 51,279 / 50,990
Analyst’s View: The Dow’s 1.41% cash-market decline shows selling spread beyond technology into the broader equity market. Today’s retail sales and production figures will test whether activity remains resilient as investors anticipate further Fed tightening.
US30 is near 51,560 after breaking below 51,937 and 51,648. The earlier recovery has given way to a descending channel. Small candles suggest a pause near the lower area, but price has not regained either broken level.
If rejection below 51,648 continues, 51,279 remains vulnerable. A break below that support would expose 50,990. If the whole support zone fails, 50,691 is the next reference. Strong earnings or reassuring economic data could slow the decline, but a brief bounce alone would not confirm a reversal.
Bias: Bearish
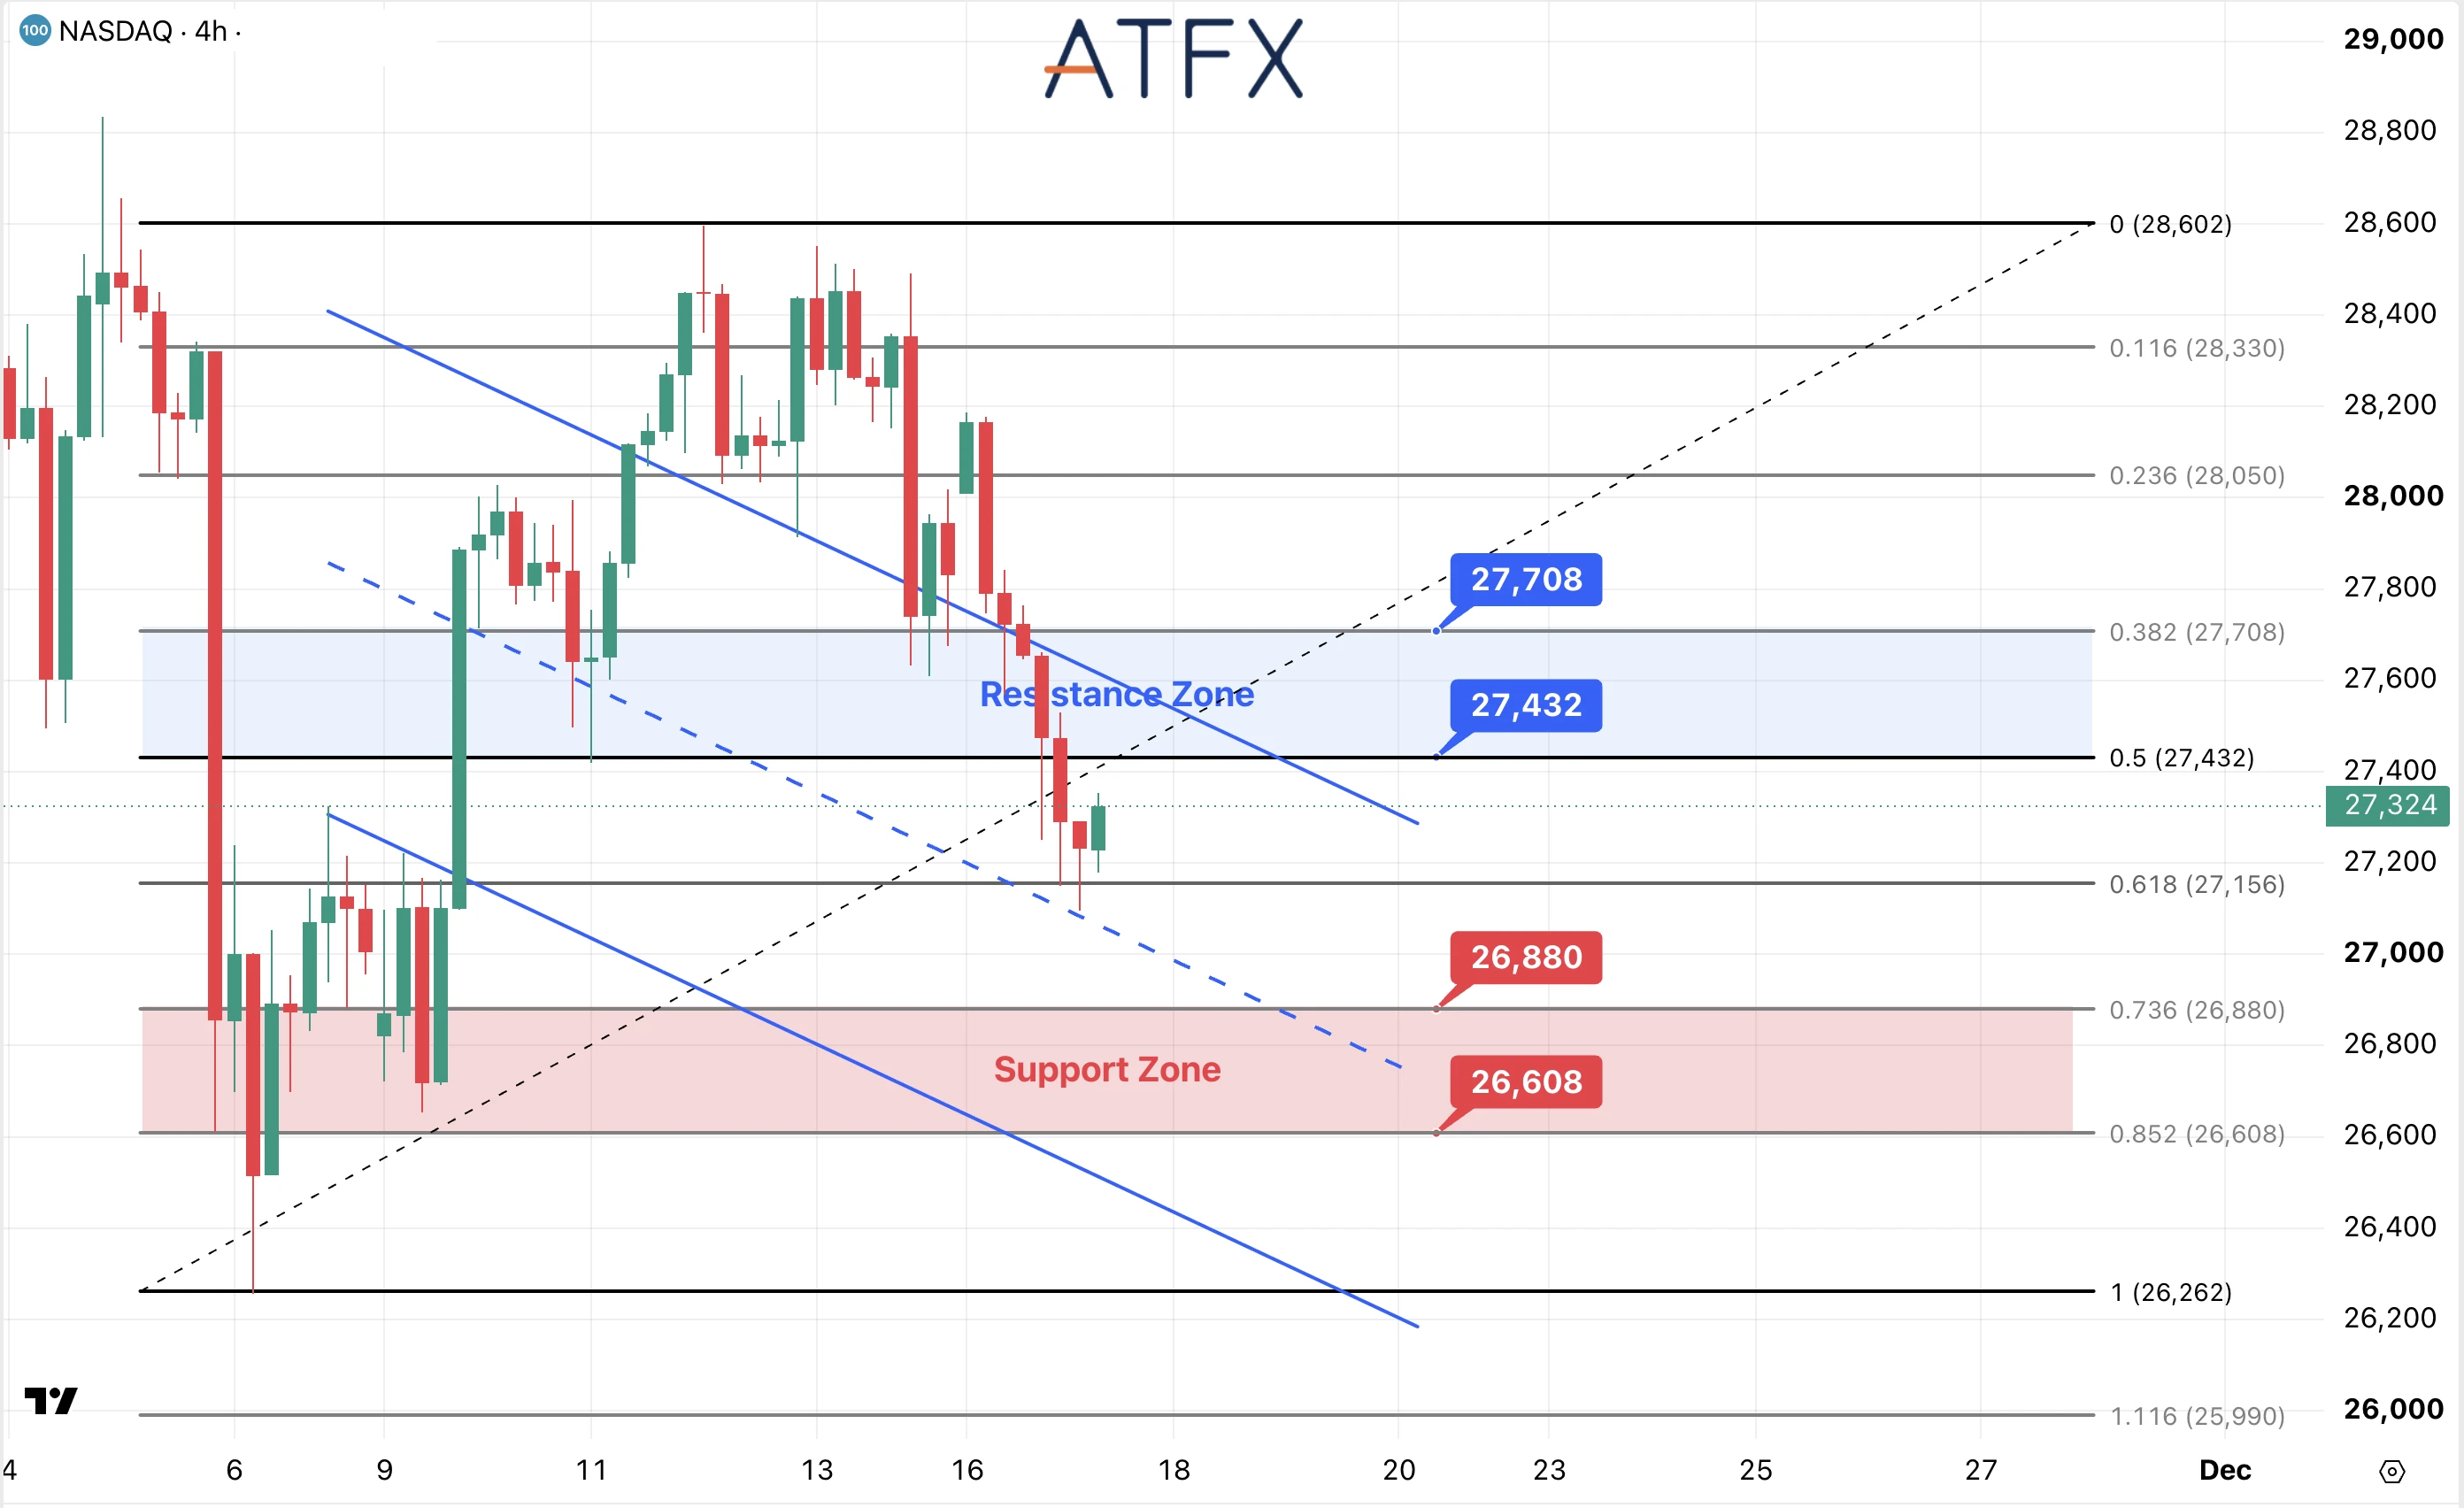
- Resistance: 27,432 / 27,708
- Support: 26,880 / 26,608
Analyst’s View: Nvidia’s results are the key company-level catalyst for tech shares. Investors will assess AI demand, margins, and guidance under interim leadership, along with uncertainty over access to the Chinese market. Clear reassurance could support a rebound; disappointment could deepen the sell-off.
NAS100 is near 27,324 after rebounding from 27,156. Price remains below the 27,432 level and inside a descending channel, so the bounce has recovered only part of the latest decline.
If buyers cannot regain 27,432, another test of 27,156 is possible. A break would expose 26,880 and 26,608. Losing that support zone would bring the 26,262 swing low back into focus. Earnings can cause price gaps, so confirmation after the announcement matters more than a single initial move.
Bias: Bearish below 27,432.
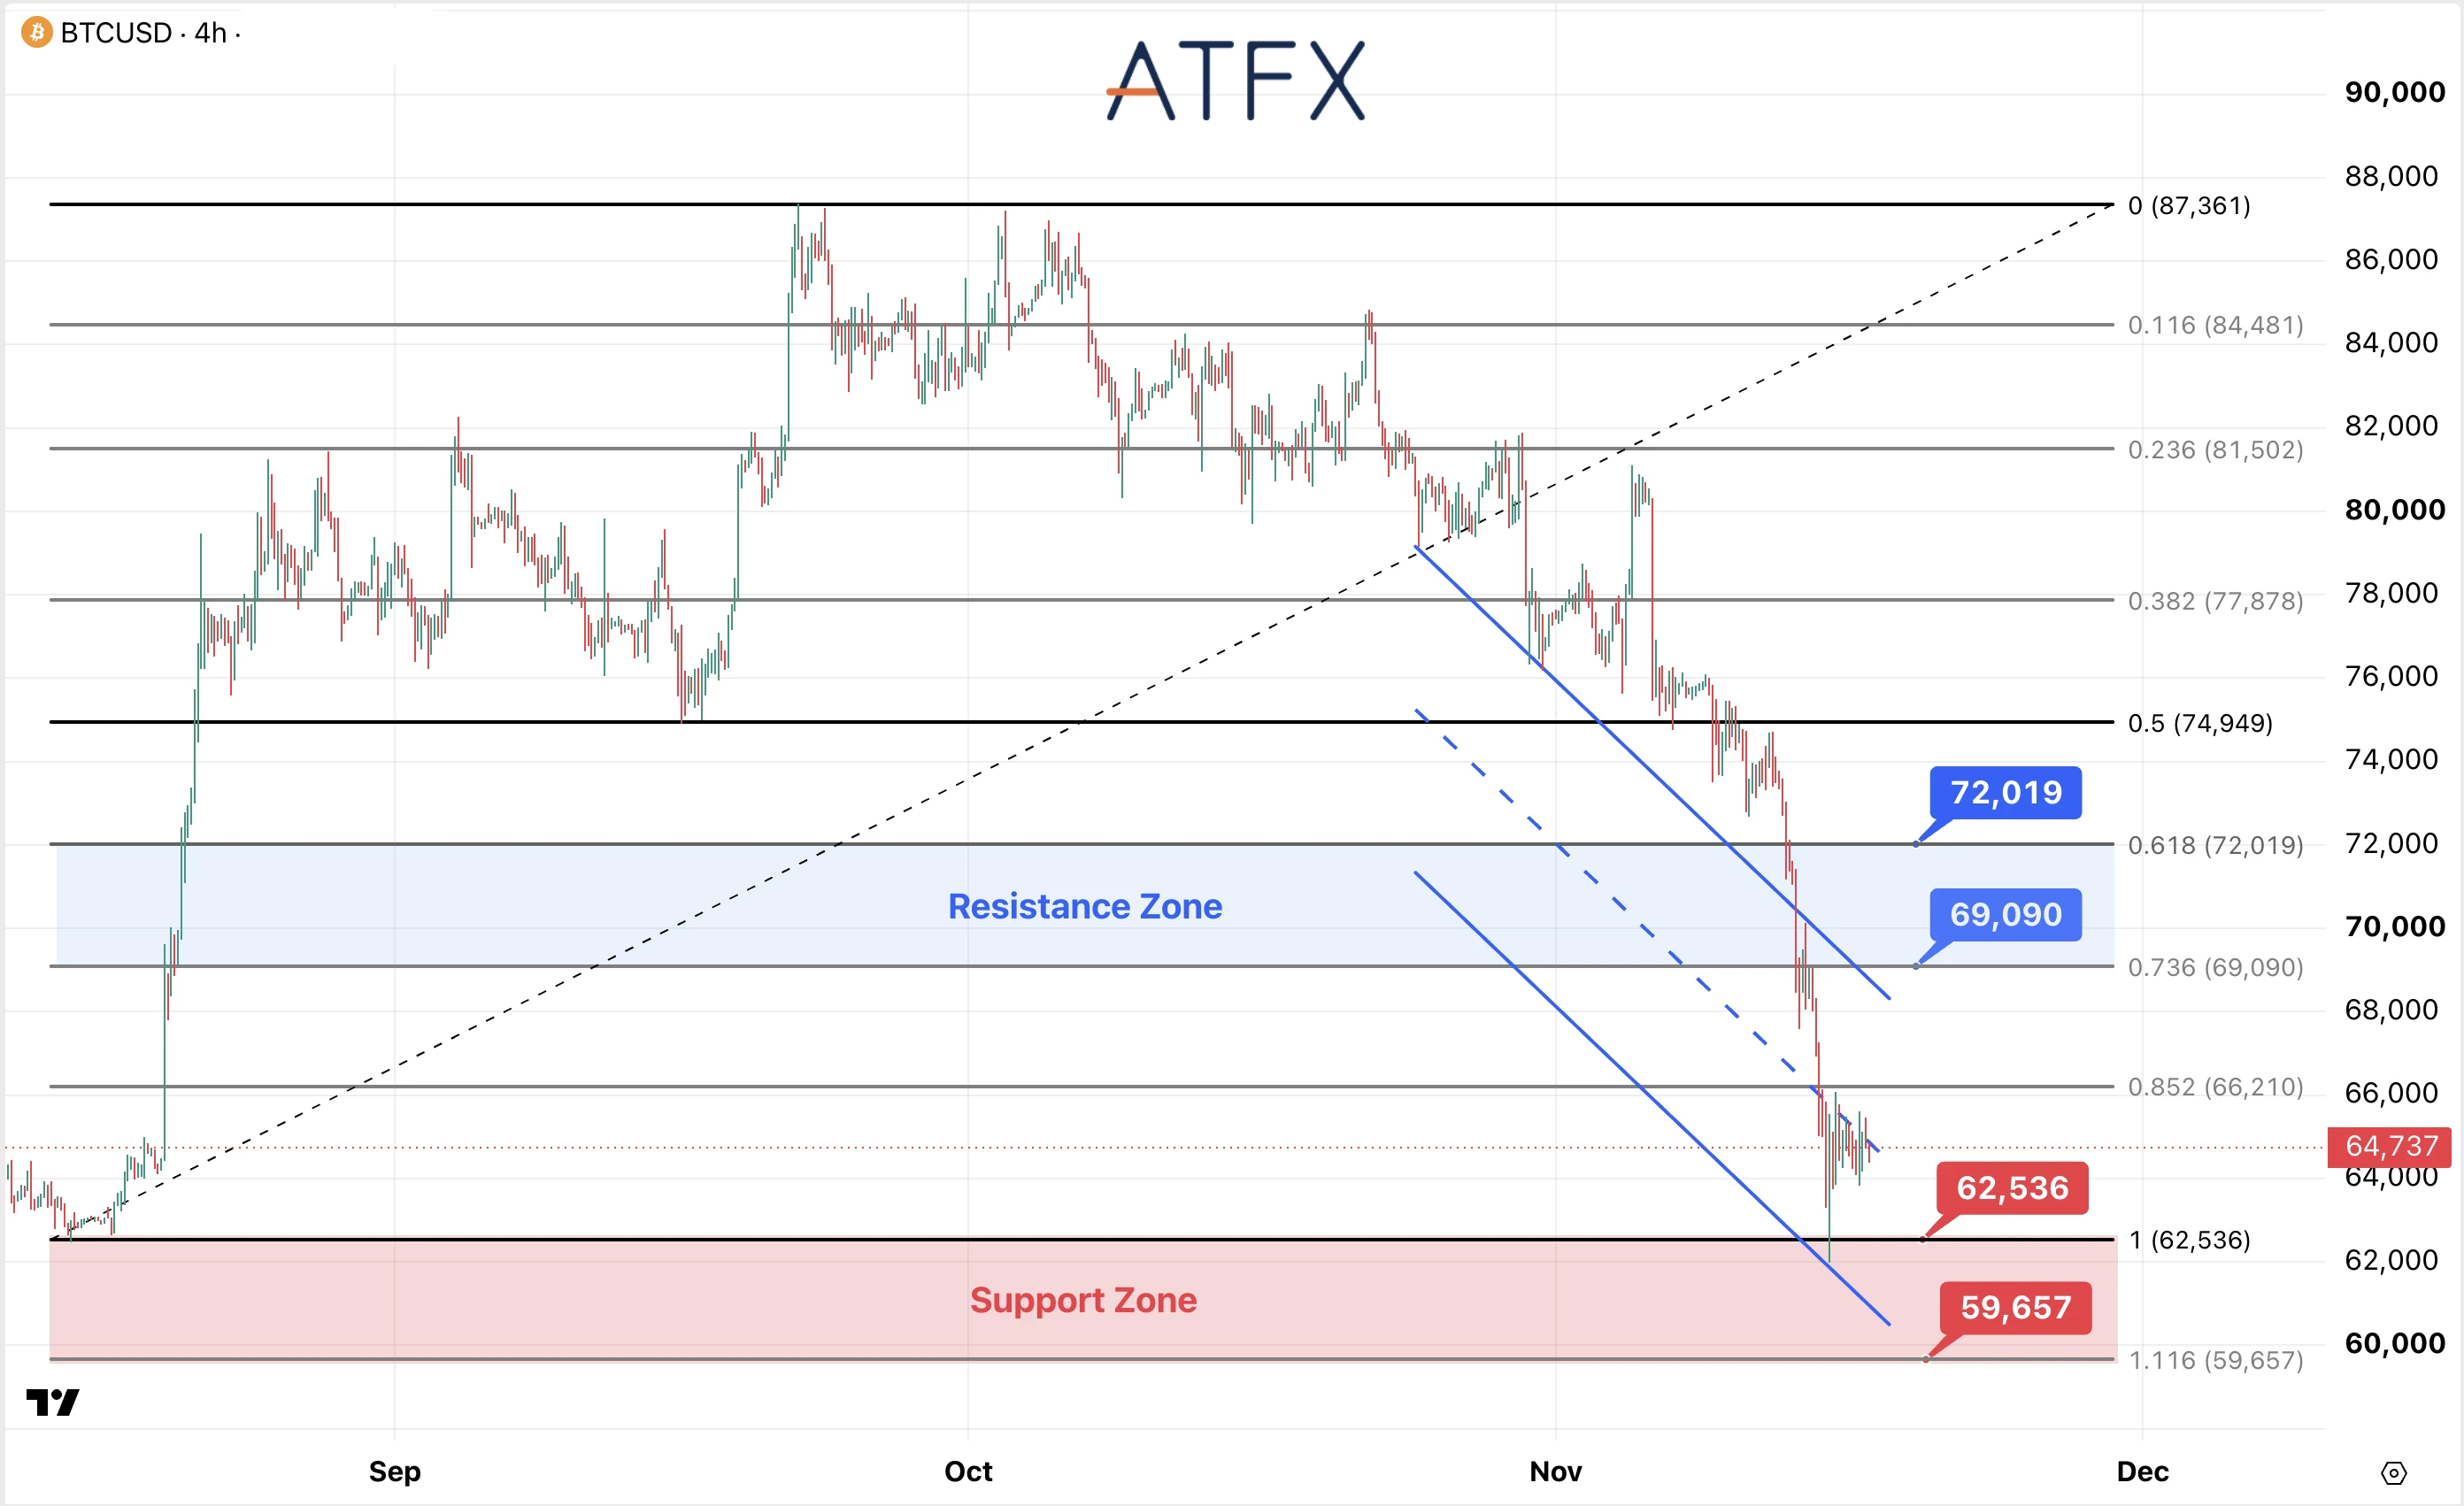
- Resistance: $69,090 / $72,019
- Support: $62,536 / $59,657
Analyst’s View: Bitcoin remains sensitive to weak risk appetite and a firm dollar. Its failure to recover during brief pauses in equity selling suggests buyers remain cautious. ETF demand and the broader response to Nvidia’s earnings are useful tests of whether confidence is returning.
Bitcoin is near $64,737 after bouncing from $62,536 support, with a brief wick toward $62,000. Price is consolidating near the midpoint of a steep descending channel and remains below $66,210.
A move back below $64,000 would put $62,536 and the recent wick low back in focus. A sustained break below this area would expose $59,657. Holding the recent lows would support consolidation, but price must regain resistance to signal a meaningful trend change.
Bias: Bearish
Disclaimer: This analysis is for informational purposes only and does not constitute investment advice.