


Key Takeaways
The shift lifted Treasury yields and the dollar, weighing on gold and equities. Oil remains sensitive to conflicting signals in Iran. Hopes of fewer US strikes are pressuring prices, while shipping incidents near Hormuz and a large US crude inventory draw could limit further declines. Today’s Focus: Germany’s final October CPI is due at 15:00 GMT+8, followed by ECB President Christine Lagarde’s panel at 17:45 and OPEC’s monthly report at 20:00. Investors will watch whether Lagarde backs further tightening and whether OPEC revises its demand or supply outlook. US bond markets are closed for Veterans Day. Thursday brings UK third-quarter GDP and US initial jobless claims, with US PPI due Friday. The delayed EIA inventory report is scheduled for November 13 at 01:00 GMT+8. |
Global Market Review 11/11/2026
- On Tuesday, the Dow fell 0.30% to 52,231.89, the S&P 500 lost 0.38% to 7,520.93, and the Nasdaq Composite declined 0.74% to 25,065.87.
- Technology was the weakest S&P sector as investors reassessed borrowing costs and AI valuations.
- The market snapshot puts the dollar index at 102.24, up 0.55%.
- Two- and 10-year Treasury yields rose to 4.738% and 4.990%.
- Brent was $92.07, WTI $86.04, and spot gold $4,030.97, down 2.61%.
- Oil quotations varied across report times.
Economic Calendar
Key Events on November 11 (GMT+8)
| Time (GMT+8) | Event | Importance |
|---|---|---|
| 05:30 | US API Crude Oil Inventory Change | ★★★ |
| 15:00 | Germany October CPI (Final, YoY) | ★★ |
| 17:45 | ECB President Christine Lagarde speaks | ★★ |
| 20:00 | OPEC Monthly Oil Market Report | ★★ |
Key Events on November 12 (GMT+8)
| Time (GMT+8) | Event | Importance |
|---|---|---|
| 07:50 | Japan October Producer Prices (YoY) | ★★ |
| 15:00 | UK Third-Quarter GDP (Preliminary, QoQ) | ★★★ |
| 21:30 | US Initial Jobless Claims (Week ended November 7) | ★★ |
| 23:00 | US October Existing Home Sales | ★★ |
Markets Analysis 11/11/2026
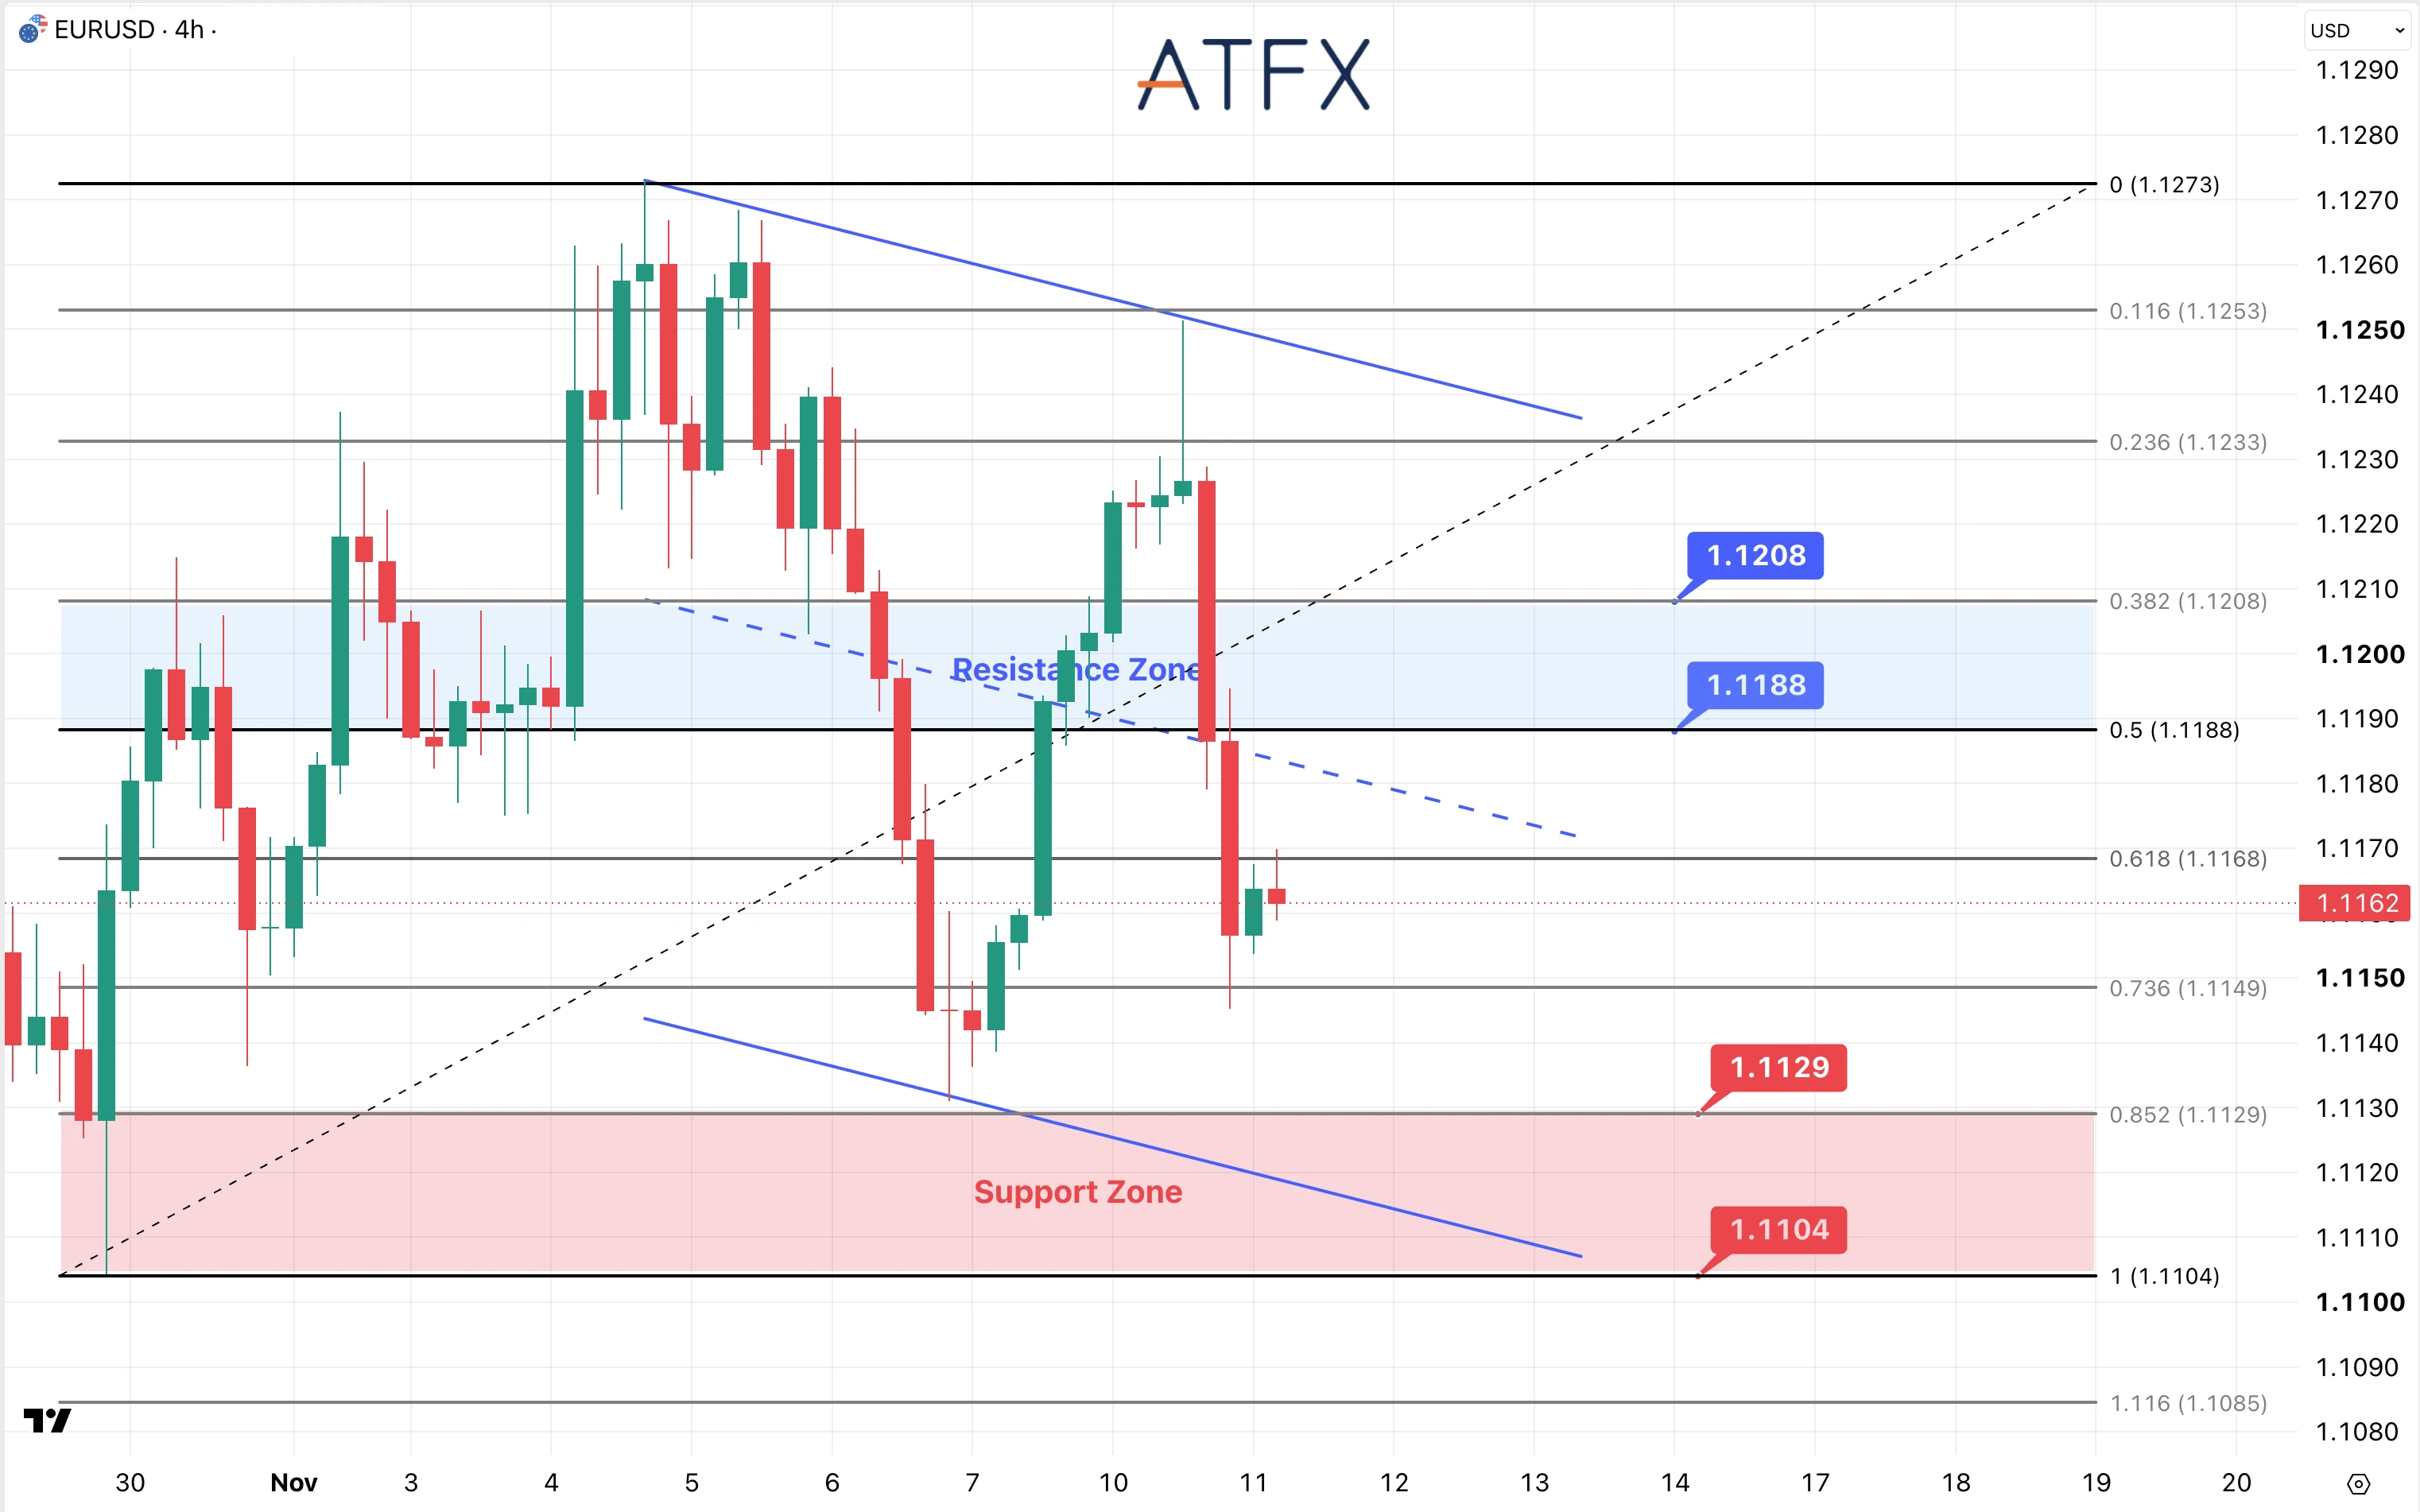
- Resistance: 1.1188 / 1.1208
- Support: 1.1129 / 1.1104
Analyst’s View: Hotter US CPI and higher Treasury yields have shifted momentum to the dollar. Lagarde’s remarks could support the euro, but a firmer ECB outlook may not offset stronger Fed hike expectations.
EUR/USD fell sharply from around 1.1225, broke below 1.1188 and 1.1168, and now sits near 1.1162 in a descending channel. A close below 1.1149 would expose 1.1129, then 1.1104. The channel’s lower boundary is nearing that support zone, making it a key test for the broader range.
Bias: Cautiously bearish
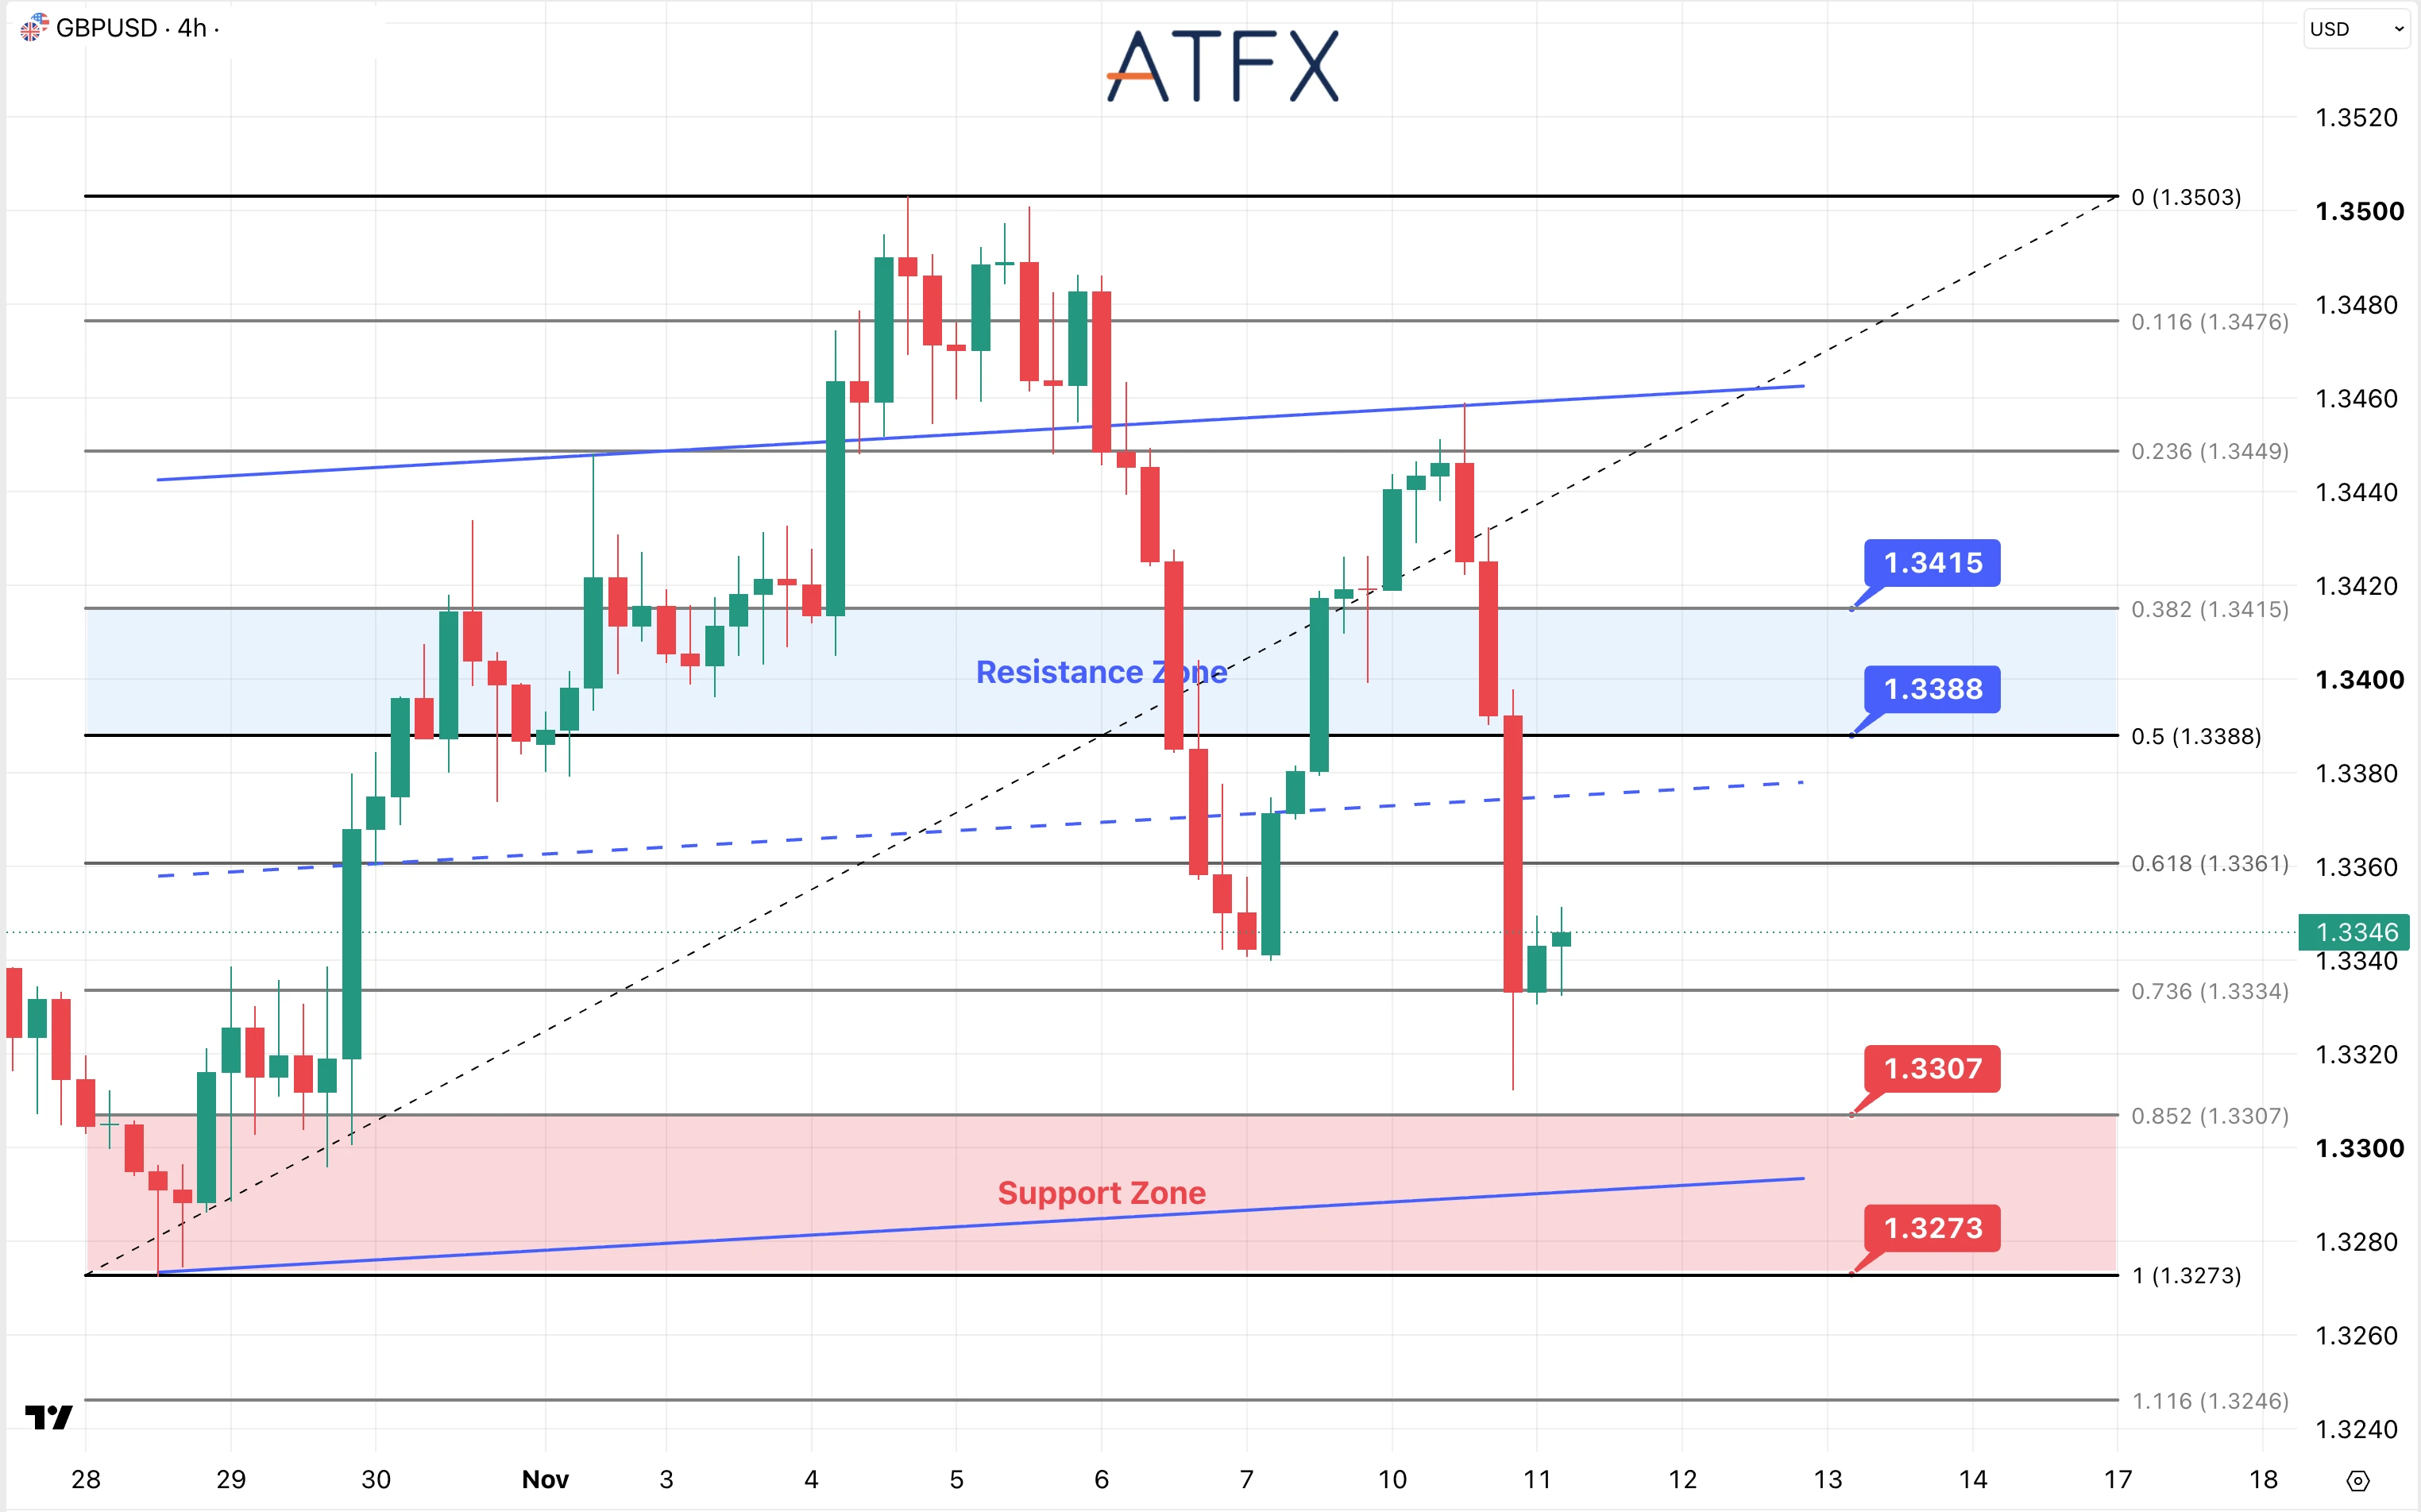
- Resistance: 1.3388 / 1.3415
- Support: 1.3307 / 1.3273
Analyst’s View: Higher US rate expectations have outweighed support from the Bank of England’s recent hike. Thursday’s UK GDP report will help gauge whether growth can withstand more tightening.
GBP/USD’s rebound stalled near 1.3449 before a sharp selloff through 1.3388 and 1.3361. Price bounced to 1.3346 after slipping below 1.3334 but remains in the lower half of the rising channel. If 1.3334 fails again, watch 1.3307 and 1.3273. A break below 1.3273 would weaken the channel and expose 1.3246.
Bias: Cautiously bearish
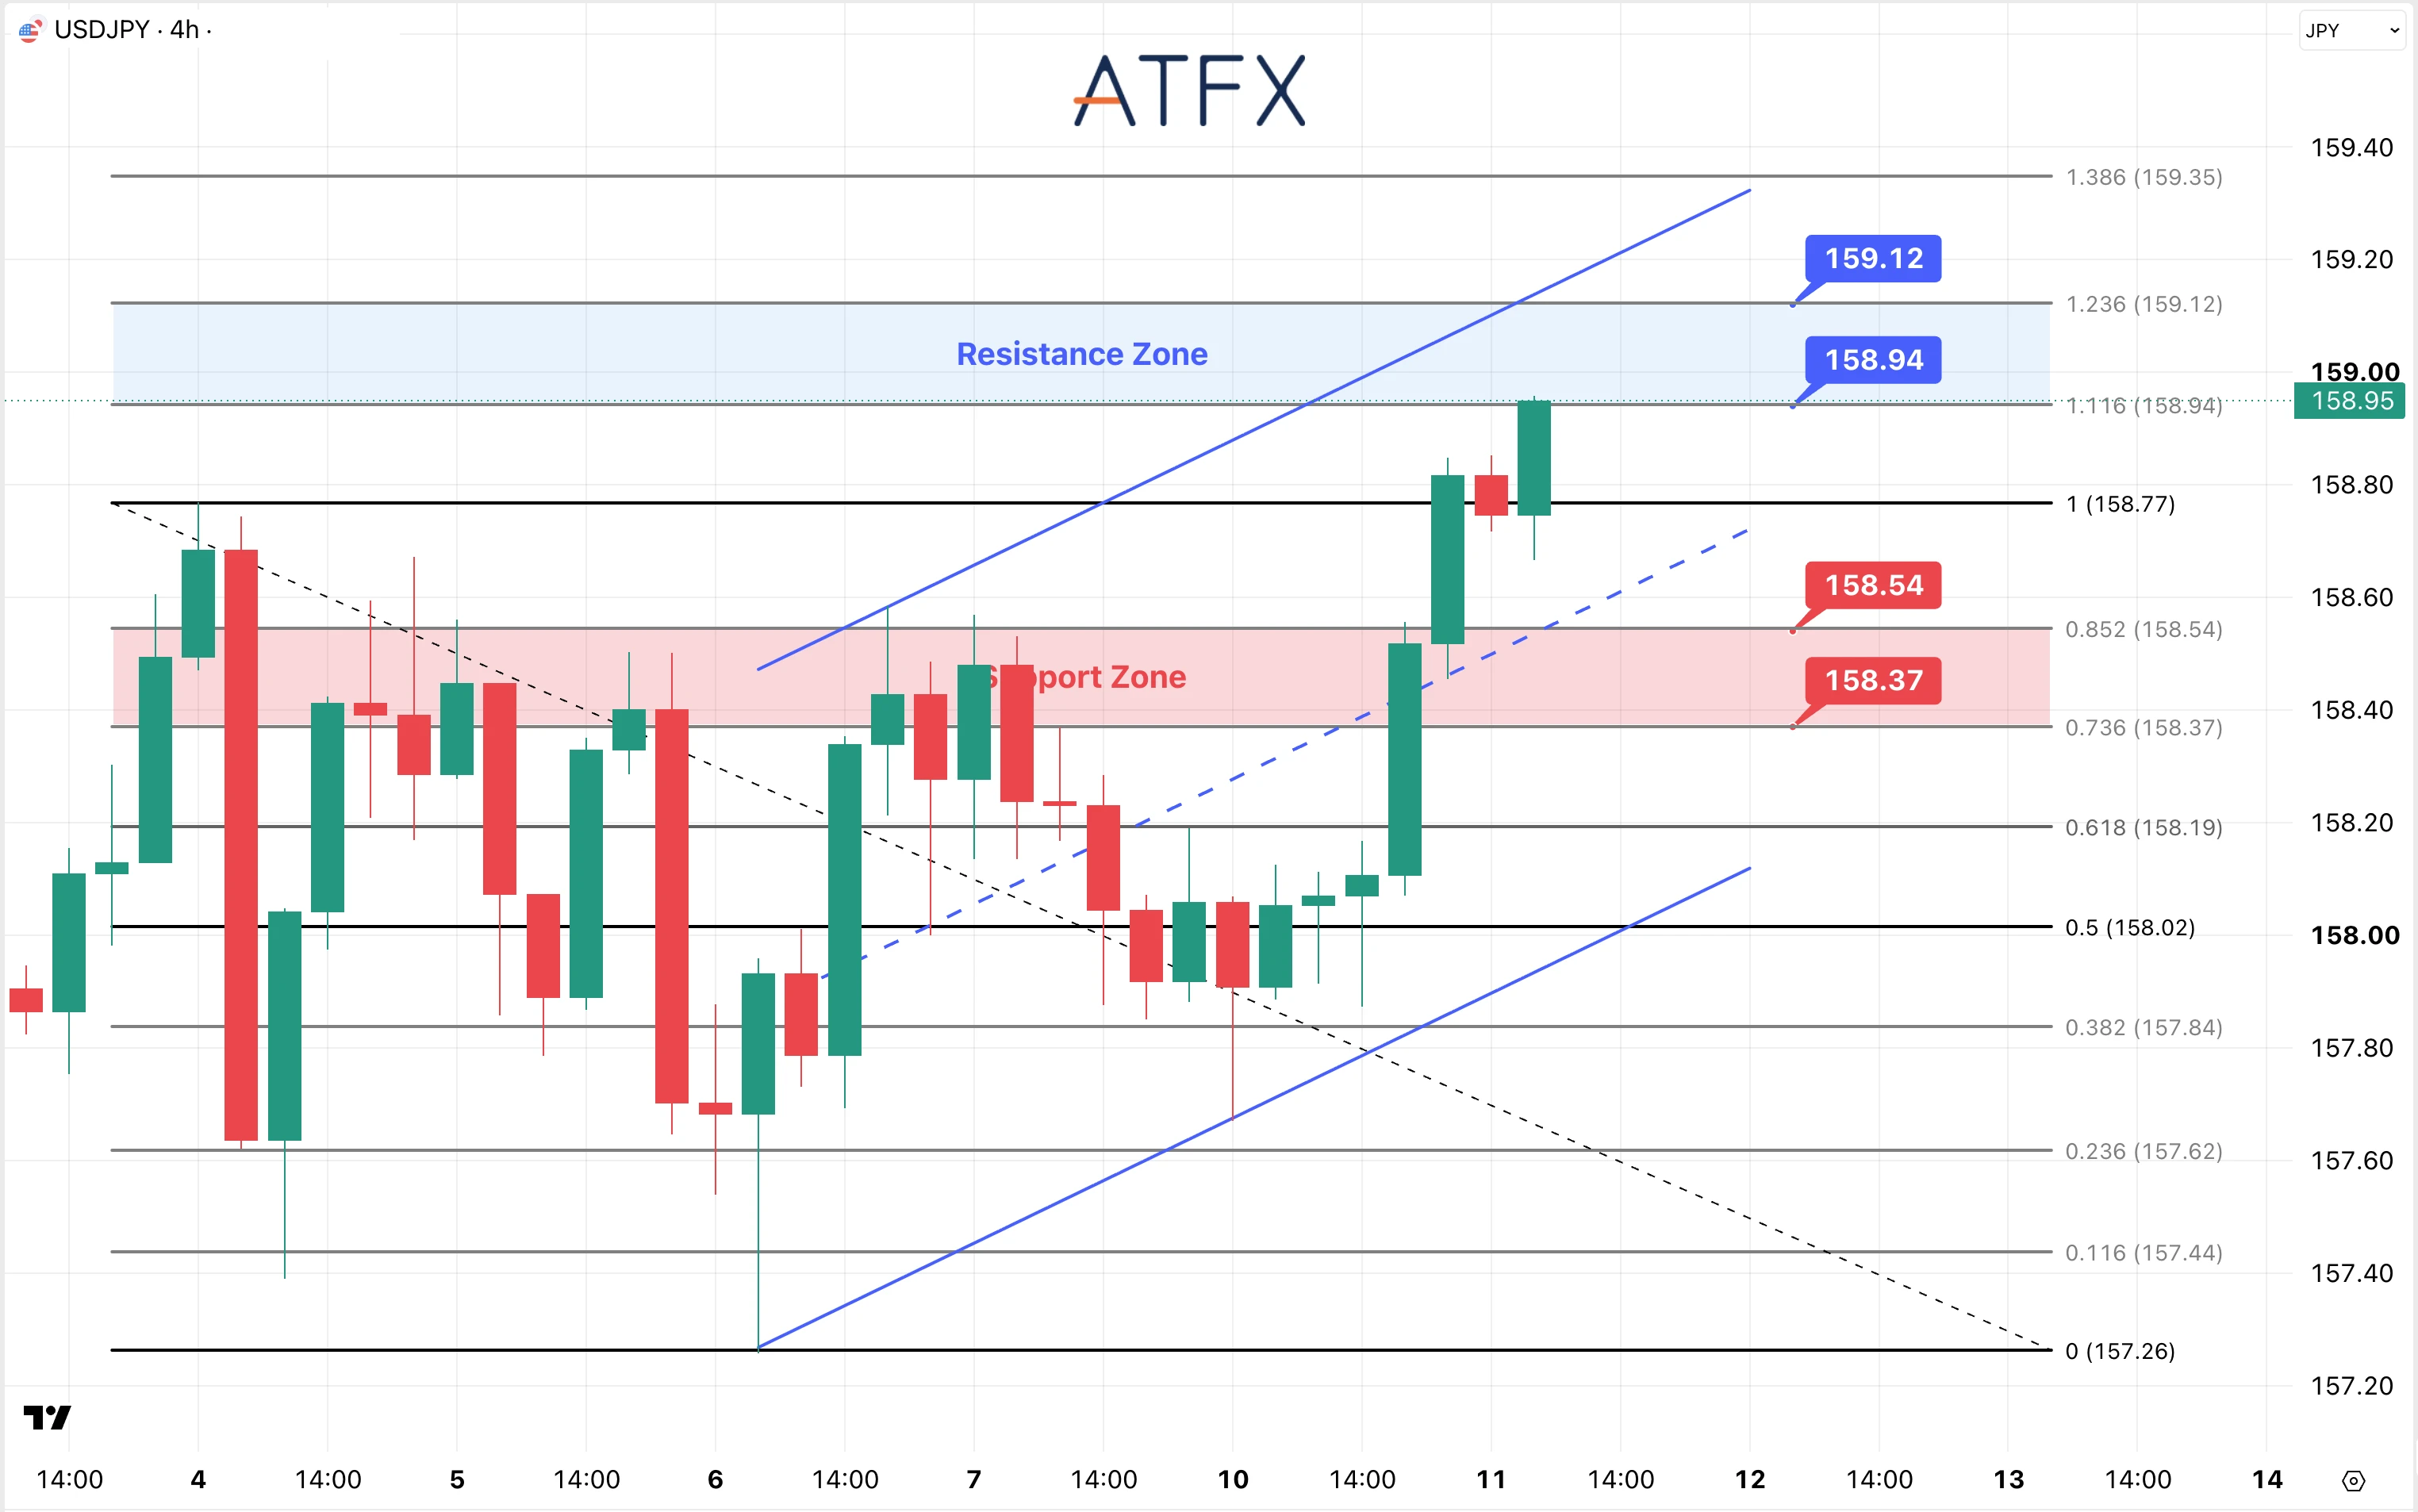
- Resistance: 158.94 / 159.12
- Support: 158.54 / 158.37
Analyst’s View: Rising US yields support USD/JPY, even as markets expect another BoJ hike. Intervention risk may cap gains as the pair nears 159.
USD/JPY has broken above 158.54 and the prior swing high at 158.77, reaching 158.95. Price is above the rising channel’s midpoint and approaching the 158.94–159.12 resistance zone. A four-hour close above 159.12 would strengthen the breakout and bring 159.35 into view. A pullback that holds 158.77 would also preserve the recovery structure.
Bias: Cautiously bullish
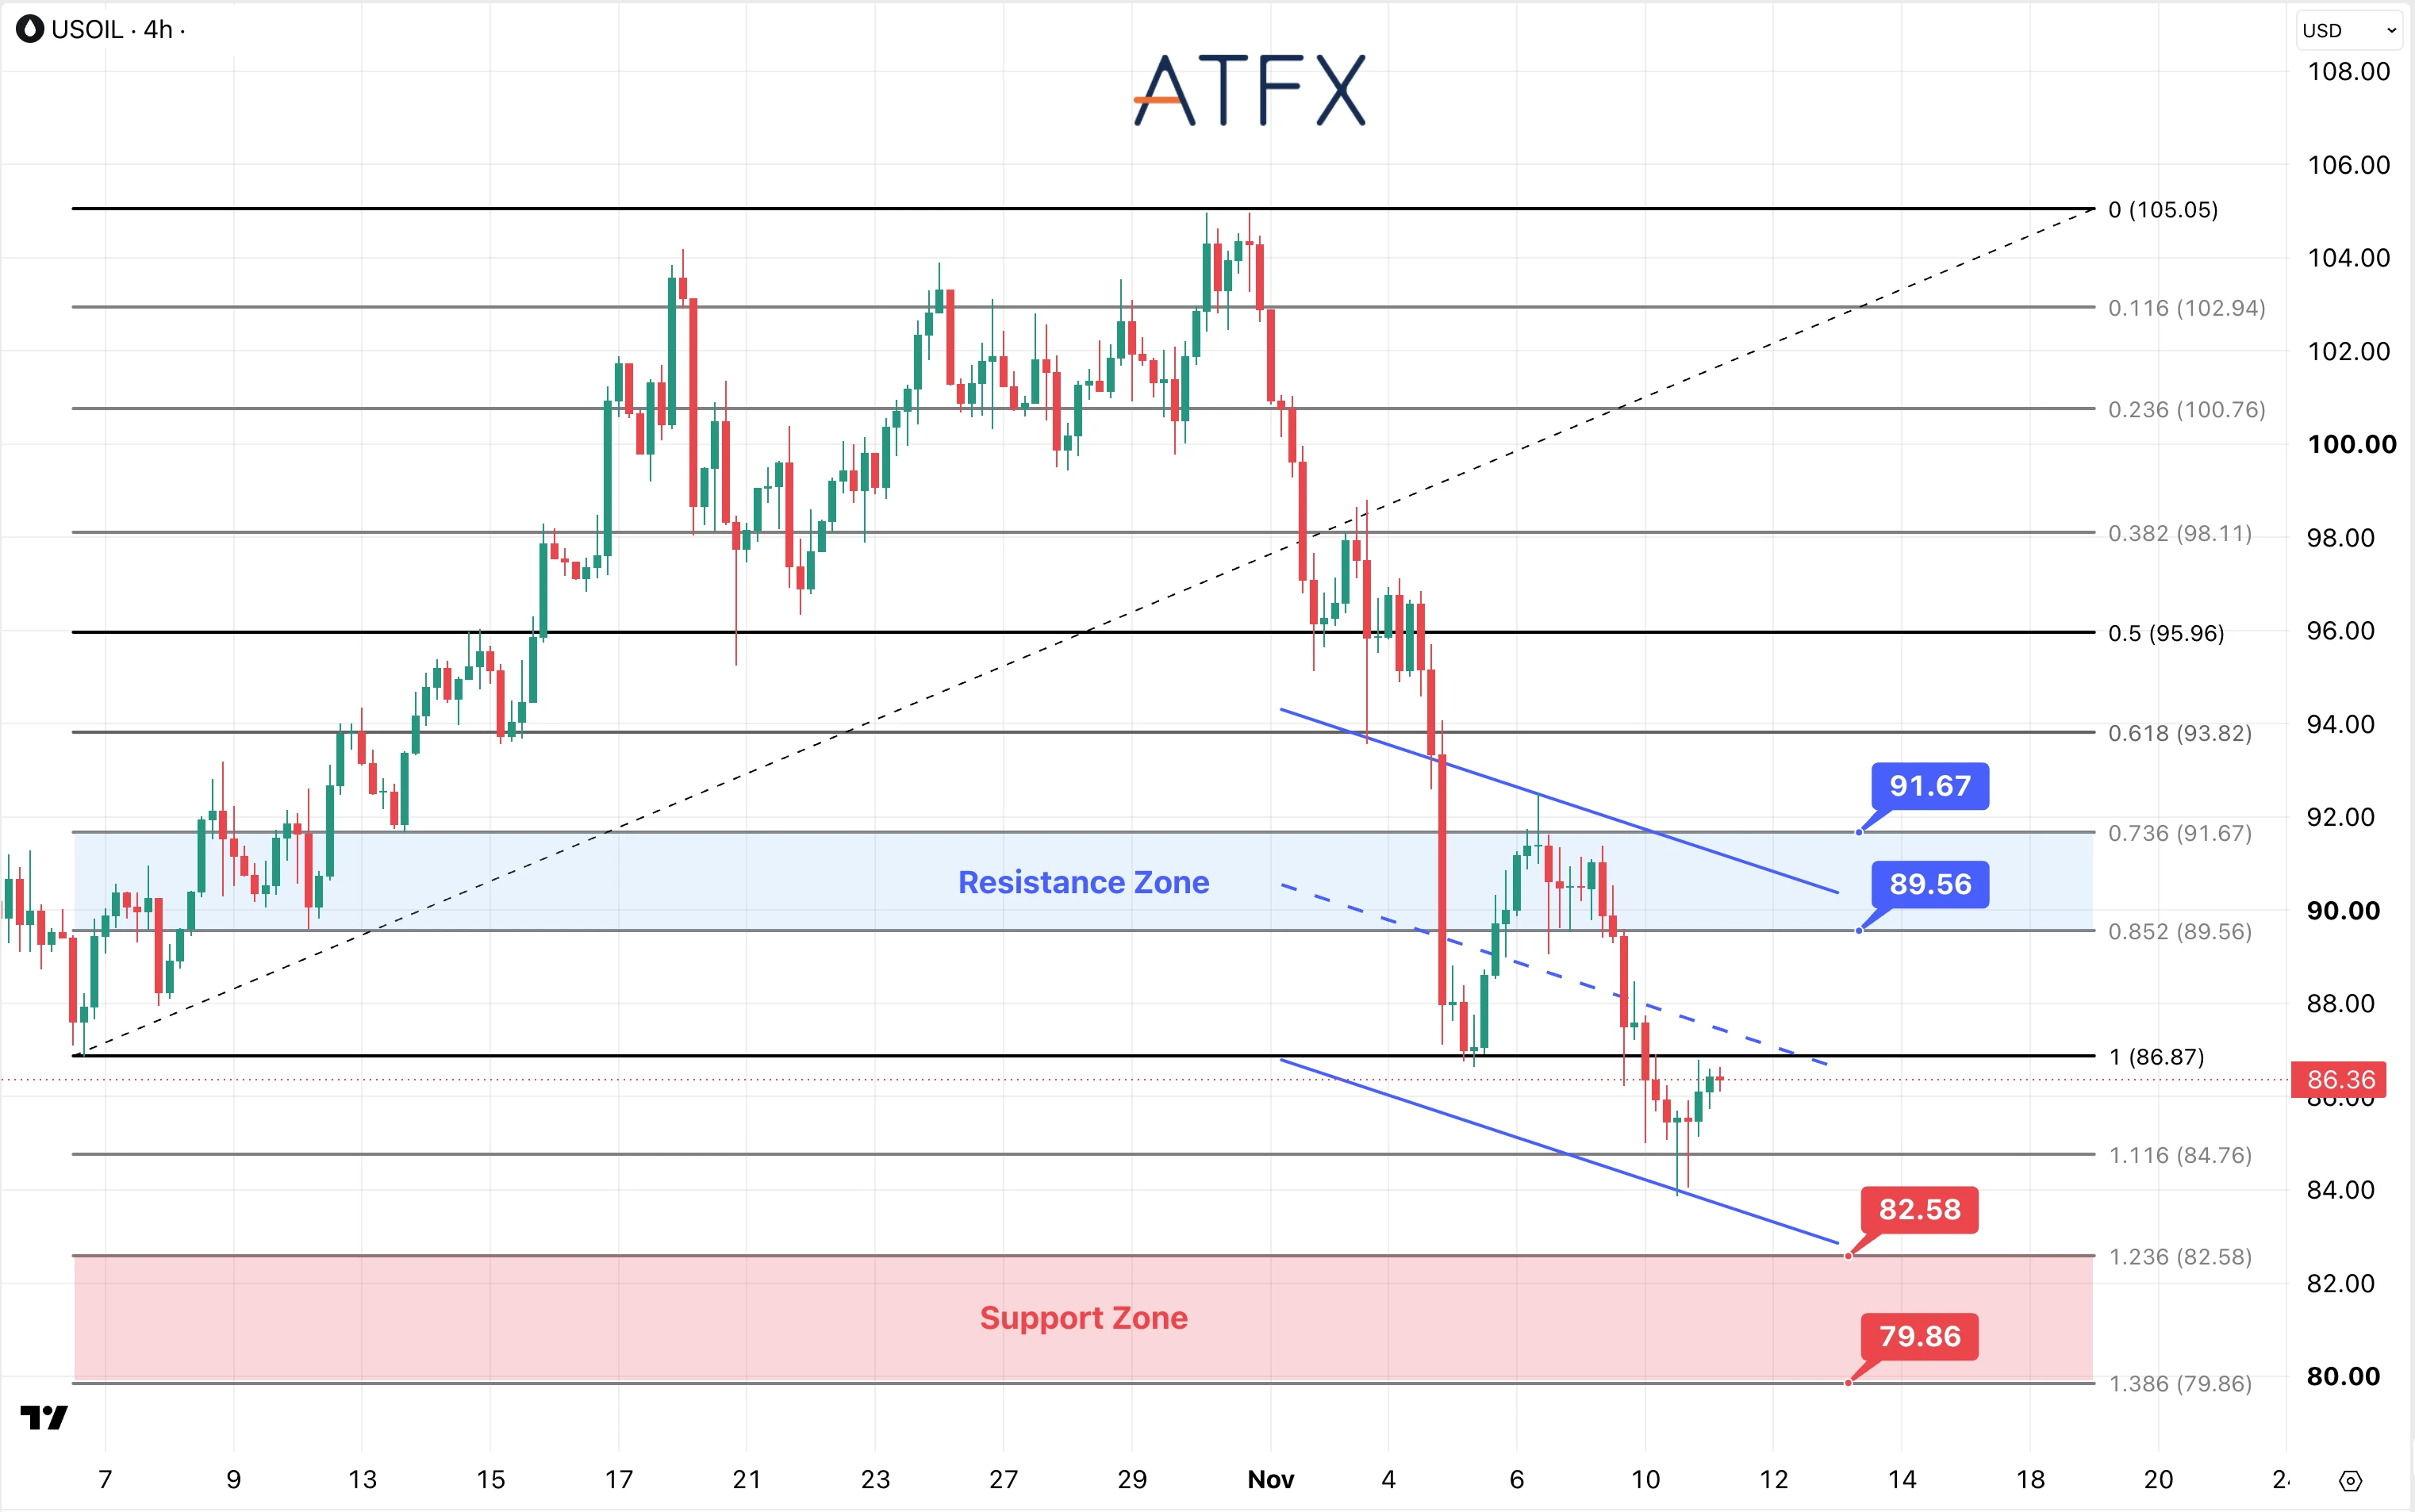
- Resistance: $89.56 / $91.67
- Support: $82.58 / $79.86
Analyst’s View: Iran peace hopes are weighing on oil, while Hormuz shipping risks and the API’s 9.8-million-barrel crude draw offer support. EIA data on Friday at 01:00 GMT+8 will test the inventory signal.
WTI rebounded from near $84 at the descending channel’s lower boundary to $86.36. It remains below the former $86.87 swing low and the channel midpoint, so the rebound is unconfirmed. A close back below $84.76 would pressure the recent low near $84. A fresh break lower would bring $82.58 into focus, followed by $79.86.
Bias: Cautiously bearish
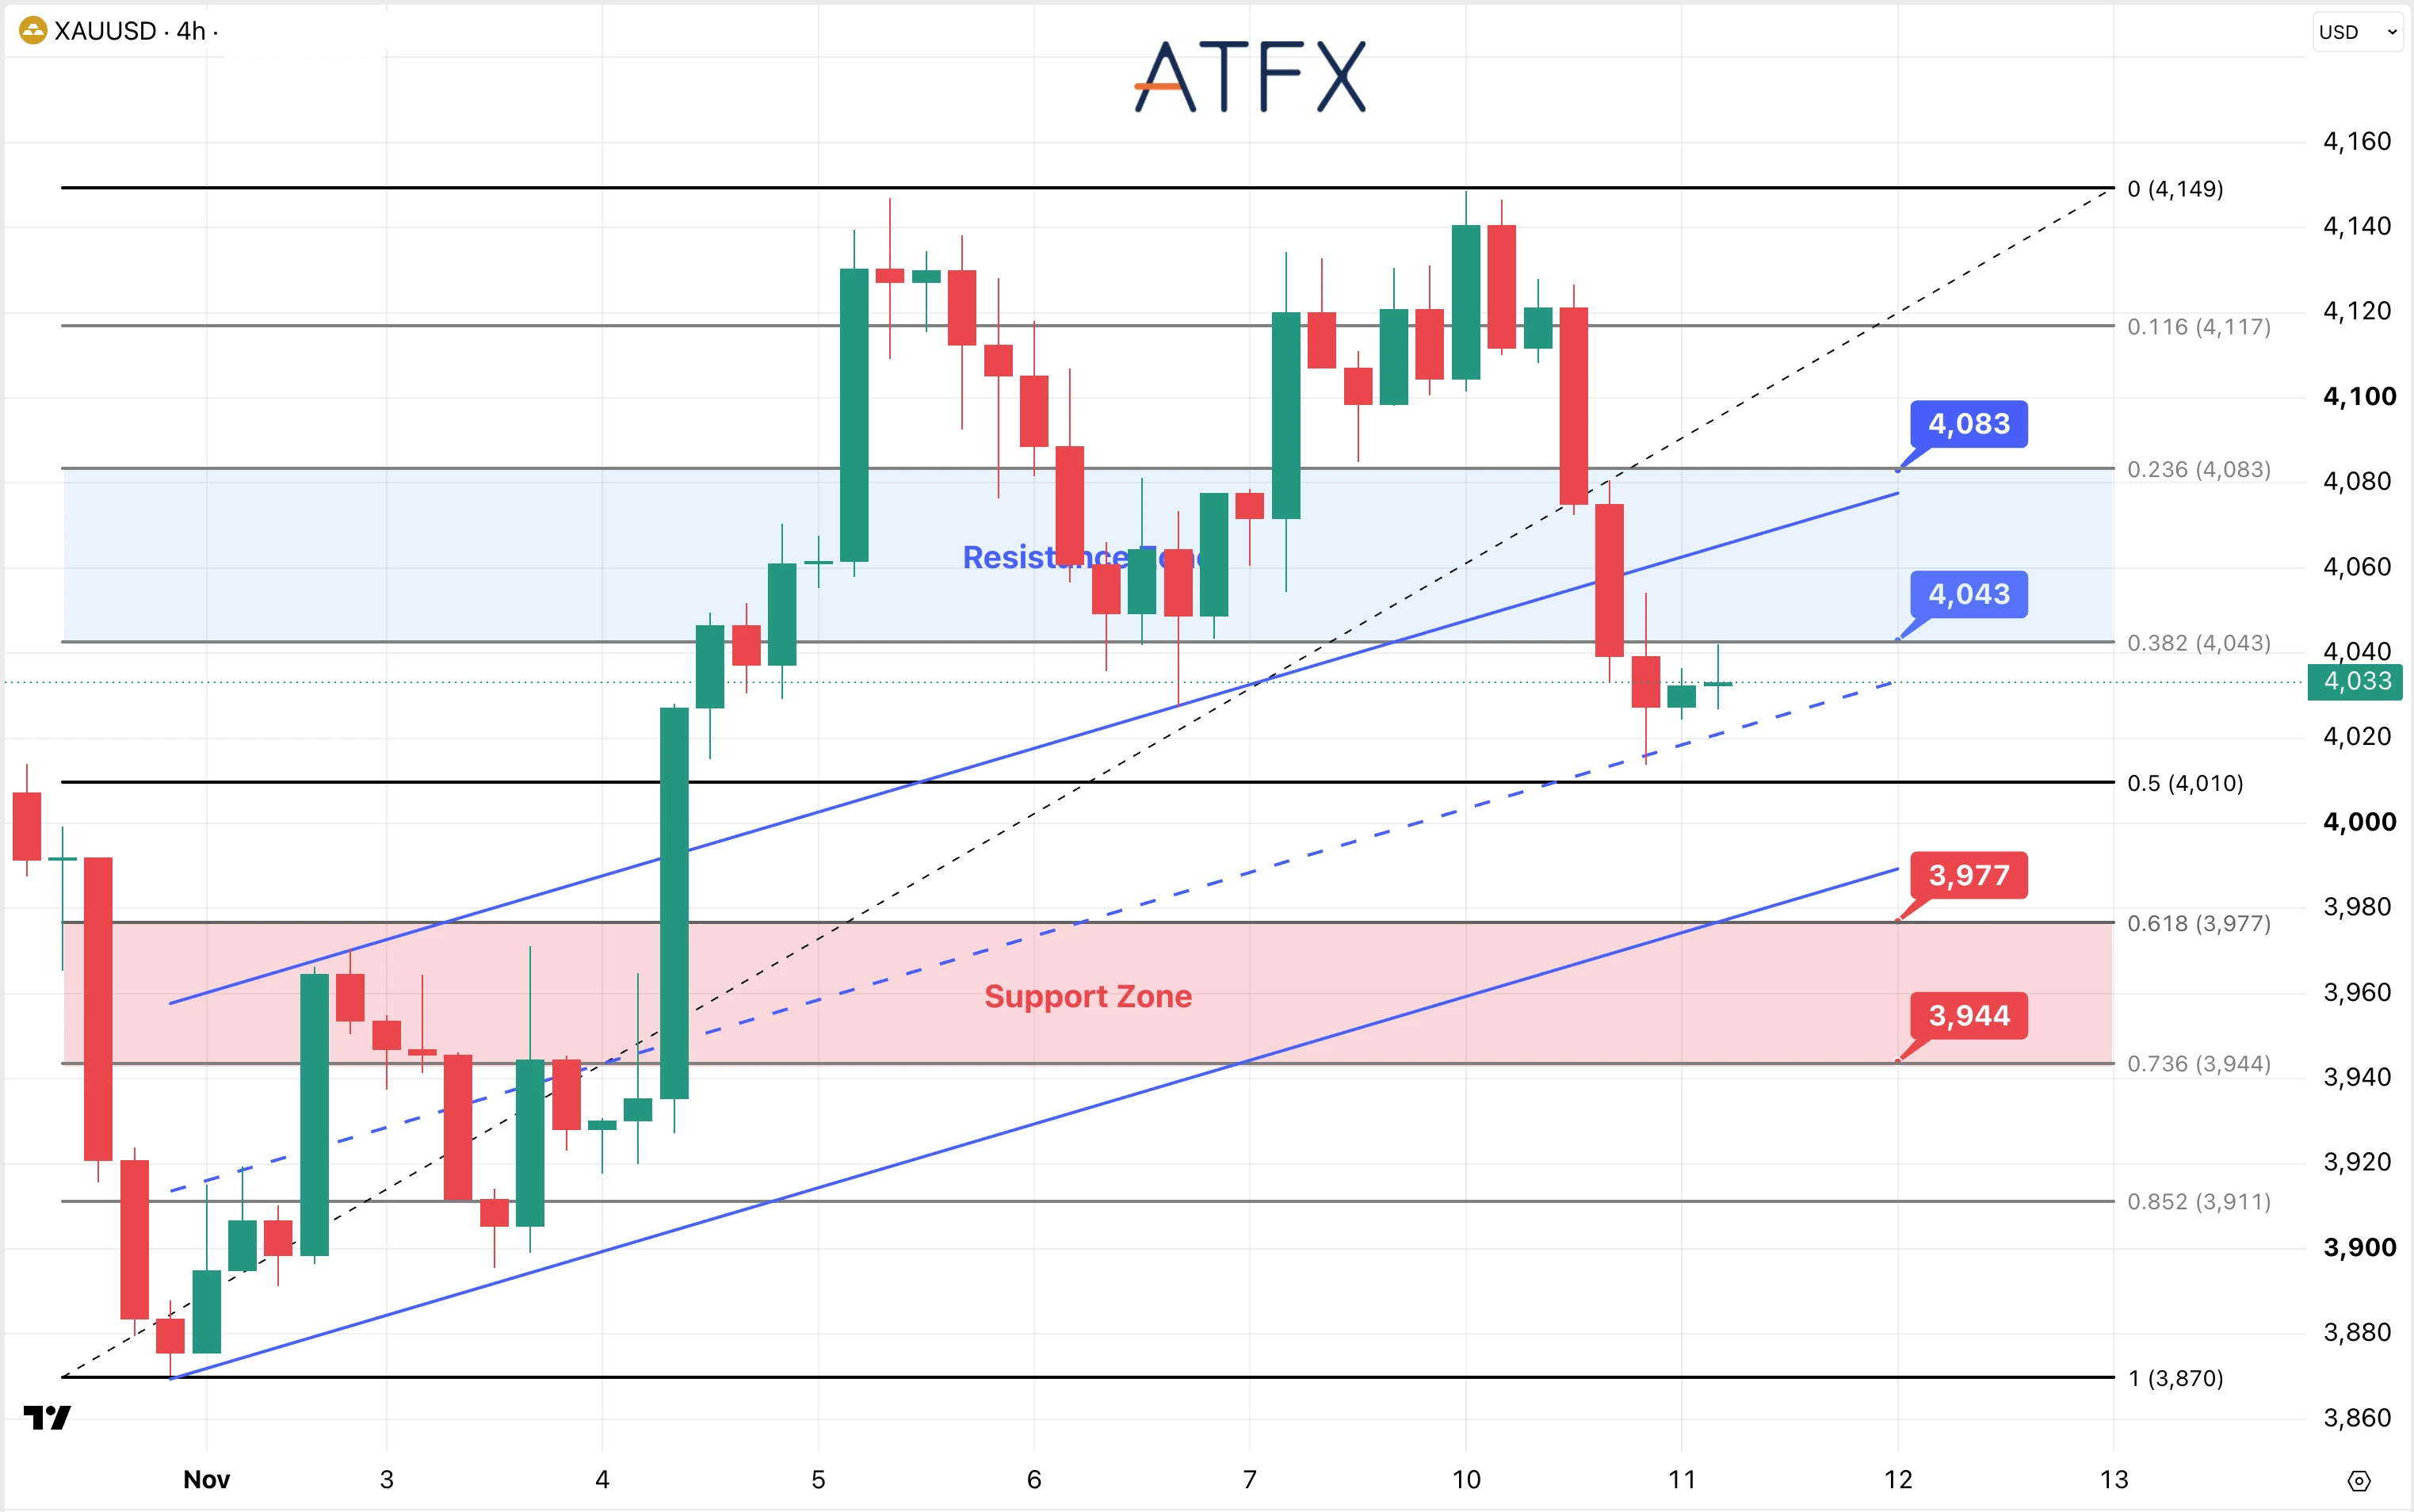
- Resistance: $4,043 / $4,083
- Support: $3,977 / $3,944
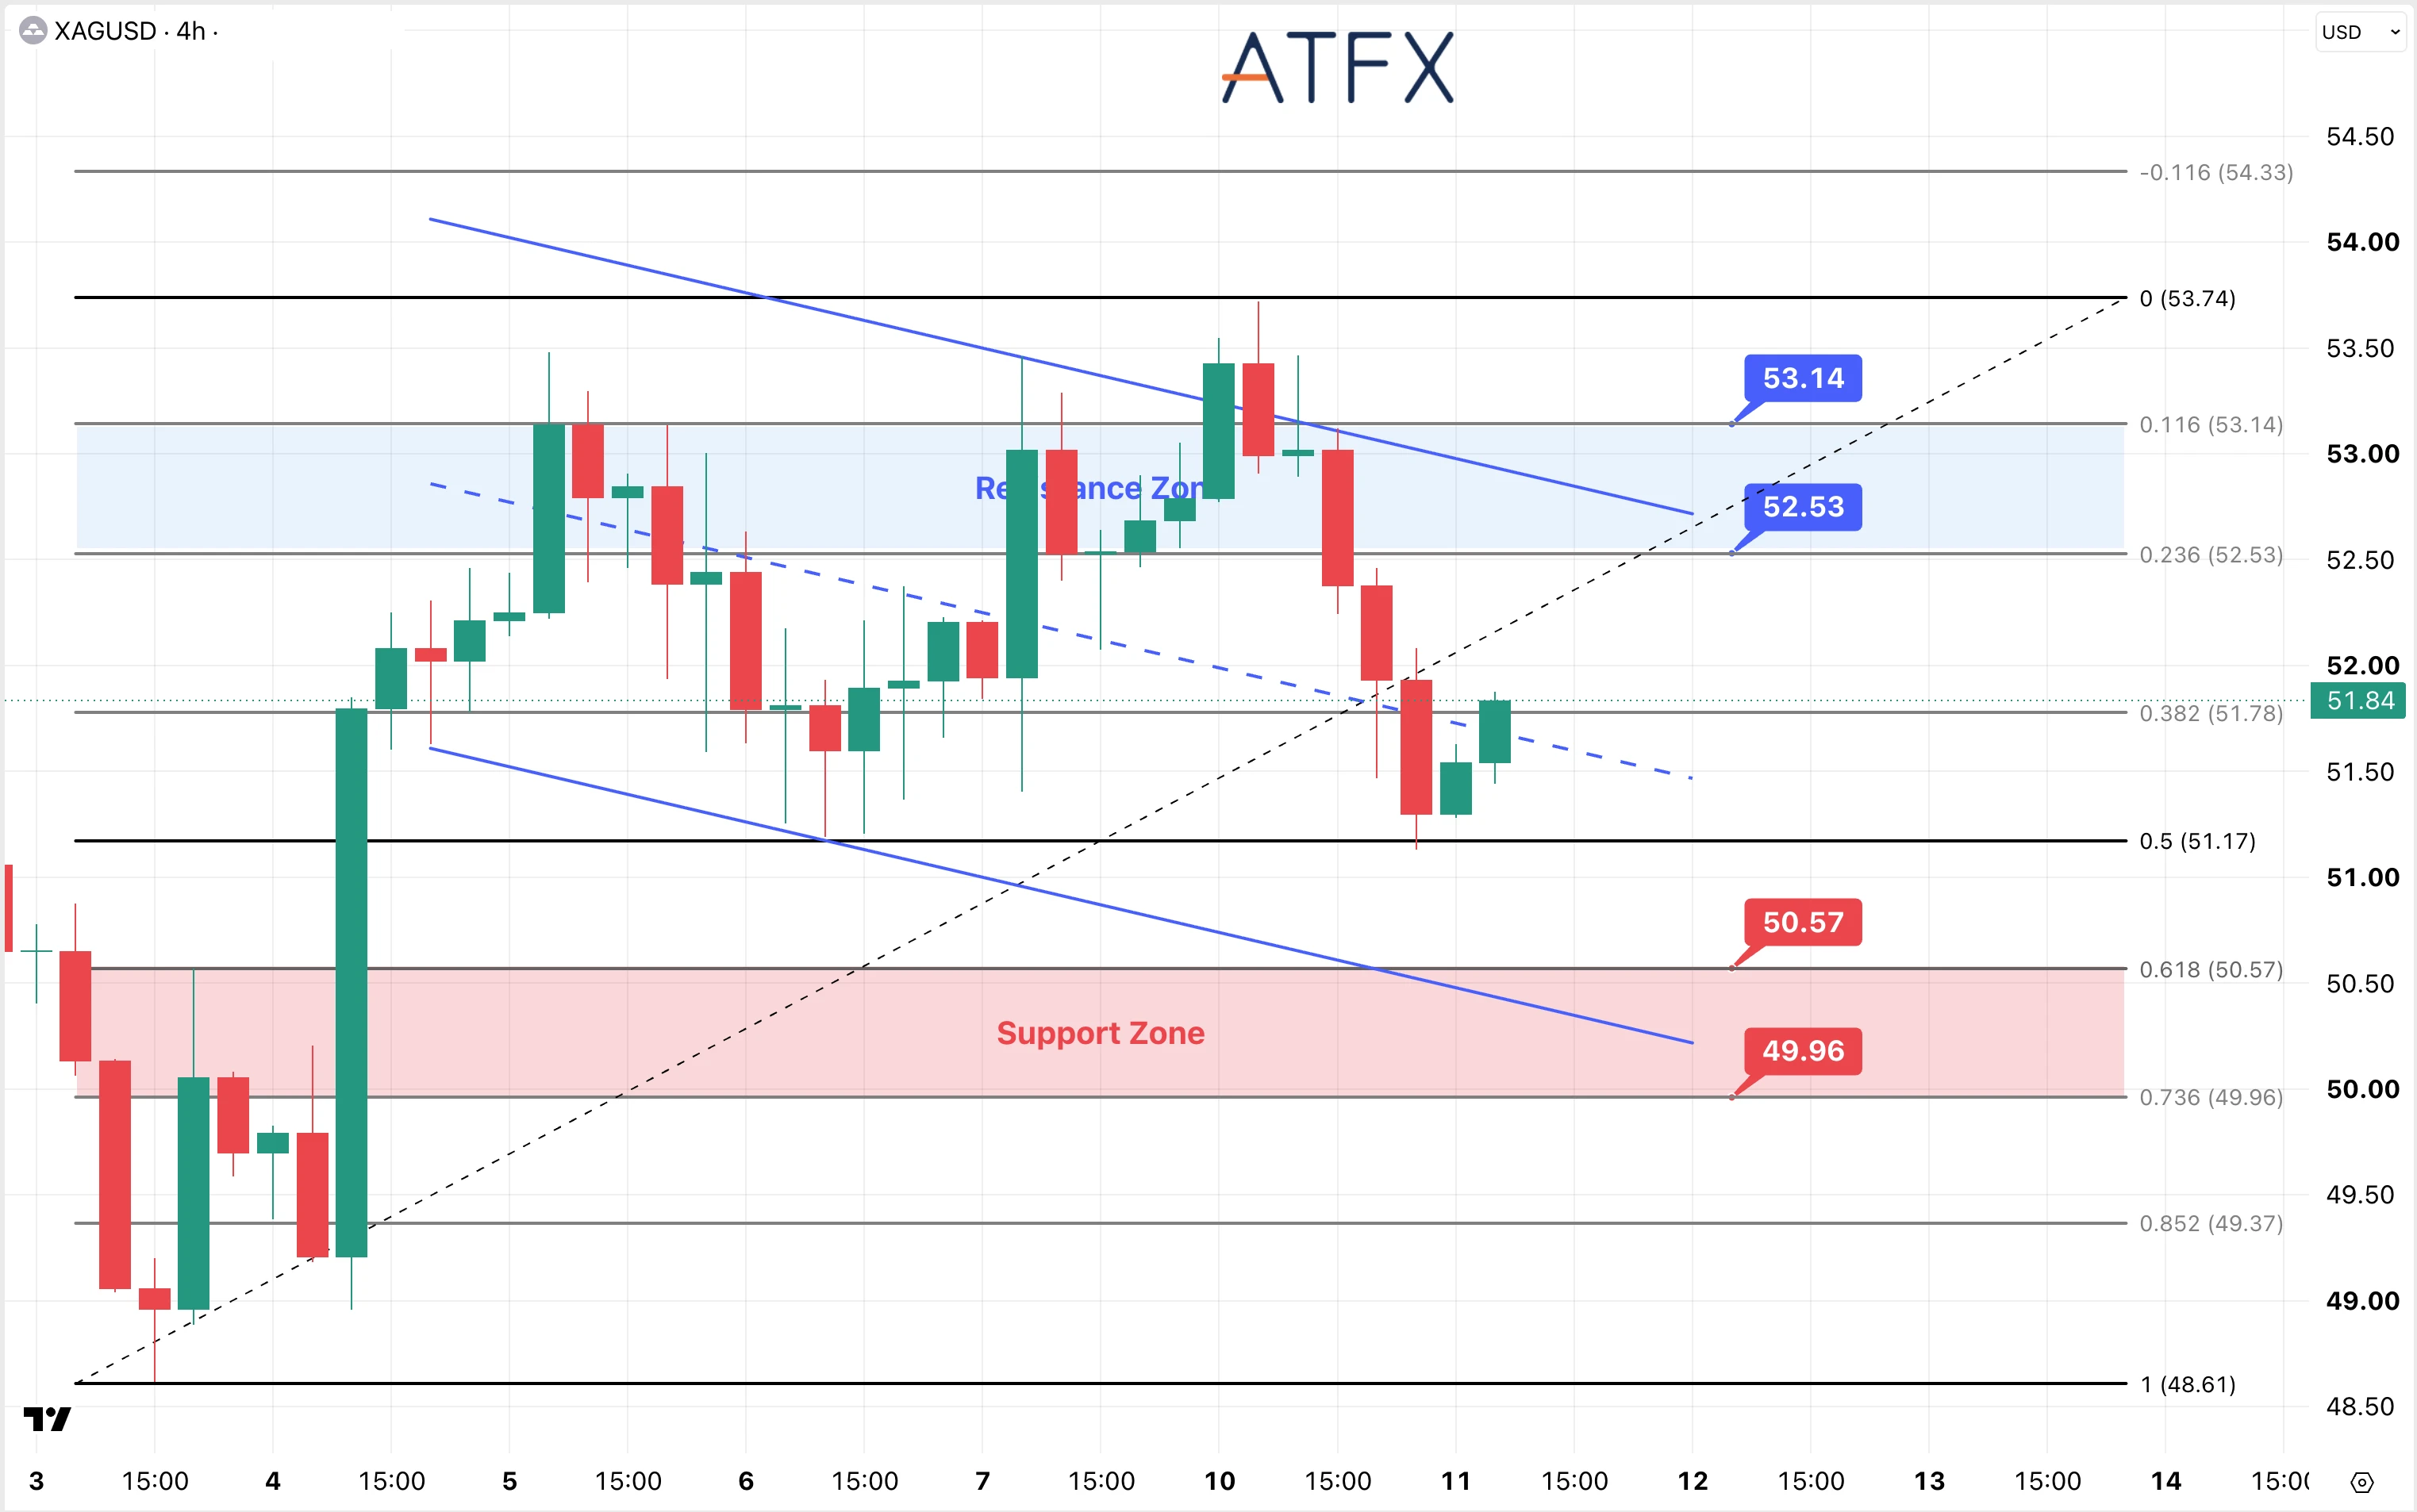
- Resistance: $52.53 / $53.14
- Support: $50.57 / $49.96
Analyst’s View: Higher US yields and a stronger dollar have outweighed gold’s haven appeal. With a December Fed hike fully priced in, the size and pace of further tightening remain key risks for the metal.
Gold: Pulled back from around $4,149 to $4,083, $4,043, and roughly $4,033. It’s holding above about $4,010 near the channel midpoint, but the selloff has not reversed. A close below $4,010 targets $4,000, then roughly $3,977–$3,944. Losing $3,944 risks $3,911 and further weakens the rising structure.
Silver: Fell from about $53.74 to below $52.53 and tested around $51.17, then rebounded to about $51.84. The bounce is stalling near roughly $51.78/channel midpoint—no clear reversal yet. If about $51.78 fails, $51.17 comes back into play; below that, roughly $50.57–$49.96, then about $49.37.
Bias: Gold cautiously bearish, silver neutral to cautiously bearish
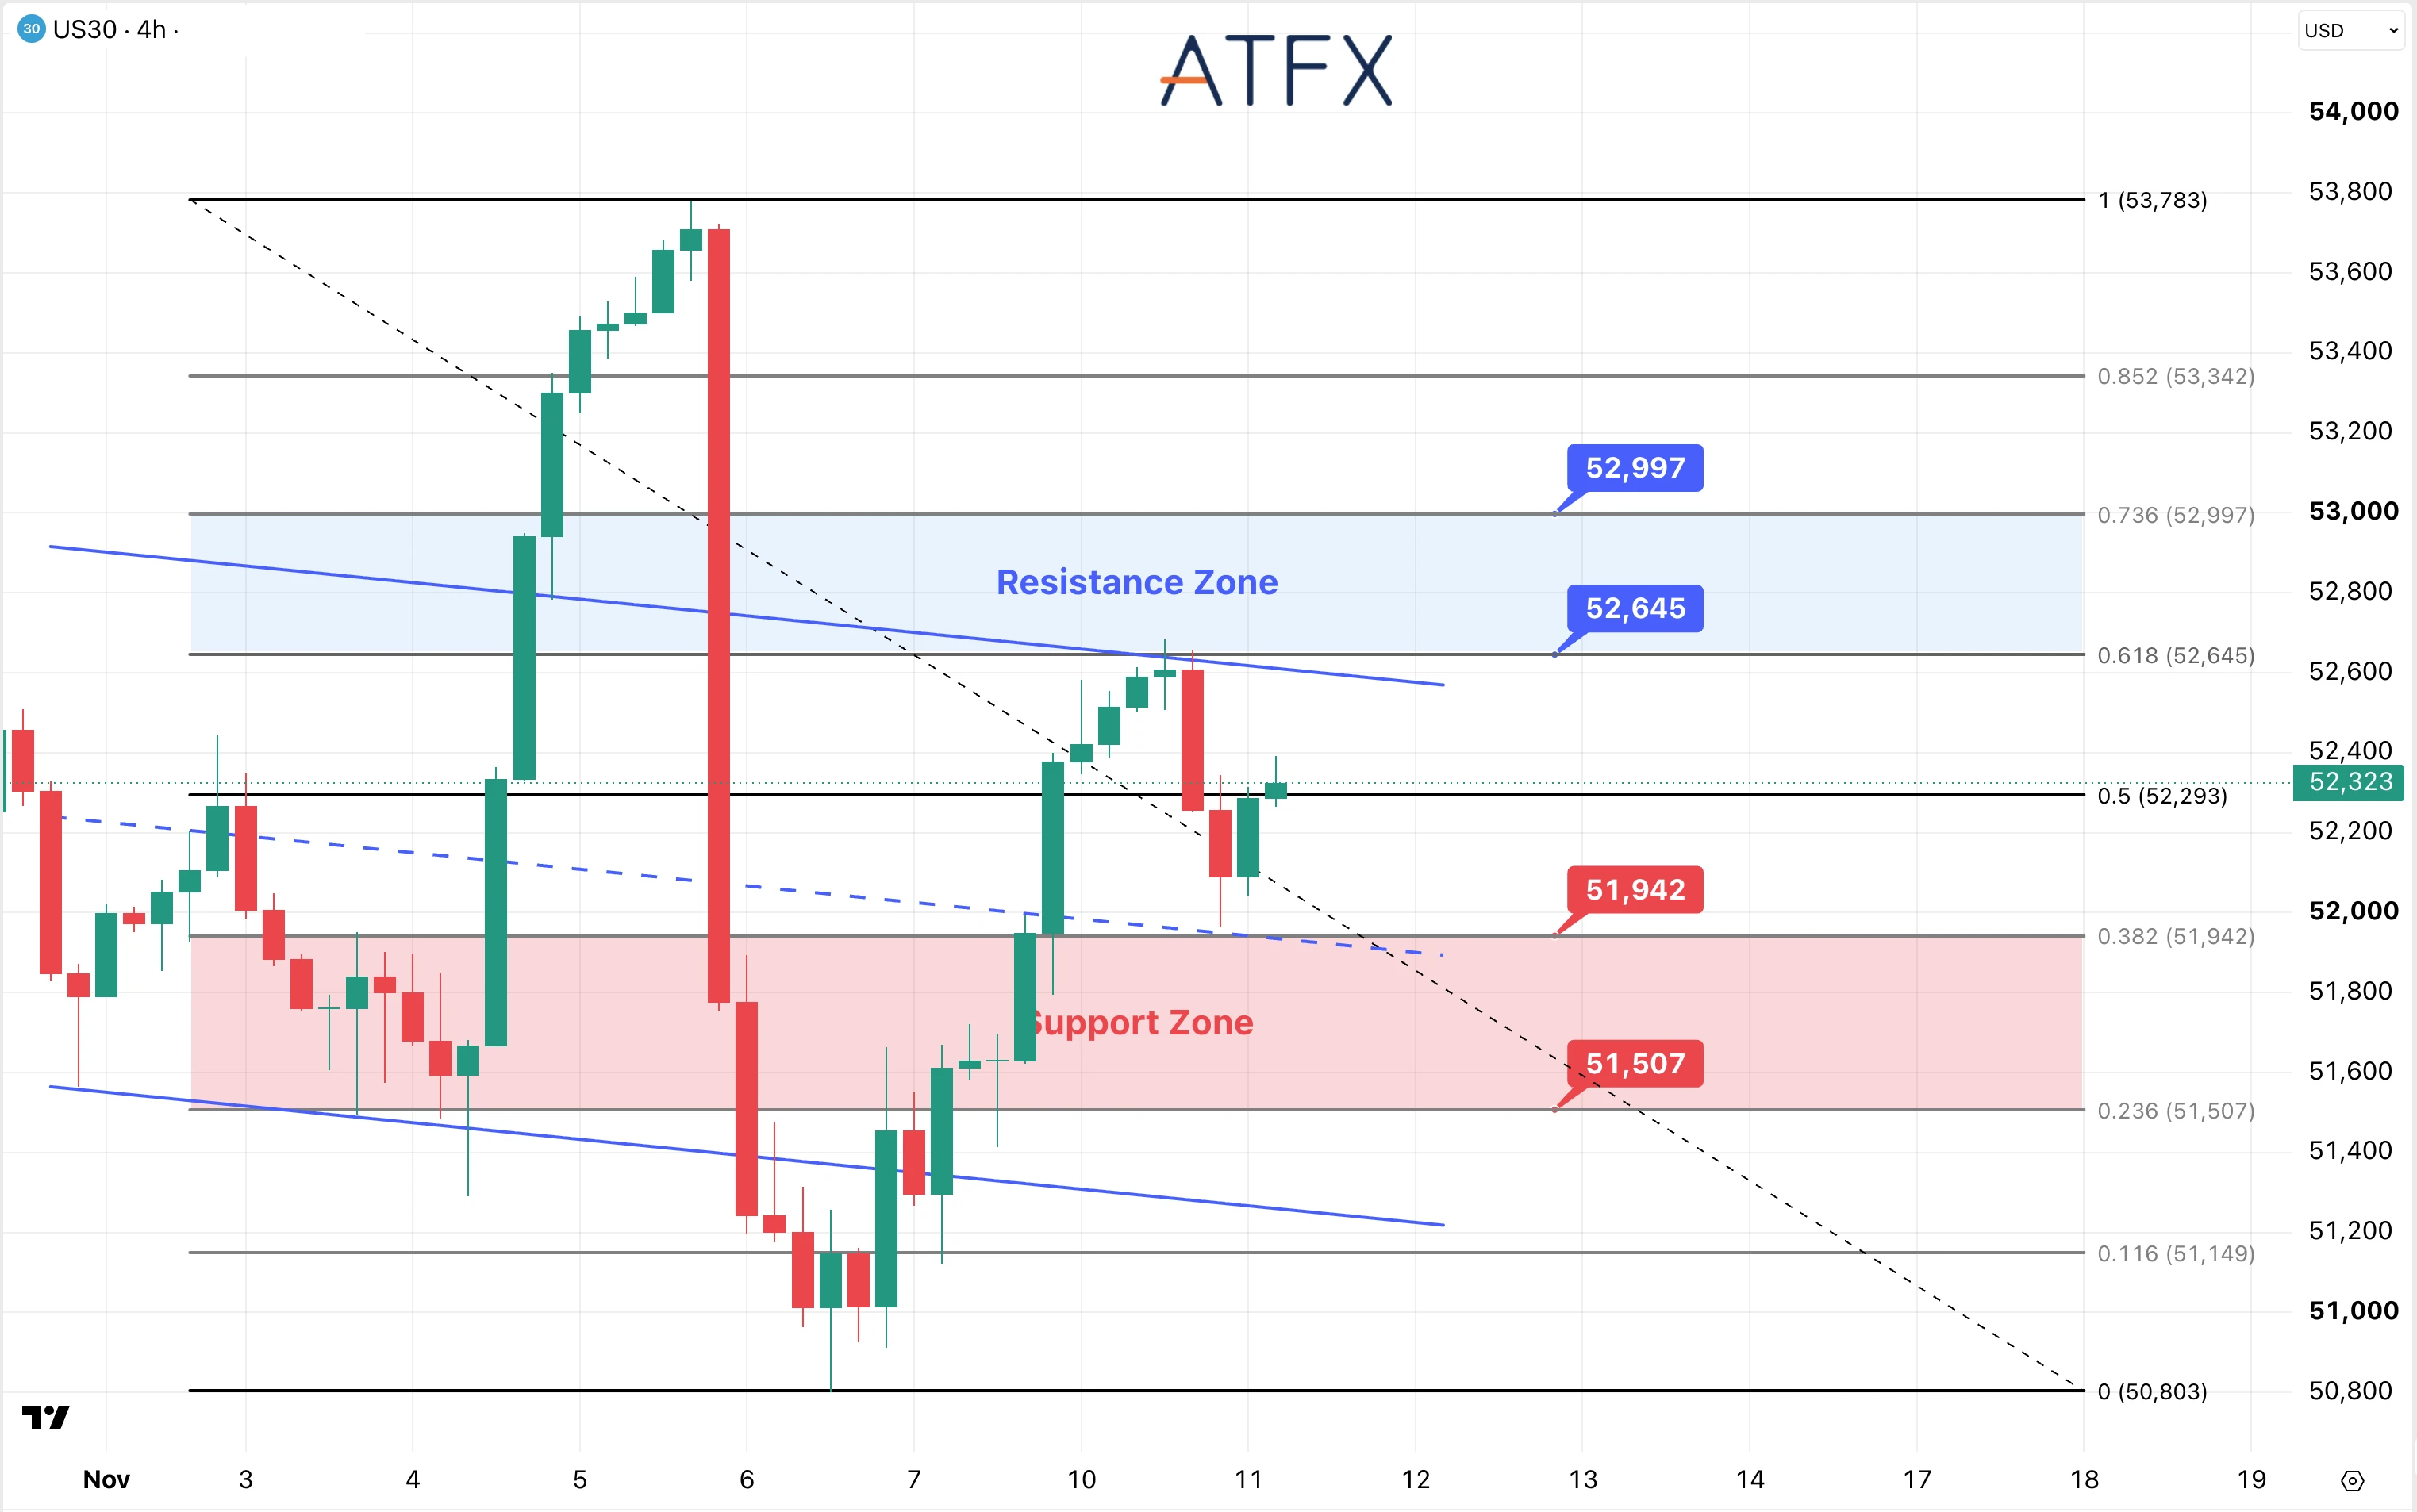
- Resistance: 52,645 / 52,997
- Support: 51,942 / 51,507
Analyst’s View: Hot US inflation and rising yields interrupted Monday’s equity rebound. More borrowing-cost increases could weigh on valuations, while the Dow remains sensitive to the broader growth outlook.
DJIA’s recovery stalled near 52,645 and the channel’s upper boundary. The pullback held above 51,942 before price rebounded to 52,323, near the 52,293 midpoint of the prior decline.
Holding above 52,293 would keep 52,645 in play. A four-hour close above 52,645 would strengthen the recovery and bring 52,997, then 53,342, into view.
A close below 52,293 would shift attention to 51,942. Losing 51,942 would expose 51,507, with 51,149 next if the decline continues.
Bias: Neutral
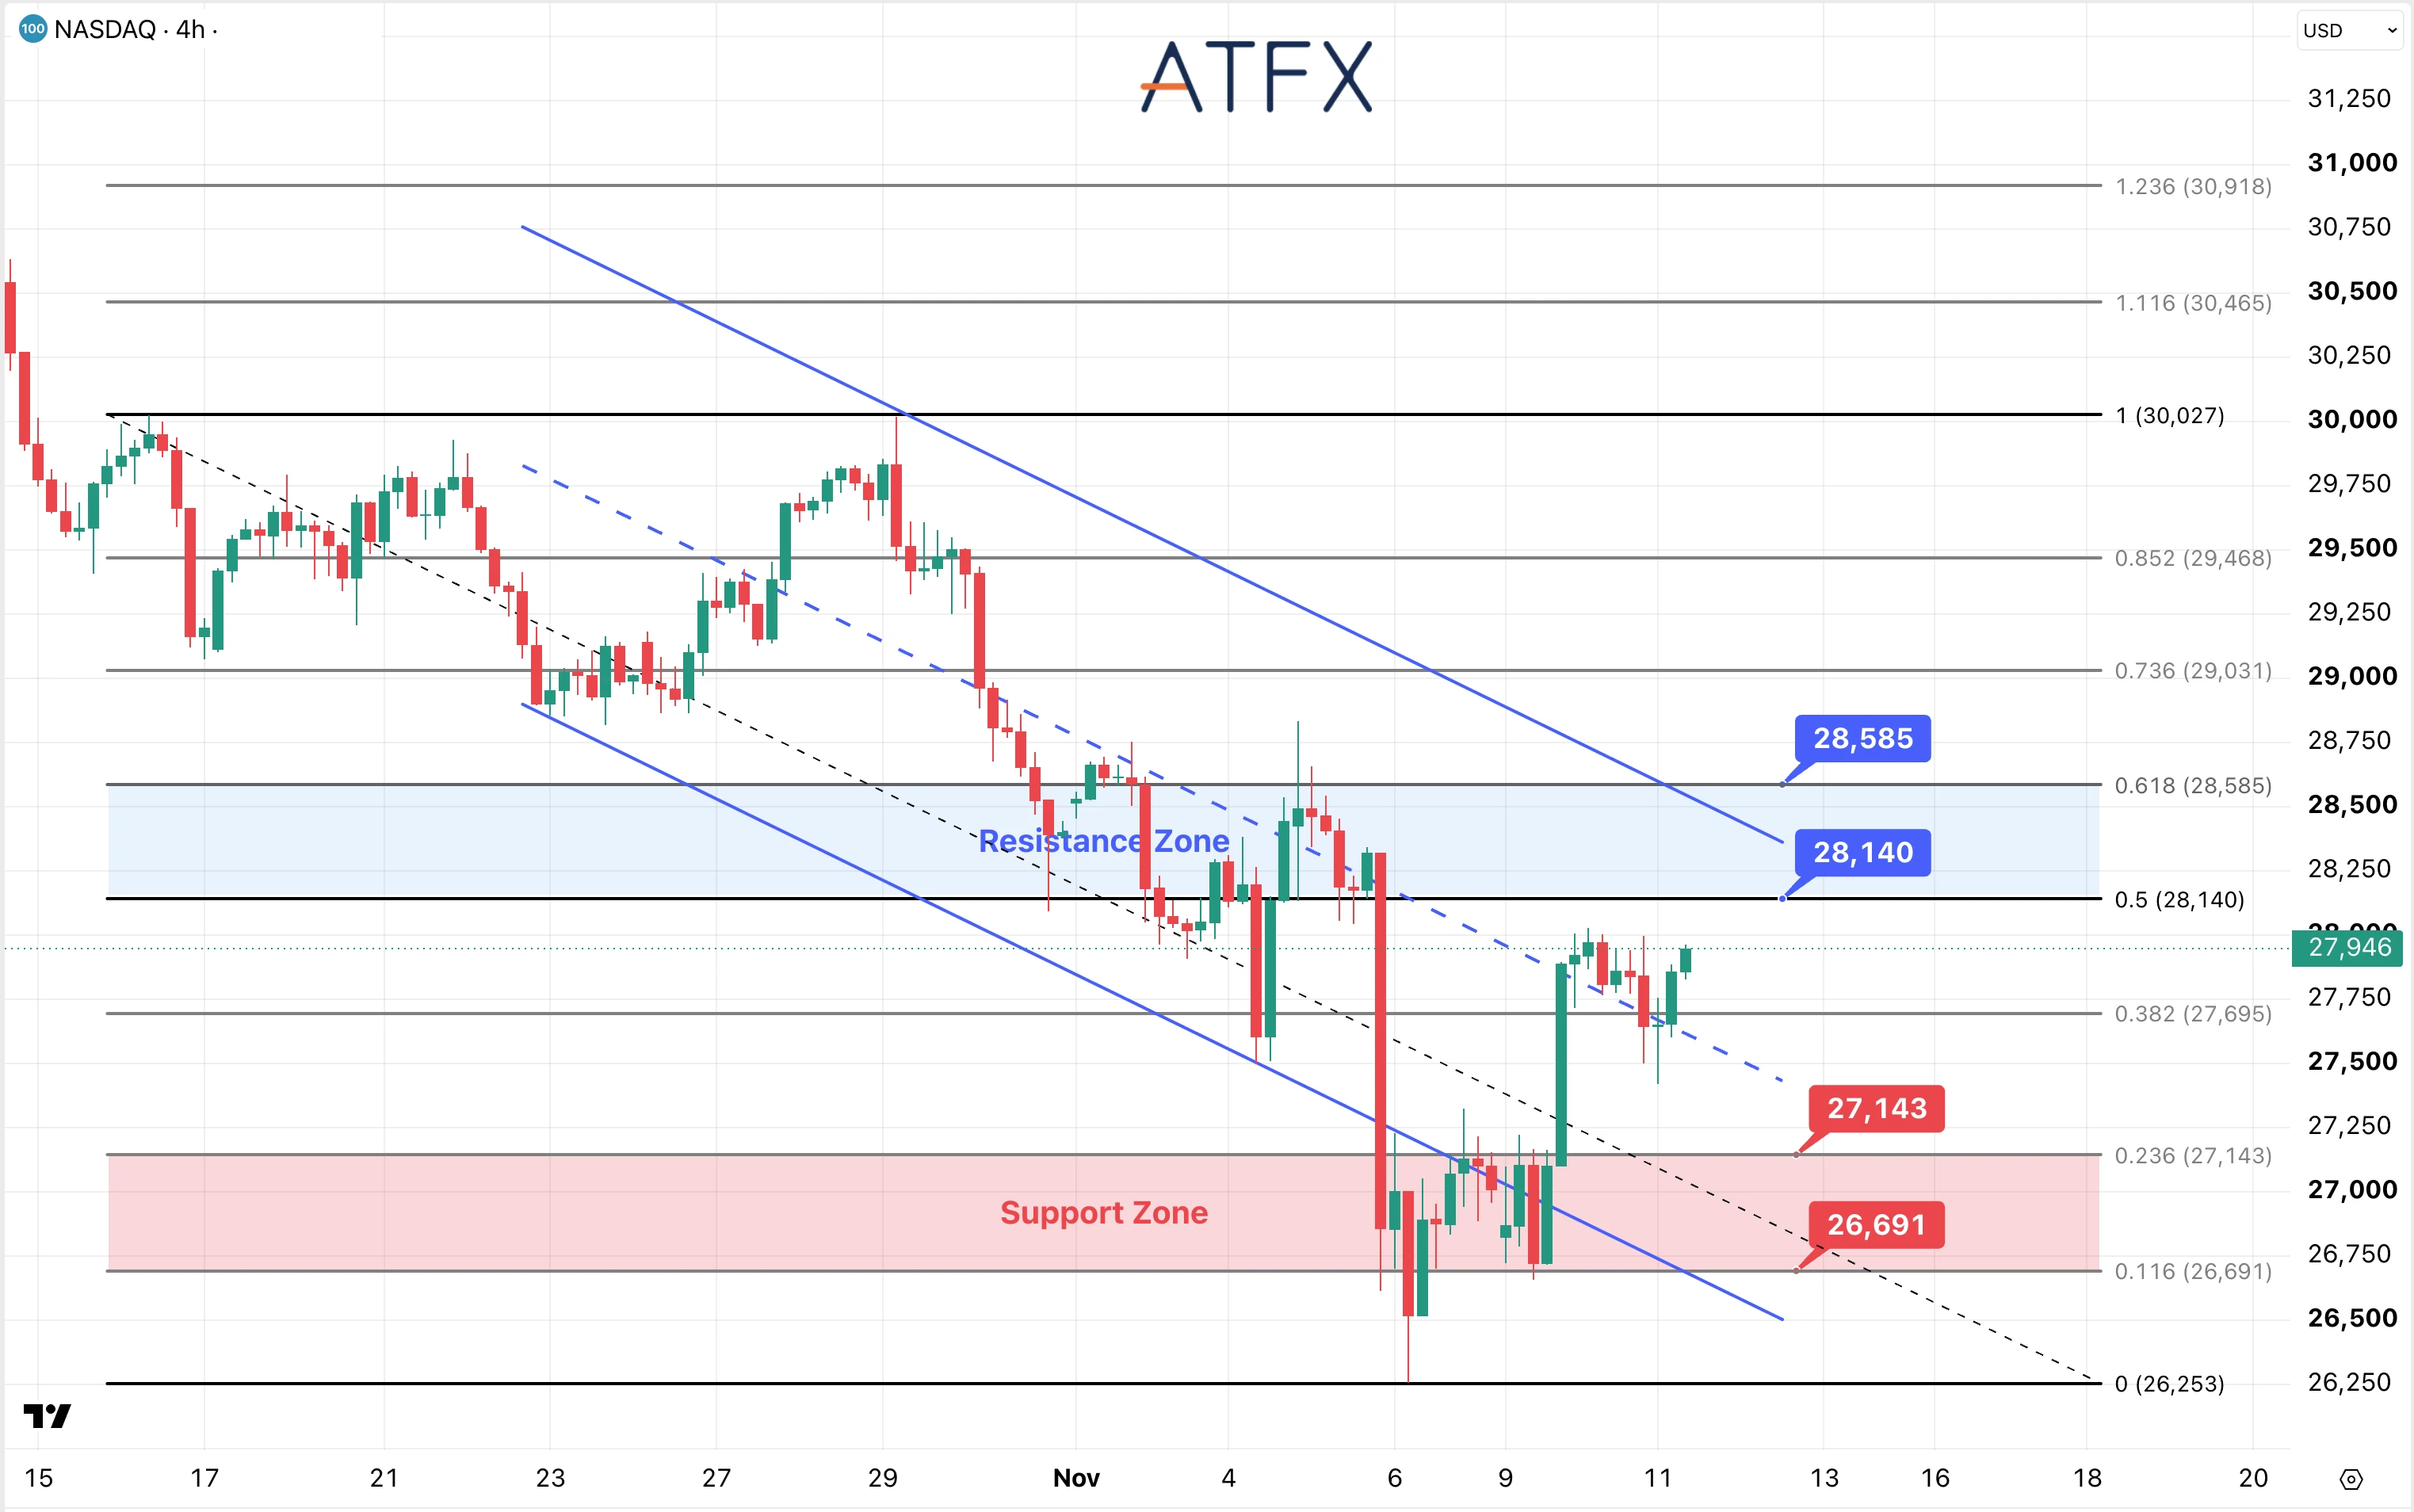
- Resistance: 28,140 / 28,585
- Support: 27,143 / 26,691
Analyst’s View: Higher yields and Nvidia’s continued decline weigh on technology shares. CoreWeave’s revenue beat and raised annual outlook provide some support, but investors still need evidence that AI investment can deliver lasting returns.
NAS100 rebounded to 27,946 after briefly falling below 27,695. It has reclaimed the channel midpoint but remains below 28,140, the prior decline’s halfway mark.
A four-hour close above 28,140 would target 28,585 near the upper channel boundary. Sustained trade above that zone would bring 29,031 into view. A close back below 27,695 would weaken the rebound and expose 27,143–26,691. A break below that support zone would refocus attention on the 26,253 swing low.
Bias: Neutral
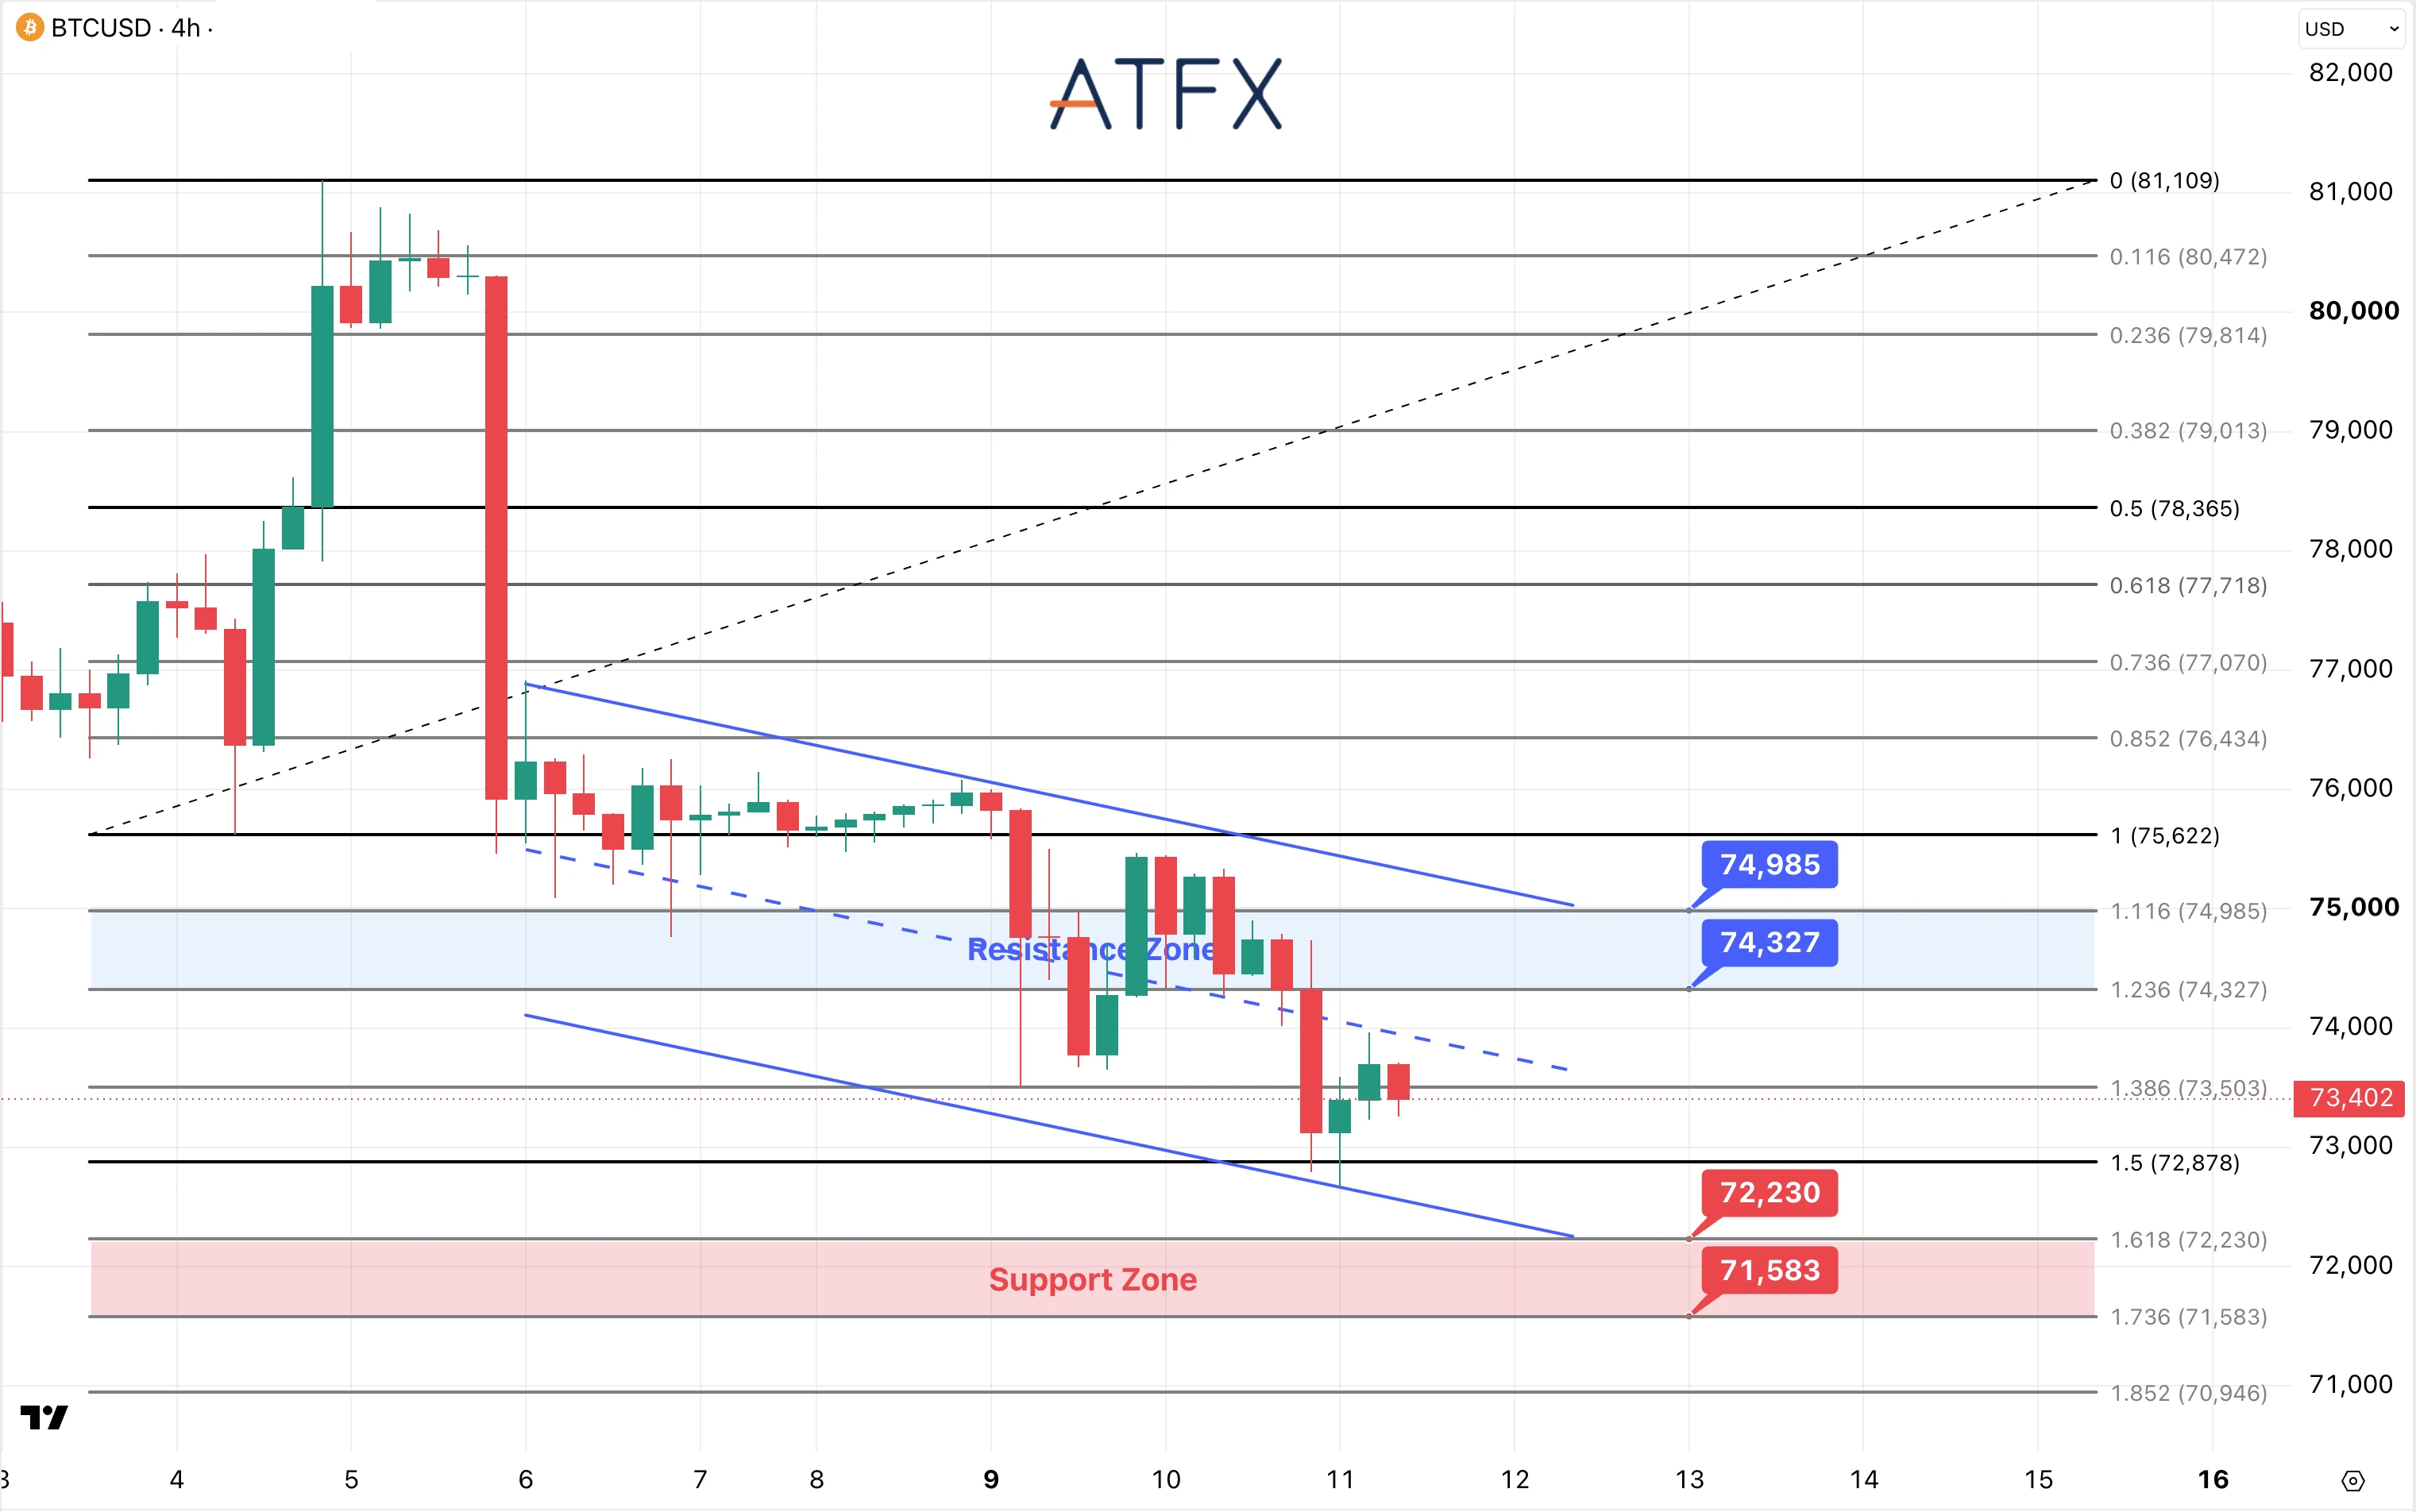
- Resistance: $74,327 / $74,985
- Support: $72,230 / $71,583
Analyst’s View: Higher US yields and a stronger dollar are pressuring Bitcoin and other risk assets. Recent spot ETF outflows and tighter US crypto oversight concerns add to the cautious backdrop.
Bitcoin is near $73,402 after dropping below $74,327. It briefly fell under $72,878 near the descending channel’s lower boundary, but the rebound stalled below the channel midpoint and $74,327. A close below $72,878 would expose $72,230–$71,583. If $71,583 fails, the next target is $70,946.
Bias: Cautiously bearish
Disclaimer: This analysis is for informational purposes only and does not constitute investment advice.